Natural Gas & oil UpdateOil looking strong and testing a bearish range breakout.
Natural Gas back testing a key support zone.
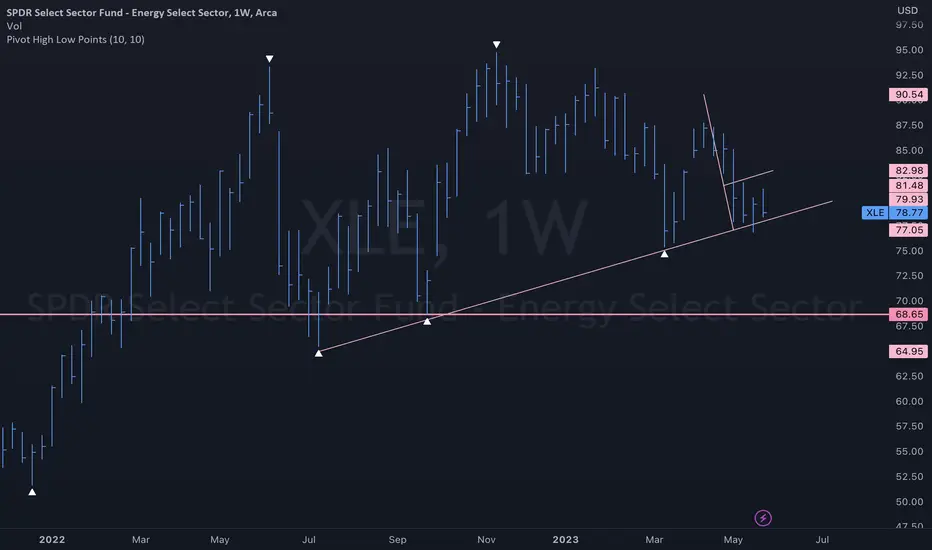
XLE

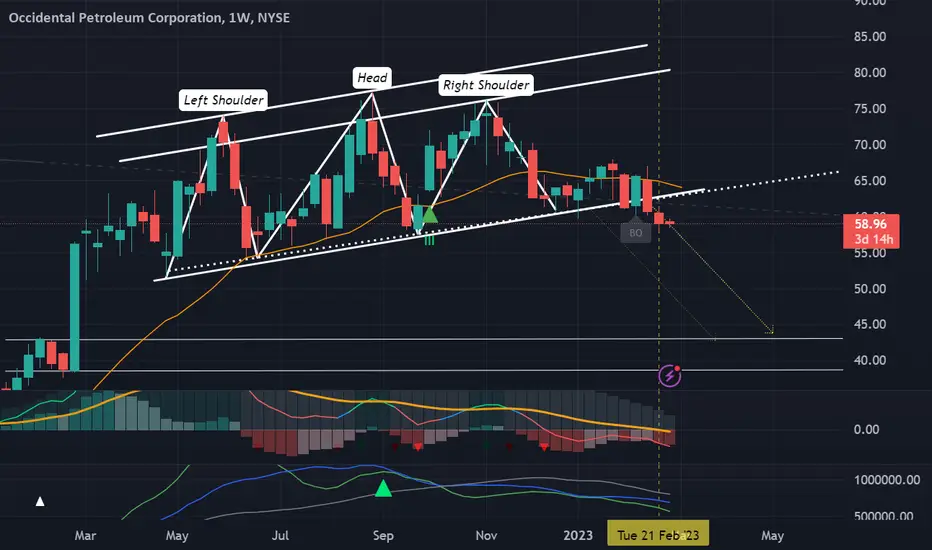
OXY breakdown is clearJust over 6 months ago, OXY was flagged to technically not do the expected rally as it broke down of the H&S shoulder. Many had bought in following the reported Berkshire's purchases of OXY , BUT technicals was telling of another type of scenario. Watching the breakdown was rather painful as it stretched over the last 6 months, with a recovery attempt that failed the shoulder line the second time, as if not clear enough.
Finally, this week closed below the channel trendline (adjusted from previous analyses). Furthermore, this is the 52 week second lowest weekly close... good enough to tell that it will be the 52 week lowest close soon.
Technicals are bearish, not very but clearly.
Therefore, more downside is expected up till October and looking at a target of 50.
The bearish marubozu may be indicating the rather strong downward momentum too.
Point here is that it was clear and heads up given 6 months earlier. Now, we take delivery.
Also note that the USD appears to be strengthening (a lot?) and this can push the breakdown further and faster. The overall equity markets are overbought, and if it is time for a retracement, then OXY can be affected further.
Heads up... again.

$XLE Bear Flag AMEX:XLE Bear Flag on the weekly chart, Close on a weekly basis first target is the horizontal line.
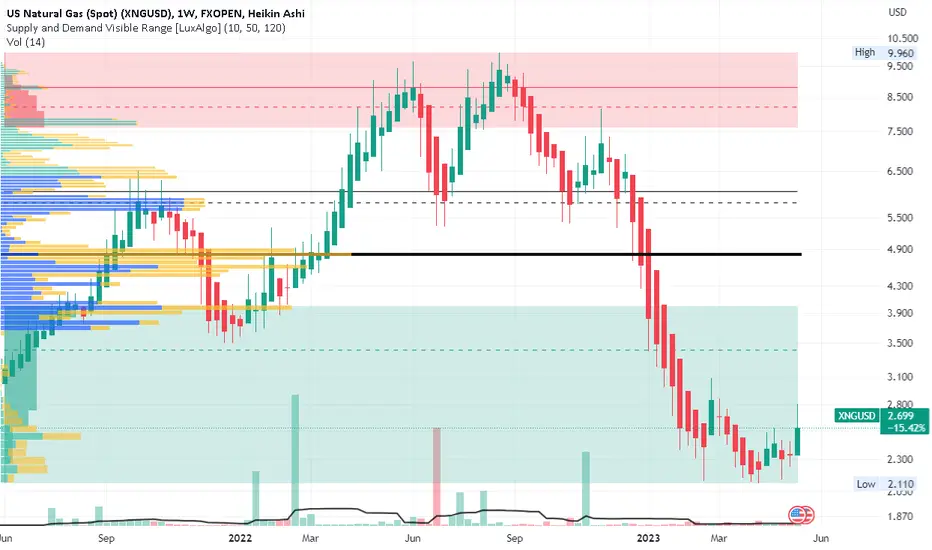
Can XNGUSD short squeeze?XNGUSD on the weekly chart showing two years of price action with weekly candles
shows the rise in 2021 into spring 2022 then printing a head and shoulders pattern
and the reversal to deep into the support/demand zone. The volume profile shows
the majority of the trading during this time period to have been between $3.75 and
$ 8.50. It would seem likely that there are a sizeable amount of short sellers holding
positions with unrealized profits of 50% to as much as 300%. This past week had the
best buying volume in six months and provides bulls with optimism
If natural gas can gain some momentum and put in green candles with a decent price range for
a couple of weeks in a row, the combination of new buyers with new interest and short sellers
liquidating and buying to cover their unrealized gains might ignite a bit of a rally for natural
gas. I will keep natural gas on watch. I will keep in mind that a breakout without a
corresponding volume the response could be a fakeout. A stop loss would be $1.95 below the
support zone while the final target would be $4.75 below the POC line. Interval take profits
would be 10% of the forex lots every time the price rises by $0.50 for risk management and
good profit taking while underway.
ERX Energy is backERX is a leveraged ETF tracking the energy sector. On the 4H chart it has been in a downtrend
since mid-March. IT dropped to the bottom of the high volume area on the long term profile
as well as the lowermost VWAP band. Firday May 12th marked the reversal with buying volume
replacing selling volume and then a significant rise in price in the past week.
On the AI moving moving average indicator, the optimized shorter Hull moving average
(red line) has crossed over the longer EMA moving average ( blue line) as has the price.
I conclude the energy sector is heating up. My new idea on BOIL supports this. I will take
trades with energy in mind and review big oil stocks and natural gas stocks as well as
pipeline and oilfield services stocks.


XOM DailyIt's time. I took a small position yesterday as XOM dipped to the Gann line, which is also a 78% fib retrace. Fresh off a dividend EX. The XLE sector is oversold.

Natural Gas & Energy UpdateNatural Gas is on watch for a technical Breakout
We got a bullish daily close on Natural gas today.
Its the first time Nat gas has had 2 daily closes above the 50 day moving average since it started the nasty downtrend.

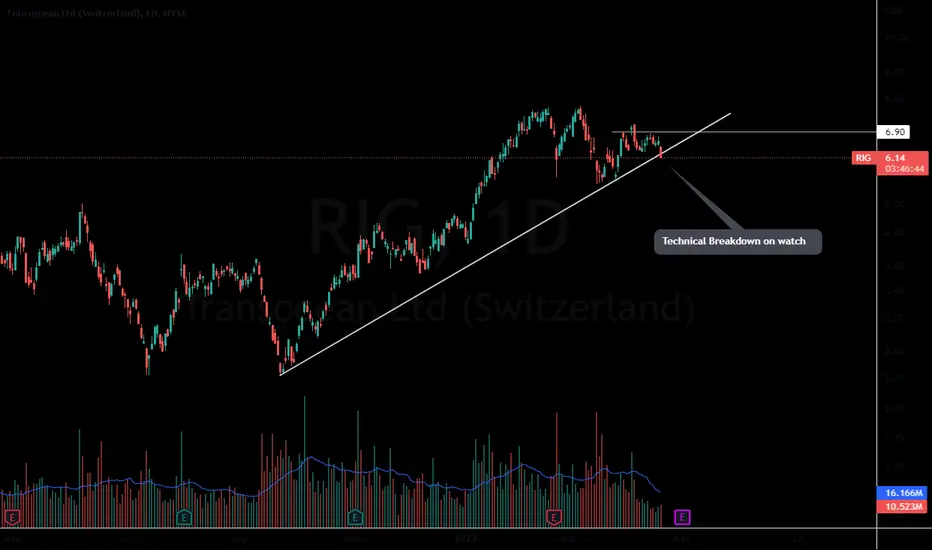
RIG technical Breakdown on Lower guidanceRIG may be signaling some weakness in the energy sector.
This heavily indebted stock has massive movement when oil is strong but the same can be said when oil is wweak.
Poor guidance knocking & breaking the trend...On watch for continuation.
Ascending Triangle On The Daily Chart Ascending triangle on the daily chart w/ a strong setup for more upside contingent on a daily close above the ascending triangle resistance at $87.20.

XLE Energy Select Sector Price TargetAfter the Organization of the Petroleum Exporting Countries supply cut and considering the Elliott Wave Chart Pattern, i would say the next price target for XLE Energy Select Sector SPDR Fund is $92.60.
Looking forward to read your opinion about it.

$XOM wedge break out, looks like it wants this bear gap on daily$XOM wedge break out, looks like it wants the bear gap on the daily
If we can close the gap at the $107.78 PL we can extend to the $109 PL otherwise we double top and retest the $106.8 PL

XLE closed below the critical lineDaily had a retest and got rejected. It could have more fluctuation around this area but likely more downside is ahead with in the next month.

is Oil about to breakdown?Oil has hit some near term support at the weekly 200 MA but don't be fooled by this level. Its no longer a major support level.
If tomorrows weekly close closes outside of the white wedge pattern this chart looks extremely vulnerable to more downside.

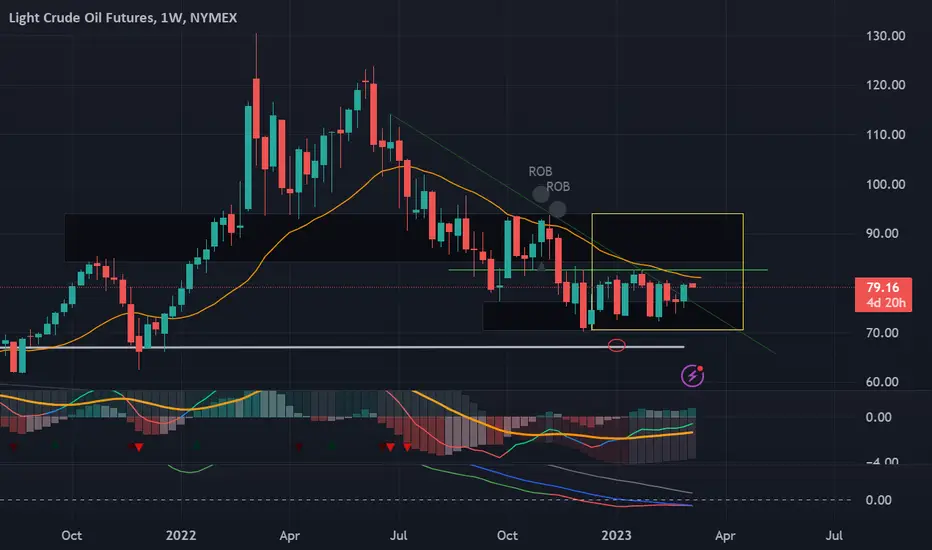
CRUDE to bounce too!Been a while since crude futures were reviewed, and since the last post, crude categorically dropped... but it maintained a decent range between 70-80/82. The thing about crude now is that it appears to be coiling and is starting to show signs of a break out.
Here is how I see it... the candlestick pattern (especially in the Daily chart, not shown here) is bullish, at least leaning towards bullishness. The MACD is aligning up, and the VolDiv is tapering but not crossed over yet. The MACD is forming that not so subtle anymore bullish divergence. Also noted that the TD Sequential is still in bullish primary trend mode (not shown here).
Now, to qualify a good break out, we need to set some parameters. 82 is the break out resistance level (green line) and this is about half of the range since August 2022. Coincidentally (or not), the 23EMA is at 81, and the weekly price needs to close above 81. And a really good break out (out of the yello box range) above 94 would be seriously bullish, although that might mean the Ukr-Russ conflict might have escalated.
Sidenote that the USD in a choke-hold and depreciating would help Crude rally up more.
Alternatively, a 23EMA failure, MACD cross under can happen as the VolDiv accelerates further into bearish territory. a close below 72 would favour the bear case.
Given the longer term view, it appears Crude is ready for a (surprise) bounce, and is likely to revisit the last low in December 2022, probably May-July 2023. While this is not obvious in the weekly chart, the Monthly chart TD Sequential indicates, so heads up.
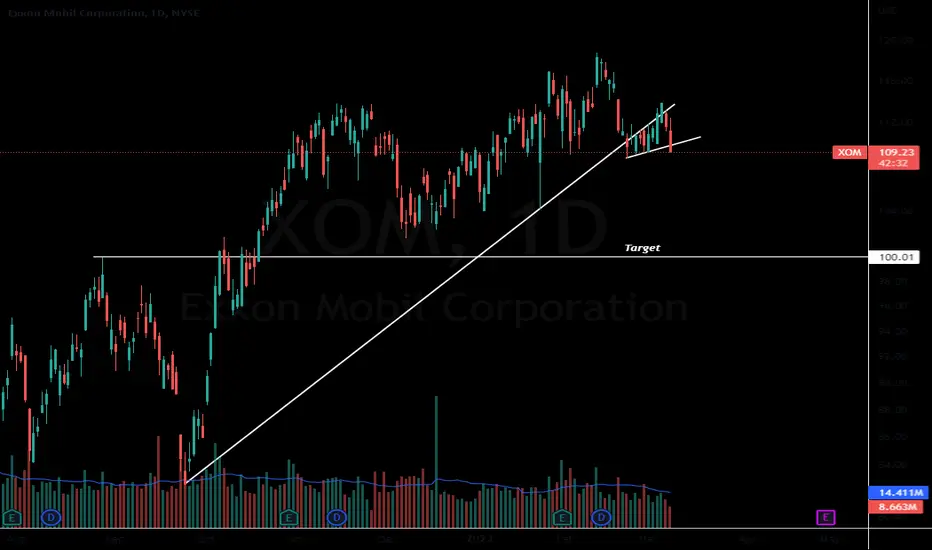
XOM breaking downWith the recent weakness in Oil and natural gas, its likely impacting the performance of XOM stocks going forward. XOM is testing some key areas. If the levels break the target on XOM is $100.00
OXY Oops... Previously, posted about the head and shoulders (potential) breakdown of OXY, based on the technicals. Thereafter, there was a weak attempt to recover above the 23EMA, and it faked out. Yes, for a couple of weeks, it did look like a wrong analysis, wrong call, etc. BUT the point is not about being right nor wrong, but being able to read and read it well. For this case, a bearish pattern failure is not a bullish sign. I think we need to establish this as a baseline in our psychology. A bearish pattern failure (seemingly so), in this case was an extension or delay only to show the true colours/commitment. Here, we can see that the bulls failed miserably. A failed weekly breakout, a gap down and break down of the 23EMA, a failed attempt to recover bullish grough above the 23EMA, another 23EMA failure and followed by a recent weekly low close; all with the indicators already pointing to bearishness or at least weakness since the start of 2023.
The yellow dotted vertical line is the confirmation point IMHO.
Target downside, if this continues is between 40-45, where we can look forward to some consolidation and recovery pattern(s).
Notwithstanding, a major war escalation and the likes might trigger an immediate reversal. But that's another story...
For the record, I am actually keen to accumulate OXY, but not now clearly. Not shorting it too as it is counter my initial objective of monitoring this.
Week 6 - 2023 - Weekly S&P500 Sector AnalysisDiscussing all the major weekly trends for each sector.

$XOM: Strong uptrendNice setup here in $XOM, new 52 week highs on higher than average volume with a Time@Mode trend signal confirmation this week. Monthly and yearly trends are up, overall oil stocks could continue being the best prospect with a potential rebound in inflation figures coming next, Russia 'cutting' production (likely forced to do so by the effect of crippling sanctions) and China reopening boosting aviation fuel demand, while the economy possibly dodges a recession, and business investment goes back to pre-pandemic trend levels, among other factors. The latest State of the Union speech has likely contributed to weakness in US Treasury bonds, and coupled with NFP might have triggered rotation back into value/energy from growth names ahead of CPI data.
All in all, low risk to follow this development and be positioned in value stocks and particularly energy for the coming months (and likely years).
Best of luck!
Cheers,
Ivan Labrie.

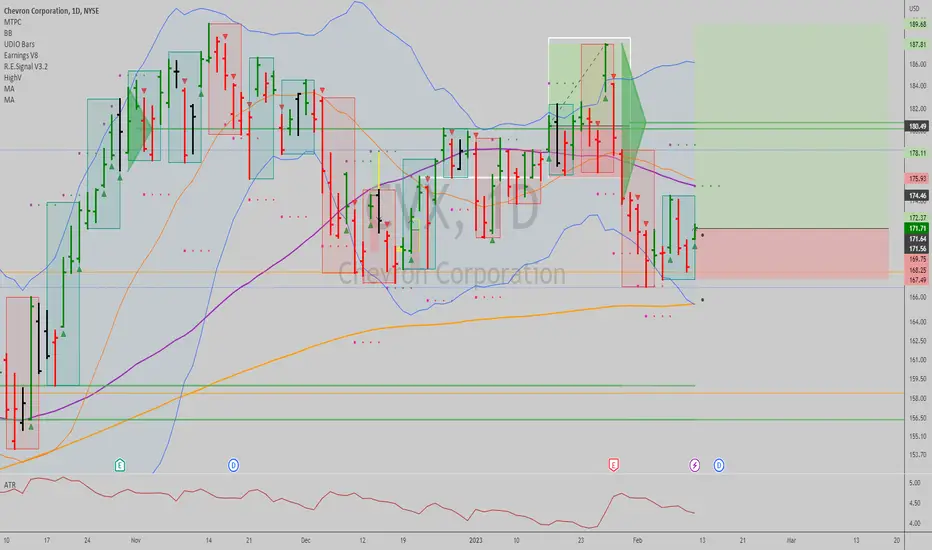
$CVX: Buy the dip...I think this is a low risk in energy here, I specially like $CVX due to the reward to risk ratio and general fundamentals and long term chart variables at play.
Best of luck!
Ivan Labrie.
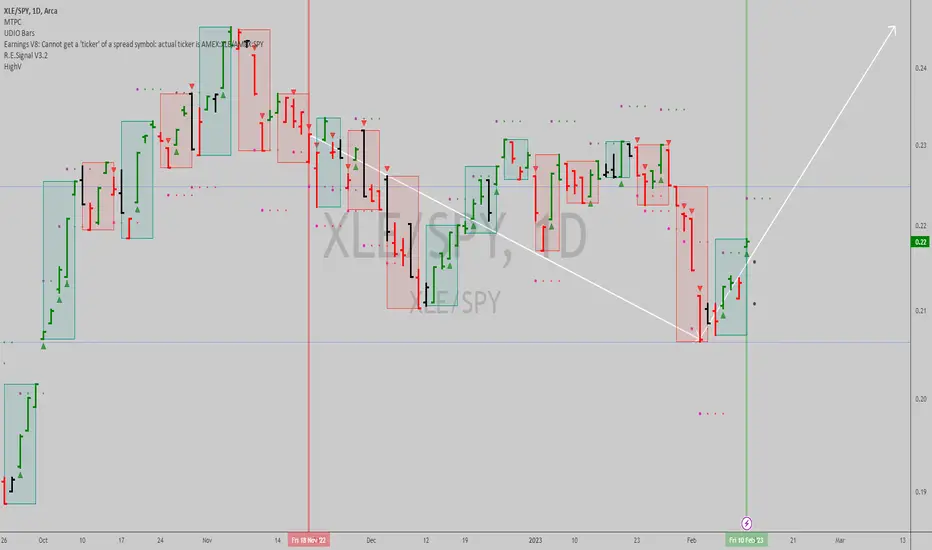
$XLE vs $SPY: Rotation back into oil stocksI think this is the play right here, right now...Might be a nice swing to the upside for oil names, specially relative to the market.
Best of luck!
Cheers,
Ivan Labrie.
Week 5 Sector Analysis: S&P 500Discussing all the leading sectors
0:15 XLK
1:40 XLV
3:45 XLY
4:45 XLC
5:37 XLP
6:26 XLF
7:33 XLI
9:00 XLU
10:54 XLRE
12:14 XLB
13:15 XLE

Relative Strength analysis of Sectors relative to Broader MarketRelative Strength analysis of Sectors relative to Broader Market
One of the fastest way to look for relative strength is to see how different sectors are performing relative to the broader equity markets.
I have recorded this 20 seconds video, and it gives a clear answer right now only energy and tech are performing
