XLE
Natural Gas looks interestingTake a look at this Nat Gas chart. It looks poised for a rotation of capital to come out of the SPY and buy it at these depressed levels.
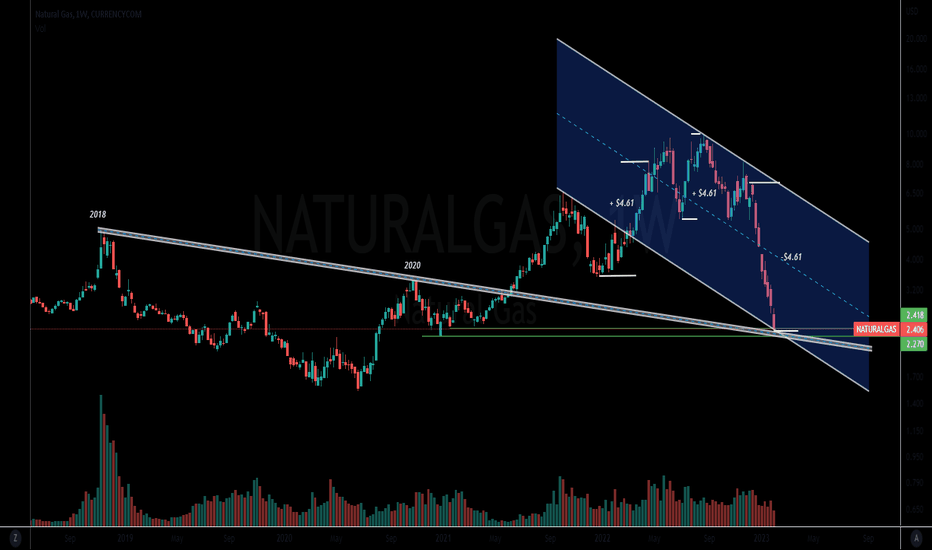
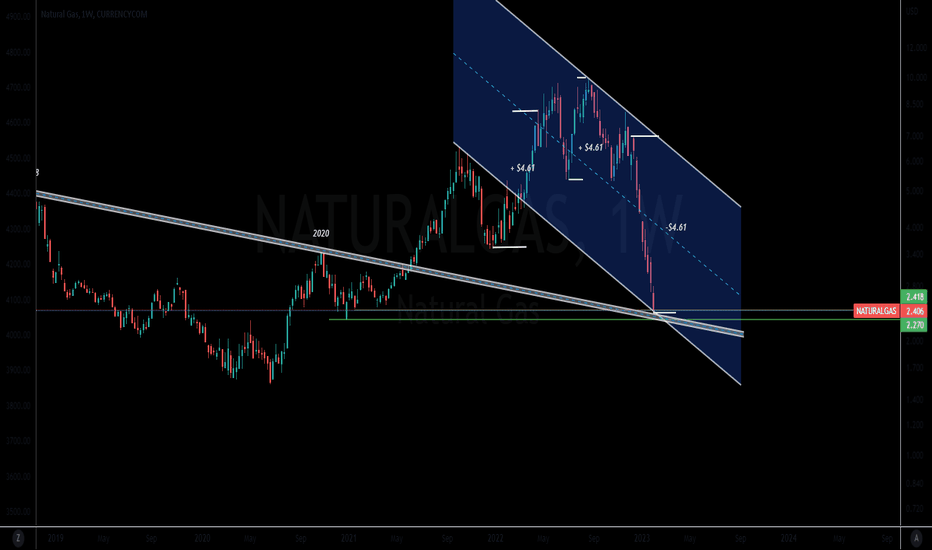
Natural Gas: The Widow MakerNatural Gas is on pace for it greatest & fastest fall in price history.
Nat Gas is hitting technical support in one of the most oversold conditions ever.
We discuss some Nat Gas cycle history that may be useful in knowing how to trade Nat Gas.
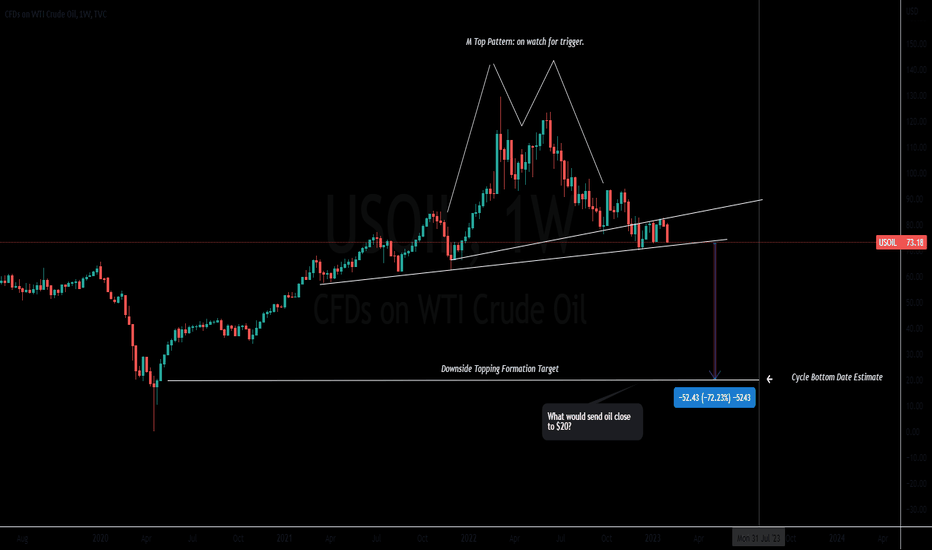
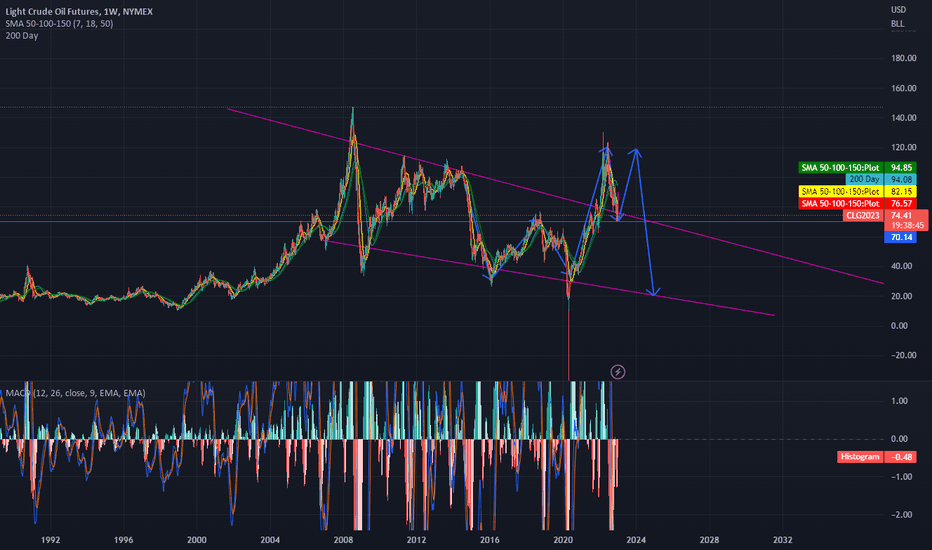
Oil is screaming...what should we be aware of?Oil the leading energy commodity is signaling negative price action.
An MTop Formation is on watch. If we get a weekly close below $70 it triggers the Topping formation and sways the probabilities in favor's for more downside action.
This large time frame pattern has a potential to go down to $20...I know, I can barely believe it myself.
A clear weekly reversal rejection has been observed off a key resistance. Downward momentum is in play.
Next potential but level im watching is $65/$66 as oil will have technical support bounces.
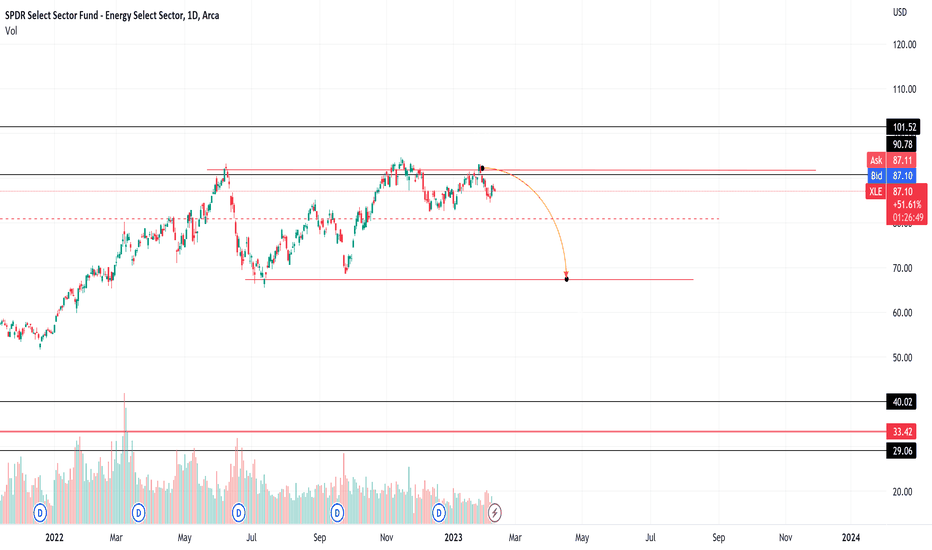
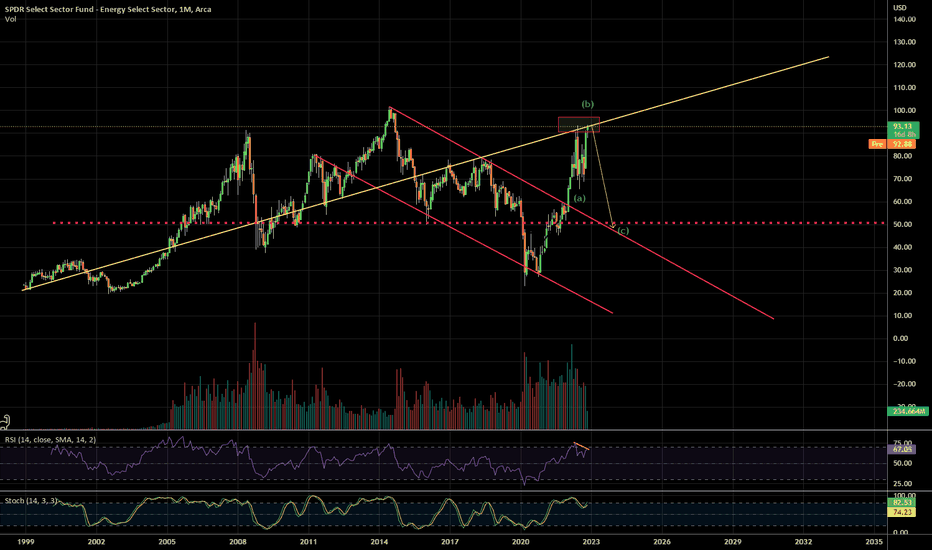
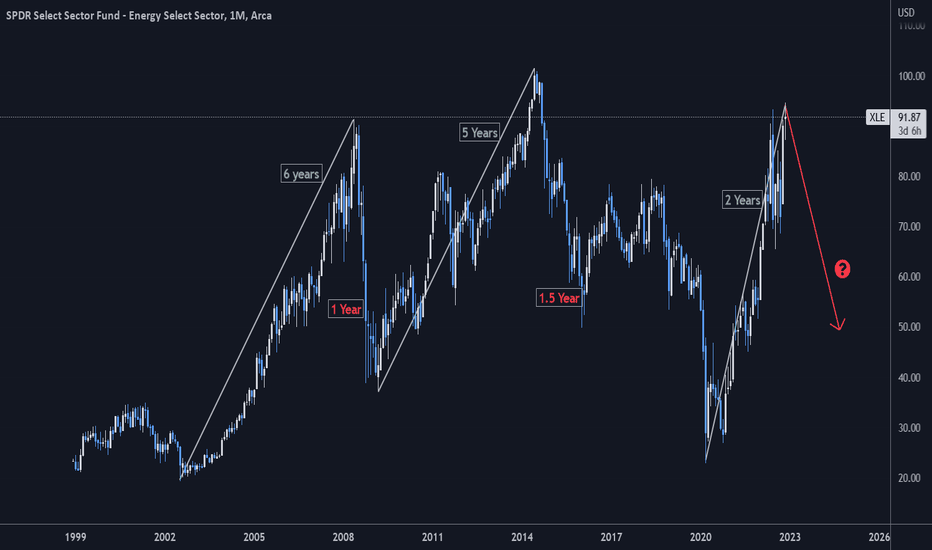
XLE - the bigger short It's a controversial call to say energy prices are going to drop dramatically into next year but this is what the XLE chart is showing.
We're at a double top with monthly bearish RSI divergence, and the same structural trendline where it fell last time. My guess is it could get back down to 50. If it's a C leg it could happen faster than most would expect. 50 area would be a confluence of support - channel trendline and horizontal trendline, also IF a C leg comes, 50 is about 1.618 fib extension from the A leg.
This idea is invalid if XLE can hold above 102 on a monthly close. Good luck!
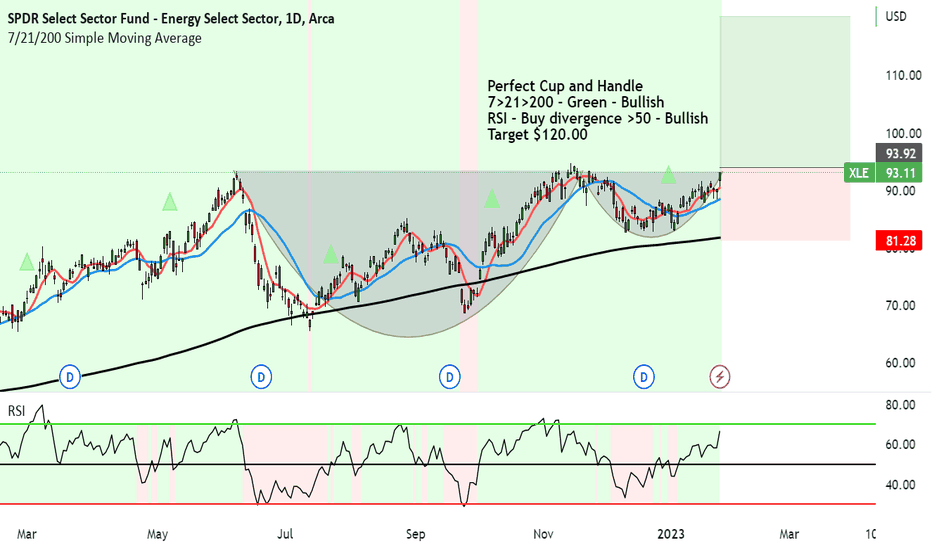
SPDR Select Sector Fund looking great for upside to $120Perfect Cup and Handle has formed with XLE.
We just need to wait for the crucial breakout and close above the brim level.
With moving averages, all is looking great with 7>21>200 - Green - Bullish
RSI - Buy divergence >50 - Bullish
Target 1 $120.00
GENERAL INFO:
The SPDR Select Sector Fund is a series of exchange-traded funds (ETFs) that are managed by State Street Global Advisors.
It is designed to track the performance of specific sectors of the S&P 500 index. There are 22 different funds covering sectors like Energy, Financials, Health Care, and Technology.
This is available as it's a cost-efficient way for investors to gain exposure to specific sectors of the market, without buying individual stocks.
This fund also gives an indication on the sentiment in general markets. Which looking at this analysis it's bullish and we can expect the markets to continue up in February. Fantastic!
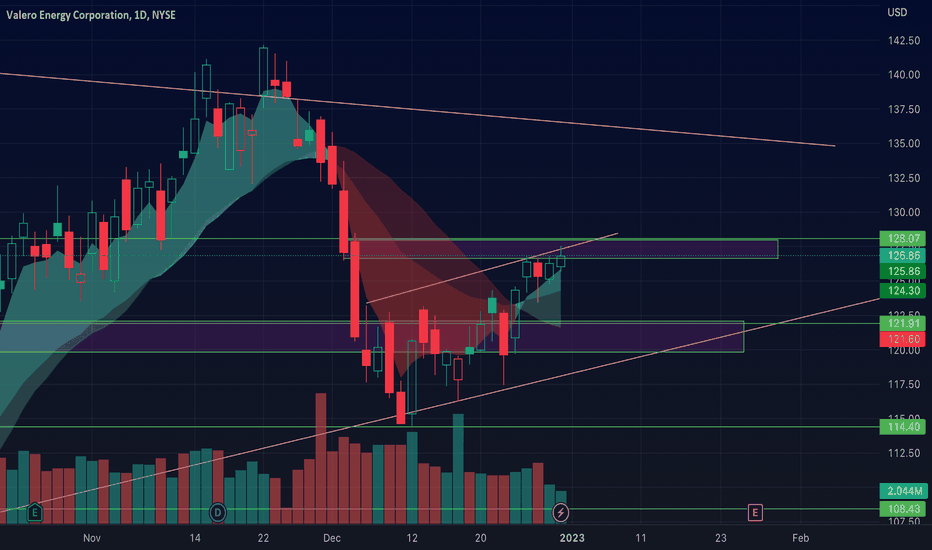
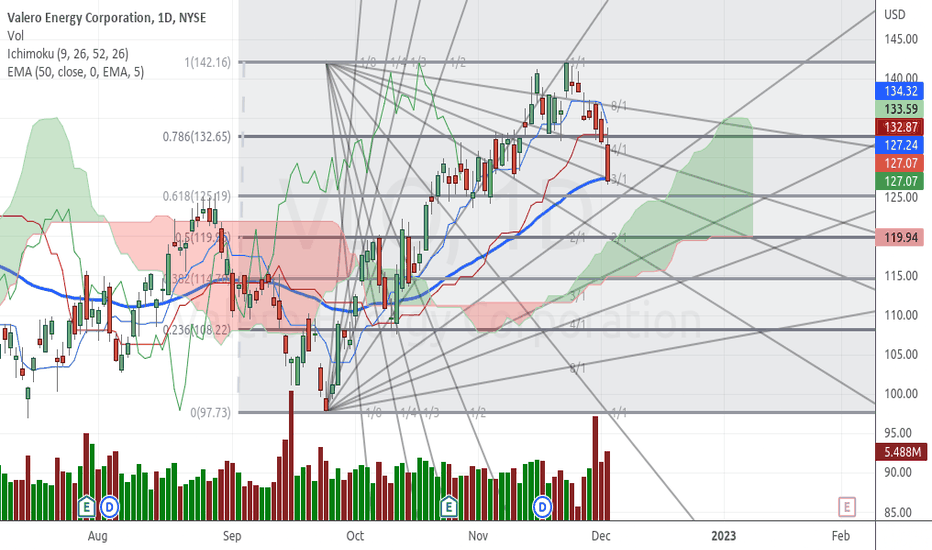
$VLO daily bear flag VLO reports earnings later this month. I have a decent long position in this name, but for a day trade or swing Idea, I like longs over 128 and puts under 124.4
I personally believe what worked in 2022 won't in 2023, so oil names may not be as safe of a hiding place for big funds this new year.
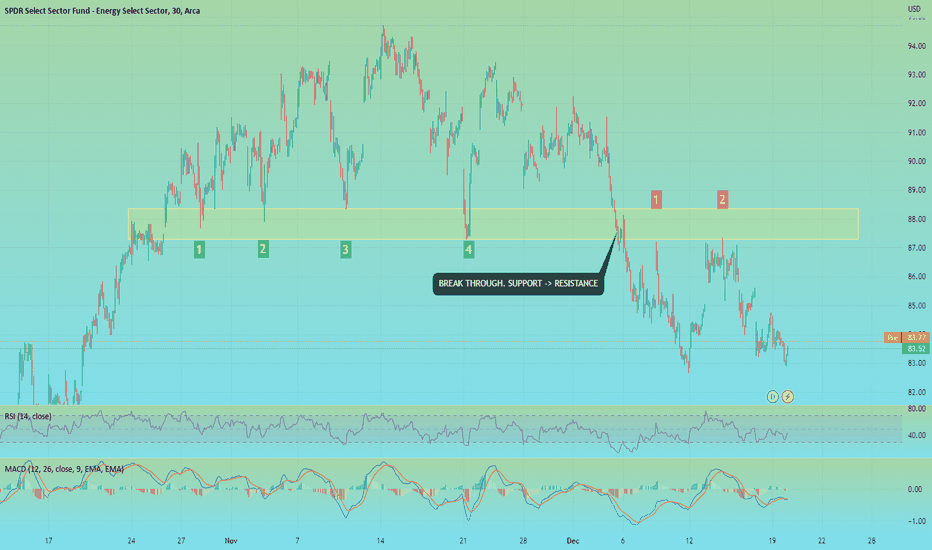
XLE: A ZONE TO WATCH IN THE ENERGY SECTORSince October of 2022 we have seen an interesting zone form in the SPDR Energy Sector ETF. This zone is marked by the yellow rectangle in the chart. We noted four support bounces in this zone, a breakthrough of the zone, and two rejection bounces. This support/resistance zone is one to watch over the coming weeks. A rally into the yellow zone is one to watch closely for a potential rejection.
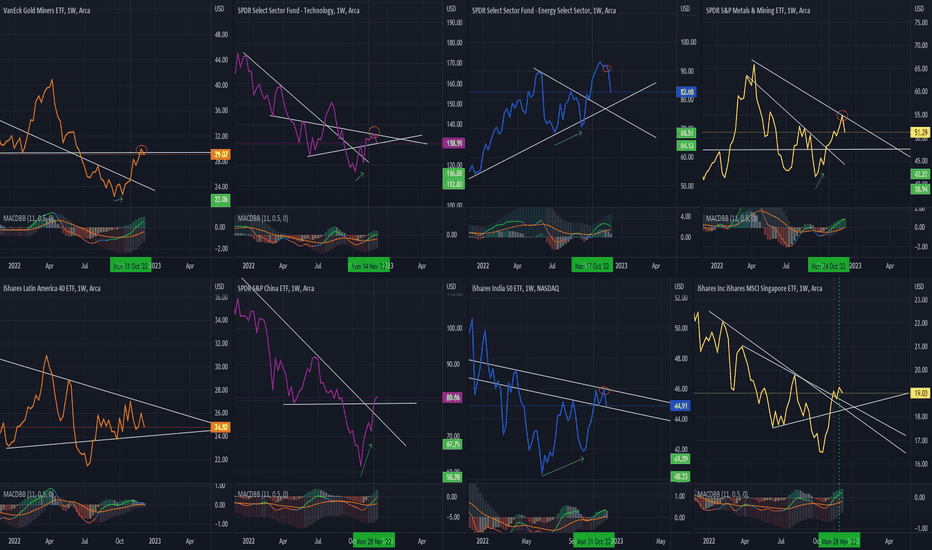
Portfolio Selected Visuals (PSV) vol IThis is a list of my personal portfolio selected ETFs with the simplest visuals, using MACD as the only technical indicator and the trend lines with breaks or breakdowns to give us a new series of PSV charts. ;-)
Note that these are using Weekly charts, and a break out is qualified when there is a trendline break out accompanied by a MACD crossover (within a week or two).
From left to right...
GDX (Gold Miners ETF) qualified a break out on 31 Oct, after a higher low, but sees to have met resistance (red ellipse)
ILF (LatAm ETF) is still within a trapped range.
XLK (Technology ETF) qualified a break out on 14 Nov, after a higher low, but seems to have met resistance (red ellipse) soon after.
GXC (China ETF) qualified a break out on 28 Nov, after a higher low. Appears to have another break out above a resistance line.
XLE (Energy ETF) qualified a break out on 17 Oct, after a higher low, but seems to have broke down of support/resistance (red ellipse).
INDY (India ETF) qualified a break out on 31 Oct, after a higher low, but seems to have met resistance (red ellipse).
XME (Metal Mining ETF) qualified a break out on 24 Oct, after a higher low, but seems to have met resistance (red ellipse).
EWS (Singapore ETF) qualified a break out on 14 Nov, without a higher low, and further qualified a better stronger break out pattern on 28 Nov.
From this set of visuals, GXC and EWS are the front runners. GDX appears a close third.
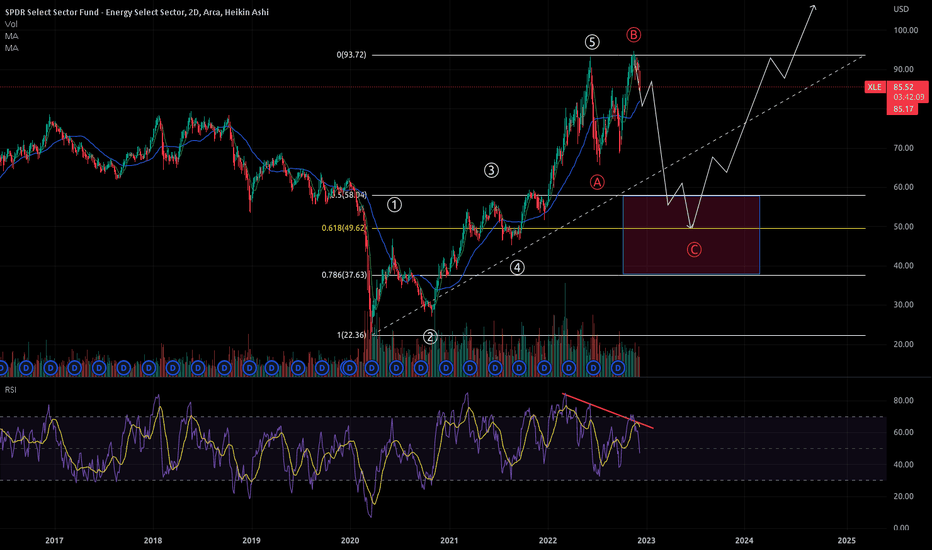
Energy stocks have topped... For NowFollowing the recent oil selloff the XLE sector is now pulling back. With a clear divergence in the RSI with the 3 recent price tops, it seems like the XLE has completed 5 waves up. Following that is a 3 wave correction as a flat and is now preparing to finish the last leg of it, before exploding higher sometime next year.
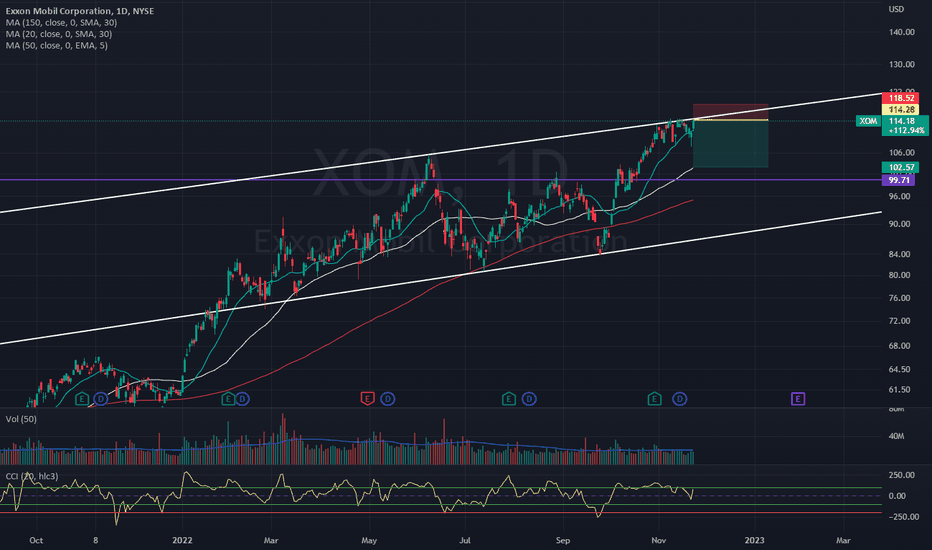
Xom ShortNYSE:XOM
Xom is at 52W high, while oil is 30% lower, for me it's weird how the main reason for the acceleration of the XLE made the correction but XLE didn't.
Waiting for XLE to go down with XOM
Look at the tunnel and the Candles that cannot break, Volume decrease. I'm in
Entry 114
TP1: Fib level 1 - 107
TP2: Fib Level 2 - 103
SL:121
Have fun
VLO opportunity on dip buyDon't know why this sold off today, there is insider selling, but this is a solid energy play. Good dividend, excellent growth metrics. Solid 50 day, 200 day, and 52 week EMAs. I own since 34% ago, will add more should it dip to 61.8% fib around $125. Energy momo is here to stay for a while.
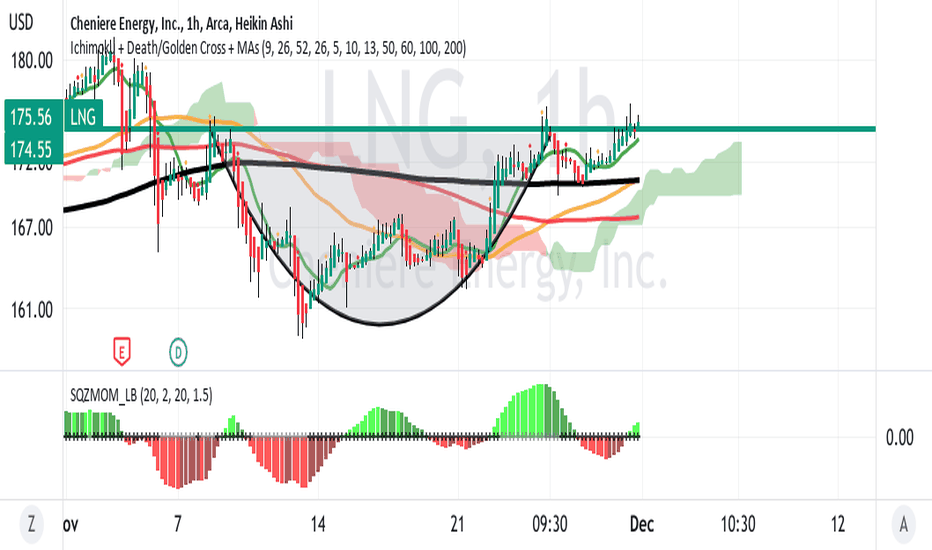
LNG ( Natural Gas ) Breakout from Cup and Handle LONGThis is a classical chart pattern. The bullish continuation would be
expected to be about $25.00 of upside given the height of the cup.
The short time MAs have crossed the intermediate MA from underneath
in a "Golden Cross" while positive momentum just started on the
squeeze indicator. Fundamentally this makes sense with the
winter heating season and the energy sector the best performing
this year. I will choose a Feb 23 call option 15% above current
price.
ina
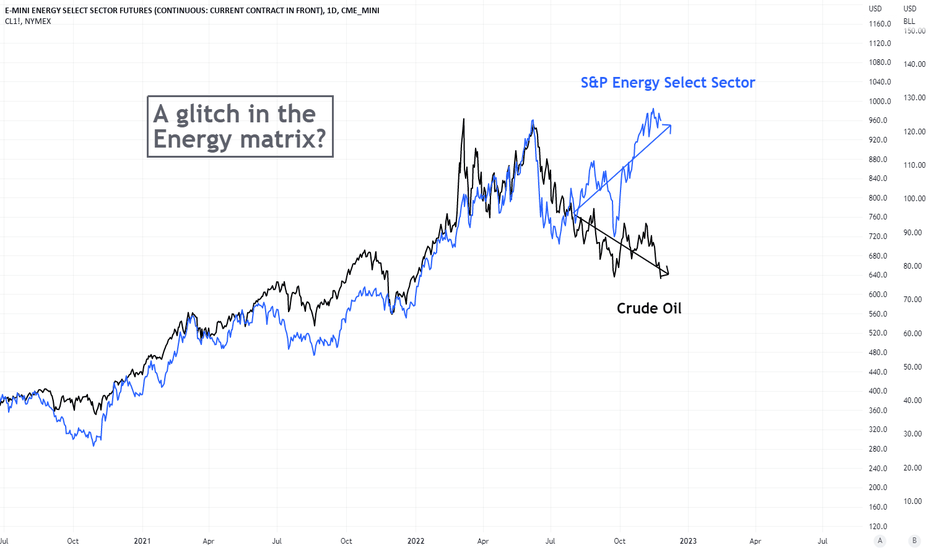
A glitch in the energy matrix?Something weird is bubbling in the energy space.
Before we delve in, let us briefly explain what the S&P Energy Select Sector Index represents. Some of you might already be familiar with XLE, the ETF which tracks the S&P Energy Select Sector Index (IXE). This Index seeks to represent the Energy sector by aggregating a basket of names in the sector.
A breakdown of the top 10 Index components shows the Oil & Gas majors taking up roughly 75.41% of the Index, and 91% of the total Index component being Oil & Gas exposure, while the other 9% being energy-related equipment and services.
CME E-mini S&P Select Sector Futures, XAE, tracks the aforementioned energy index, with the added benefit of margin offset and deep liquidity.
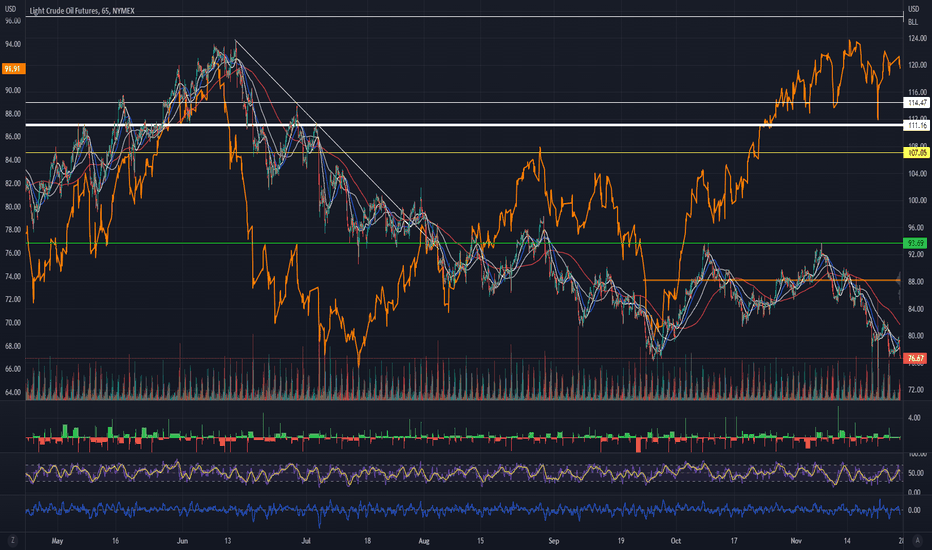
Now given that the S&P Energy Select Sector Index is made up of mostly big Oil & Gas names, we would expect some correlation between the prices of oil and the Index itself.
A look at both from the depths of the low in March 2020 till now shows both products moving closely together up until recently, where zooming in we see…
the glitch in the matrix.... The 2 have been trading generally in lockstep since the bottom in 2020, but have diverged in a peculiar fashion, since the middle of July, with the energy sector gaining roughly 28% since, while Oil tumbles close to 30%!
Has the exuberance in energy stocks been overdone?
In our opinion yes and we see a couple of headwinds for the Energy Sector in general:
1) The impressive rally from the depths of COVID has been driven by rising oil prices and share buybacks. Oil prices are now faltering, and tightening Financial conditions/Recession could slow or stop buybacks.
2) Political pressure to apply a ‘windfall tax’ on oil and gas companies could eat into energy companies’ earnings.
3) Stabilized tension from the Russian-Ukraine means lower uncertainty and pressure on oil prices, as supply and demand find equilibrium from alternative sources.
4) China’s continued zero COVID policy means low demand from the world’s largest importer.
From a price action perspective, XAE is trading just slightly off the all-time high range, which could prove to be an area of resistance.
All things considered, we think this presents an opportunity to trade this divergence either by;
1) Shorting the XAE outright, which means to take a directional view on the Energy Index. A riskier trade.
2) Pair the XAE with the Crude Oil contract, by shorting the XAE and taking a long on the Crude Oil contract. A more risk-controlled approach.
Crude Oil Trades at a contract unit of 1000 barrels and the E-mini Energy Select Sector trades $100 x S&P Energy Select Sector Index. Each Index point is 100$ on the CME E-Mini Energy Select Sector Futures contract (XAE) and $1000 on the Crude Oil Futures. One way to construct this spread could be to calculate the contract value difference between the 2 products;
Spread = 100 x XAE1! – 1000 x CL1!
You can construct the chart on TradingView by typing the above into the product search bar.
This will show the Chart of the spread between the 2 products, which is close to the all-time high now.
As such we will lean on the short side of this spread, given the outperformance of the Energy Index relative to Crude Oil. We will also keep an eye on the upcoming OPEC meeting on December 4th to gauge the path forward for Oil Prices.
The charts above were generated using CME’s Real-Time data available on TradingView. Inspirante Trading Solutions is subscribed to both TradingView Premium and CME Real-time Market Data which allows us to identify trading set-ups in real-time and express our market opinions. If you have futures in your trading portfolio, you can check out on CME Group data plans available that suit your trading needs tradingview.sweetlogin.com
Disclaimer:
The contents in this Idea are intended for information purpose only and do not constitute investment recommendation or advice. Nor are they used to promote any specific products or services. They serve as an integral part of a case study to demonstrate fundamental concepts in risk management under given market scenarios. A full version of the disclaimer is available in our profile description.
Sources:
www.cmegroup.com
www.cmegroup.com
www.cmegroup.com
www.ssga.com
oilprice.com
XLE Energy sector FAANG of 2022Energy sector perform well in 2022 almost 46.6% till to date. Russian invasion boost it well and Energy and Oil stocks big profits, but these stocks and sector can not trend for long connected with supply and demand. Winter running in Europe and it's almost on peak or little more gap to upside.
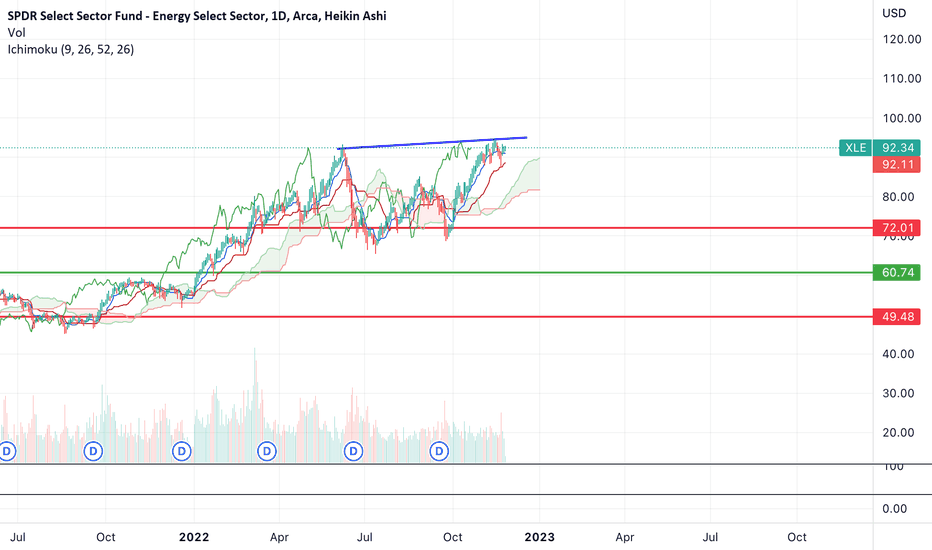
$XLE looks like a short- back to $60?I know everyone wants to be bullish energy, and I agree with the thesis over the long term, but the shorter term looks ugly.
XLE looks like it's topped out here and wants to fall back to the $70 range, or below back to $60 (as this region has never been tested as support on the way up).
I'd be a seller here and not a buyer. I do think a drop to $60 or so is a good long term buy.
