XLE Recap Put SwingHello Acan here!
Here is the recap on the Put Swing for Energy sector.
Patience is key on swings that's for sure.
Should have added more contracts on the rejection of trend but I didn't, end of the day a win is a win.
Bought contract at .51 and sold at 1.53 a 310% gain.
XLE

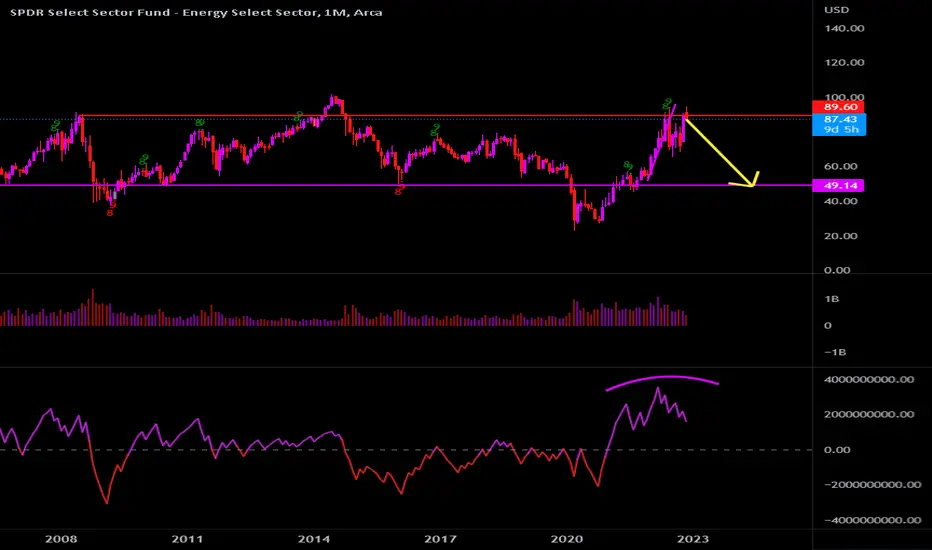
XLE & Energy should be topping here Medium to LongtermEnergy should be topping here looking it at as a whole, OXY also at a great longterm short. Looks like a giant right shoulder on XLE from 2007, I think energy stocks should rotate into growth for the next bullish sector.
update on SPX Oil XLE Bonds BTCAll in the video. SPX is hanging around it's 4hr neckline, no decision to sell just yet, Oil may be a nice short, 70 is the target I'm watching. XLE I think is also an excellent short opportunity but confirmation is under 90. Bonds look good and maybe had a very important long term low. BTC could sell some more a few targets are 145 12k and 10k
Good luck

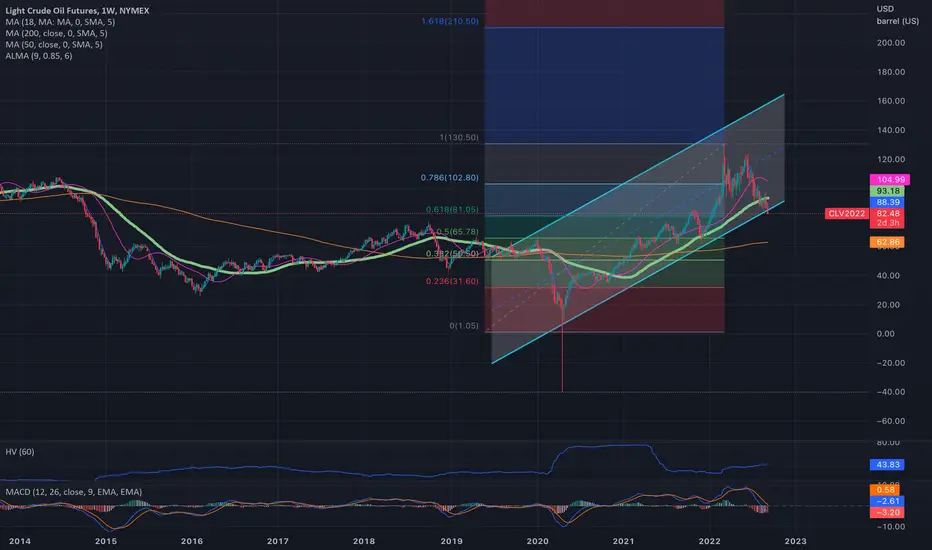
The reasons why going long oil is the best trade you can take!In my opinion, the global energy crisis isn't over; hence there are many reasons why being bullish on oil makes sense, and in this idea, I will try to analyze most of them one by one.
First of all situation between Russia-Ukraine doesn't look any good, and it also heavily affects Europe, which is essentially directly involved in this war. Currently, gas from Russia to Europe is lost and can't be replaced because Russia has cut flows while someone sabotaged the gas pipelines. At the same time, Europe is about to ban Russian oil from being sold to Europe while also trying to apply price caps on oil and natural gas. All these essentially increase the oil demand (to replace natural gas) while also decreasing production in case Russia cannot sell that oil to somebody else. As if these aren't enough, as many foreign oil companies managing the production have left Russia, its oil production could drop even more as they don't have the knowledge and ability to control the oil fields themselves.
The oil prices remain under control simply because the US keeps releasing oil from its SPR while China keeps pursuing its zero Covid policies. The US eventually will have to stop releasing oil from its SPR because the SPR was created for an emergency, not to keep prices low to buy votes. Not only will the US have to stop emptying its SPR, but it will also have to refill it. Also, China will eventually realize its futile attempt to contain omicron and stop its lockdowns. Essentially just the combination of the two would be an incredibly bullish development for the price of oil, as a lot of supply would come off the market. At the same time, demand will increase massively as Chinese citizens want to travel and consume more.
Unfortunately, the US and the world are pursuing catastrophic policies regarding the energy sector instead of pushing investments into it. The windfall taxes on the energy companies will discourage investors from putting money in while starving companies of cash they could have used to invest in more energy production. At the same time, many rules against the extraction of fossil fuels and nuclear energy production are making things even worse. As if these haven't been enough, the US is also talking about an export ban, which, if implemented, would have catastrophic consequences for the world and the US. It would create a massive imbalance in the oil market, which would already have severe issues due to the European embargo on Russian oil.
Recently OPEC+ announced oil production cuts, and the tensions between the US and Saudi Arabia have increased significantly. While the US refuses to increase its oil output, OPEC+ cut production by 2 million barrels daily. However, here is the thing... OPEC+ agreed to reduce output that it was not achieving. The truth is that OPEC+ has reached its production limits, and most countries are failing to meet their quotas. There is no spare capacity, and it is tough for them to increase their output. Essentially the cut so far was mostly an admission that they can't produce more.
Saudi Arabia and OPEC+ want to keep the price of oil around 80$ and are ready to cut production to counteract the Fed's actions to reduce demand by hiking interest rates. There is an ongoing war been energy producers and Central banks, and the more central banks hike interest rates, the more energy producers will have to cut. Of course, with all the rate hikes and the global economy in a silent depression, we are slowly moving into a brutal recession in the next 6-12 months, which could knock oil prices much lower for a while. However, as central banks are already being forced to pivot, dumping reserves and resuming QE, we could see them and governments trying to stimulate an energy shortage, which could increase oil prices. Finally, the US has talked about refilling its SPR when prices are below 60-80$, while the Saudis talked about cutting production if the prices are below 80$. This means that the price area between 50$ and 80$ is worth going long, as the US and OPEC+ are creating a price floor by reducing supply and increasing demand.
So what's the trade? Accumulate oil in the 50-90 area. No stops. Target 250-300$. Time horizon - 2 years.

Constellation Energy $CEG leading the energy transition?Constellation Energy provides power, natural gas, renewable energy, and energy management products and services. They are the largest producer of carbon-free and low-emissions energy in the US.
NASDAQ:CEG is in a clear uptrend with great relative strength against its benchmarks. Just look at AMEX:XLE and NASDAQ:QCLN .
NASDAQ:CEG is clearly leading.
I see an actionable first buy at yesterday's high as that would cancel the outside reversal. It would be very bullish.
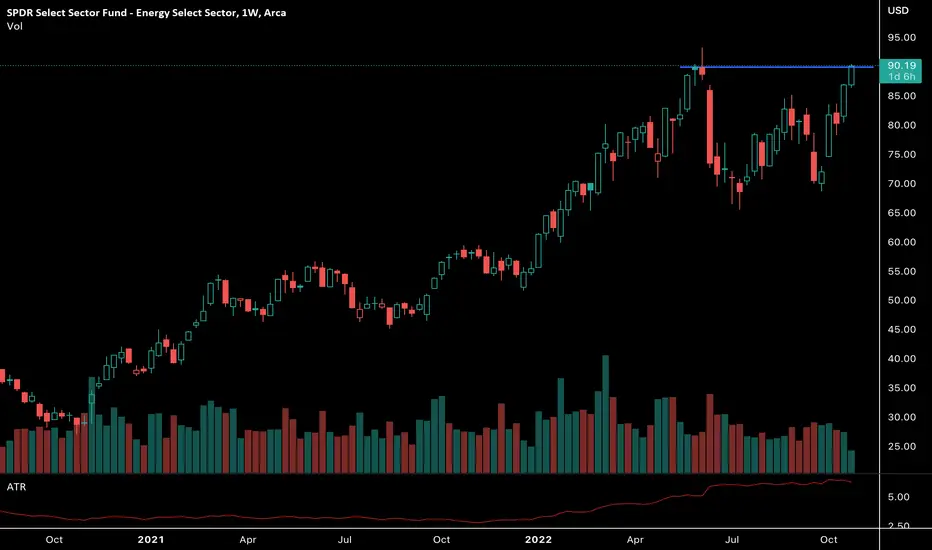
A second buy point is at $90.20, which would be an ATH.
Lets see if the MAs can hold the price.

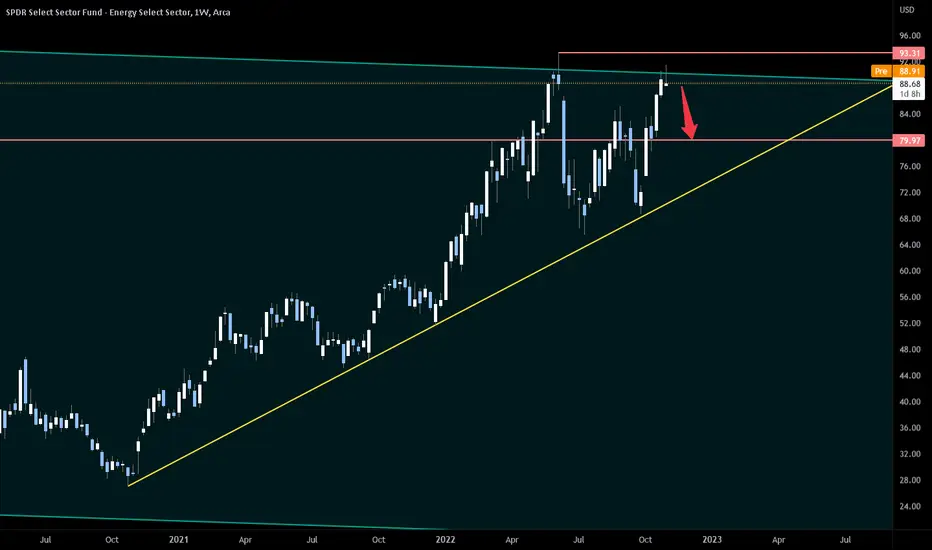
XLE to break bullish triangle + OPEC cutOPEC threatens to cut oil prices ten times more than in September in an attempt to plug the oil drain.
- The New York Times' sources estimate that the agency is considering announcing a cut of between 500,000 and 1 million barrels per day, about 1% of global supply, because the market is oversupplied and demand is softening due to the weakening global economy.
This plus the bullish triangle a good take profit could be around 90-93 usd.
10% pullback likely for Energy Sector stocks from current levelsBased on Monthly parallel channel, we have major resistance around 90$ with double top likely at 93$. Easy pullback likely to 80$ from current extended levels.
SL : Confirmation above the monthly channel
Target : 80$
🟩 $XLE: +9.14% WIN, Second Half OffTaking the second half of XLE here.
Second half has win of +9.14%
First half had win of +6.65%
Blended win rate: 7.95%
Initial Stop Loss was 4.36% hence this is 1.82R win

10/30/22 SLBSchlumberger N.V. ( NYSE:SLB )
Sector: Industrial Services (Oilfield Services/Equipment)
Market Capitalization: 71.538B
Current Price: $50.45
Breakout price trigger: $52.50
Buy Zone (Top/Bottom Range): $51.00-$47.40
Price Target: $61.20-$62.40
Estimated Duration to Target: 56-60d
Contract of Interest: $SLB 12/16/22 55c
Trade price as of publish date: $1.63/contract

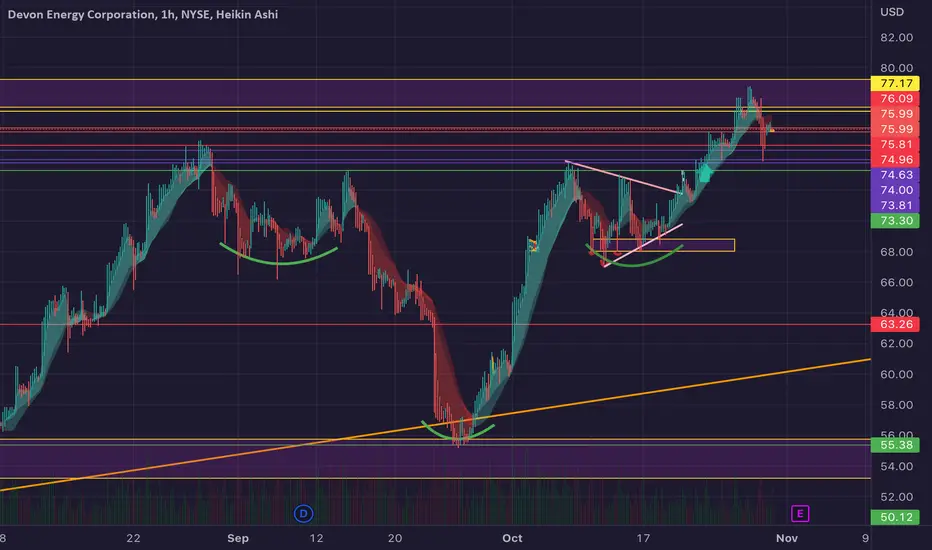
$DVN Earnings$DVN has earnings Tuesday. I am eyeing a pullback in oil names headed into the week, but a beat could send this to new ATH
Energy sector, bullish?AMEX:XLE is showing signs of strength on the weekly time frame. Most oil & gas companies have had a great run YTD, and the energy is sector is among the few green sectors YTD.
$XLE: +6.65% WIN, Taking Half Off This might continue to run, but I want to take profits into strength +6.65%
I am only taking half of the position. For the rest of position stop loss is at break-even.
This way I am GUARANTEED profit for at least +3.33% on the whole position.
With this technique I have massively improved my worst case scenario.
Probability is high for a pullback.

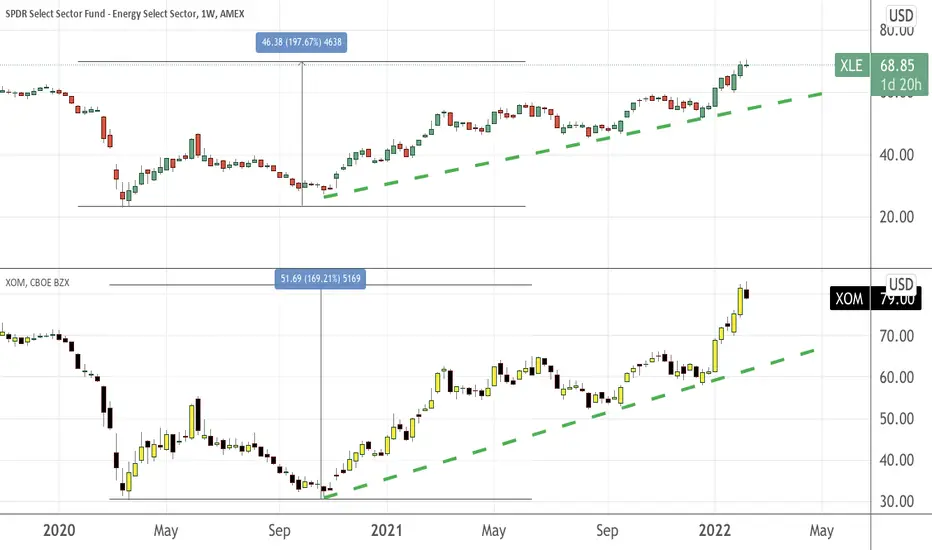
Comparing XLE performance and XOMFirst thing first, let's take a look at the components of XLE here
You can see that Exxon Mobil and Chevron takes up almost half of this ETF portfolio. Unless you are familiar with the FA components of individual stocks, investing in an ETF like XLE can be a cost effective and hassle free approach.
Performance wise, you can see that from March 20 to current date, XLE has gone up almost 200% vis-a-vis 170% for Exxon Mobil. Also, buying into individual stocks can be costly as well along with the risks contained in a single company. For detailed explanation, read here
$XLE - moving Stop-loss to break evenThis is @ +4.34% winner. I will move stop loss to break-even to improve worst case scenario.

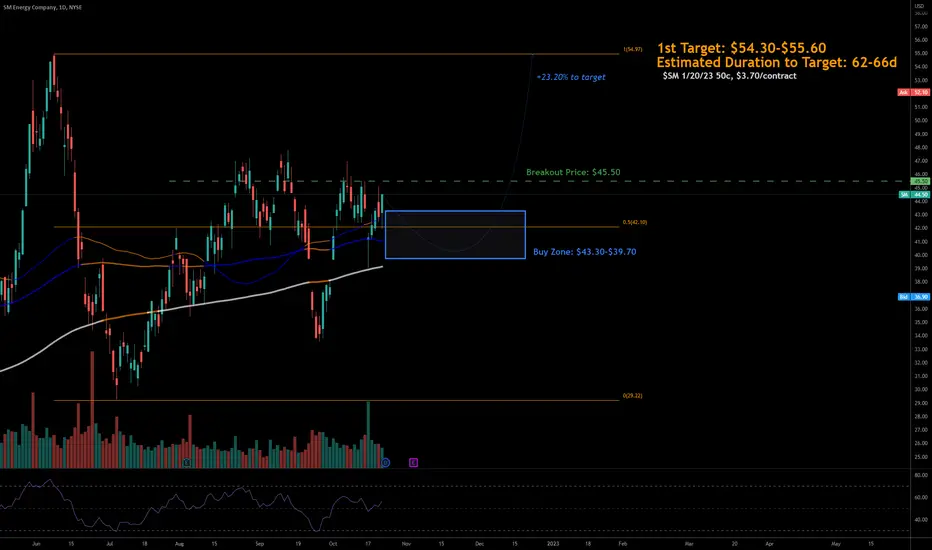
10/23/22 SMSM Energy Company ( NYSE:SM )
Sector: Energy Minerals (Oil & Gas Production)
Market Capitalization: 5.455B
Current Price: $44.50
Breakout price trigger: $45.50
Buy Zone (Top/Bottom Range): $43.30-$39.70
Price Target: $54.30-$55.60
Estimated Duration to Target: 62-66d
Contract of Interest: $SM 1/20/23 50cTrade price as of publish date: $3.70/contract
XLE BO:bottom@66,Support@76, next stops are 90/98/107BULLISH CASE: XLE held a June low @66 which is a 0.618 retracement. It formed a triangle & has since bounced off the base very strongly with 2 gap-ups. Moving averages 50, 100 & 200 are forming a ribbon & are all pointing up. 76 is a strong support with volume profile.
If this breakout from the triangle sees a follow-thru in the next few days, XLE may double the triangle & target the next 2 Fib levels at 98 & 107 with some consolidation at the recent ATH at 90.
Crude oil & Natural gas bouncing strongly.
10-yr rate TNX & dollar index DXY turns up & are also bouncing higher.
BEARISH CASE: If this will be a false breakout, then the 2 recent up-gaps will be filled with XLE going back inside the triangle.
Not trading advice
Buy Oil WTI - IMO should bounce on this L/T +++ Ascending Trend line Line - L/T Technical support from March 2020 lows.
Using a weekly candle chart,
Crude right on an upward trend line testing, using the March 2020 low.
Crude should bounce from here current level having been tough to break over the last 2 years.
Unless we are about to live a historical correction moment on Oil (liquidation/ news flow / Itan) the current price action set up is favouring longs here.
As an aside we are also reaching a 50% retardement Fibonacci ratio level taking High 2022/ March 2020 Low.
NYMEX:CL1!
XLE breaking down from Ascending Channel - global slowdown?XLE just broke down from its ascending channel, which might be signalling that the market is pricing in a global slowdown.
XLE also broke down from an ascending channel in '08 and '14. In the case of 2008, SPX crashed. But in 2014, SPX traded sideways/flat for a while

Long | XLE | Energy Sector is risingAMEX:XLE
Possible Scenario: LONG
Evidence: Price Action, geo political fundamental analysis.
PTs are defined on the chart, this is a very safe bet for 2022 and following year, I will buy Call options for 2022 now and even my buy-zone.
*This is my idea and could be wrong 100%.

Long | XLEAMEX:XLE
Possible Scenario: LONG
Evidence: Unusual option activity, price action
This is my idea and could be wrong 100%
* Consider political conflicts and geo political interests, this ETF is a crystal ball

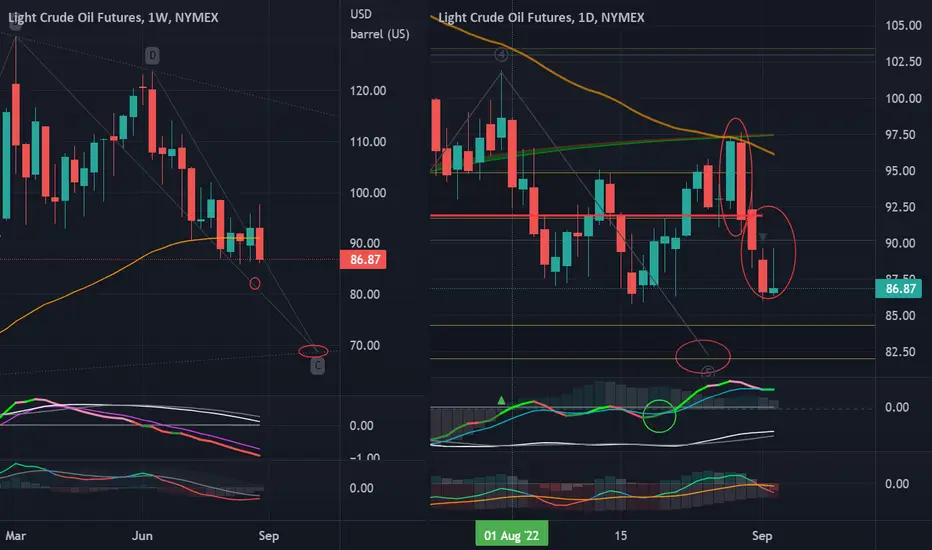
CRUDE to continue downward spiralCrude prices are oddly (well, perhaps not so) set to spiral down further below 80. Here is technically why it would...
Light Crude Oil futures weekly chart show the recent consolidation around the weekly 55EMA, and that it appears to have broken down decisively, particularly closing at the lowest in the last 5 weeks. Technical indicators, particularly the RPM, suggest more momentum as does the weekly candlestick.
The daily chart had a 55EMA failure with a large bearish engulfing candle that overwhelmed a decently large bullish candle the day before. This was followed by a down candle, completing a Three Outside Down candlestick pattern. As if it was not enough, a Gap Down was further followed by a candlestick that closed the week with a long top tail. The daily MACD crossed under the signal line and pushed further down into the bearish territory.
Taken together, all these are simply pointing to more downside, likely to press below 80, targeting 70 towards the end of September.
On another note, the USD appears to be technically bullish and pushing further up. Ceteris paribus , a rising USD usually pushes Crude prices lower.
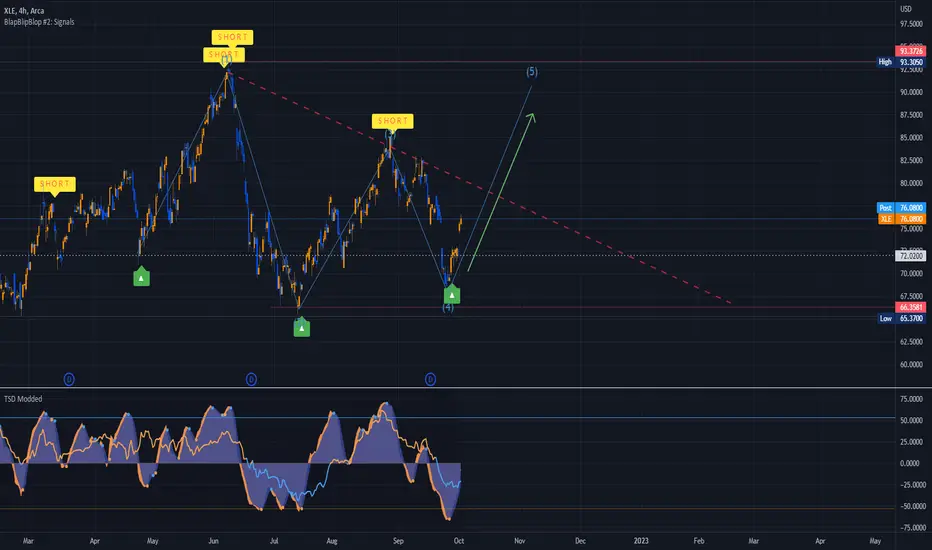
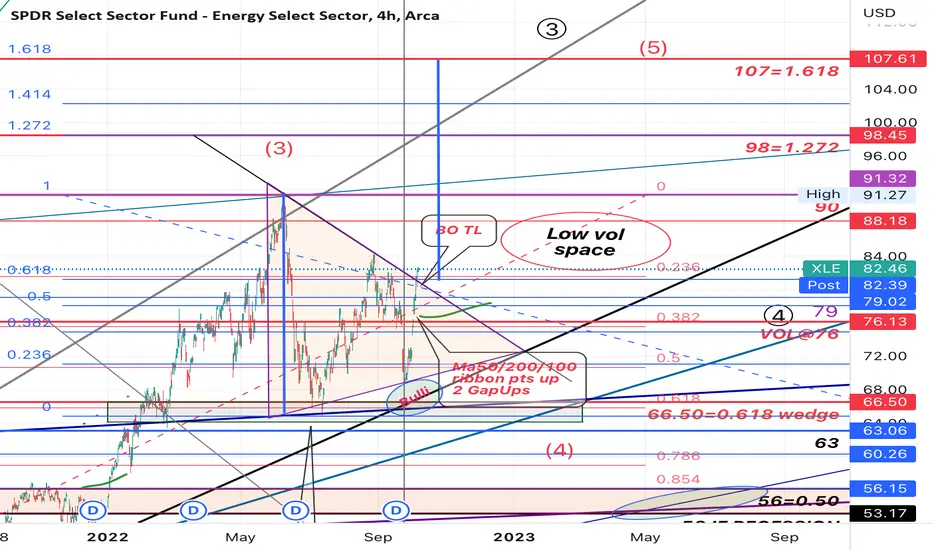
Energy XLE idea (02/09/2022)SPDR Select Sector Fund 1H Range
XLE Energy Sector Index is expected to rise to target the third wave. Since prices are above the long-term support level of 70.59, the key support point at 65.48, we expect a downward correction at the moment. Prices are below 85.23. We expect a correction in wave b and then descend again to complete wave (ii).

$XLE: Weekly and monthly uptrendNice signal in energy names. Macro and fiscal policy are sure making the Fed's life hard. The trend in commodities, energy, value vs growth remains bullish, same as the trend in the Dollar vs the Euro. The recent drop in inflation and oil created a very low risk buy opportunity in commodities in general. I've rotated away from my growth focused portfolio in the prior week, and am long $XLE and other names in my portfolio. I suggest you do the same, very interesting time, where the easy money disappeared from markets and people will likely get schooled time and time again trying to gamble in the same garbage names as between 2020 and 2022.
Stay safe out there!
Best of luck,
Ivan Labrie.
