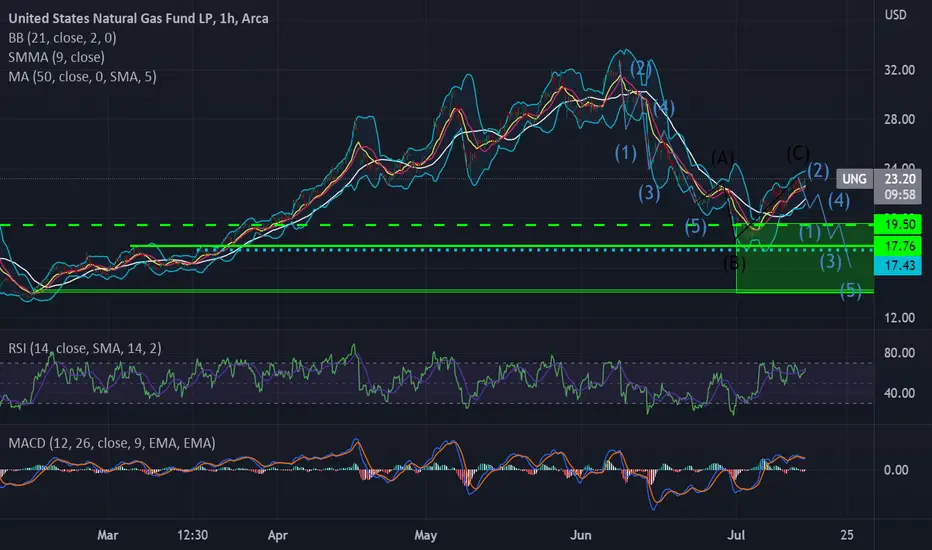
UNG (Natgas) defying the ST trend in the energy marketsNatty has been dancing to the beat of its own drum lately while oil, uranium and xle components have been struggling. Elliott Wave is a tool I often use, but I still consider it esoteric in nature, and often difficult to read, so, reader beware. So, while the bottom may be in for Natty, at recent support just under 18, I suspect a re-test is coming, as well as a possible, even if unlikely, gap fill around 14.
XLE
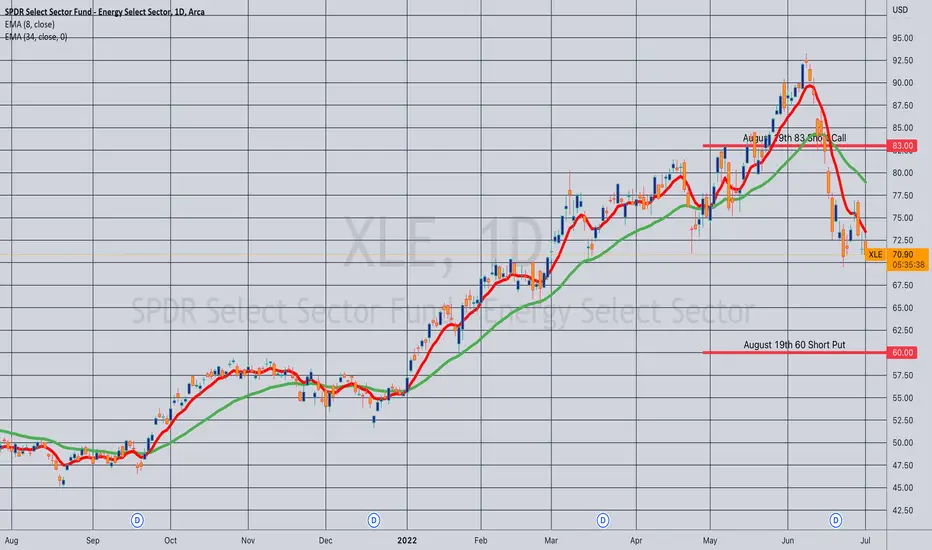
Rolling: XLE August 19th 83 Short Call to 77... for a .43 credit.
Comments: Delta balancing my short strangle to delta/theta <1.0. Total credits collected of 2.49 with a resulting delta/theta of 5.84/6.79.

Opening: XLE August 19th 60/83 Short Strangle... for a 2.06 credit.
Comments: High IVR/IV at 76/49. Selling around the 16 delta on both sides. Delta/theta .4/5.73.
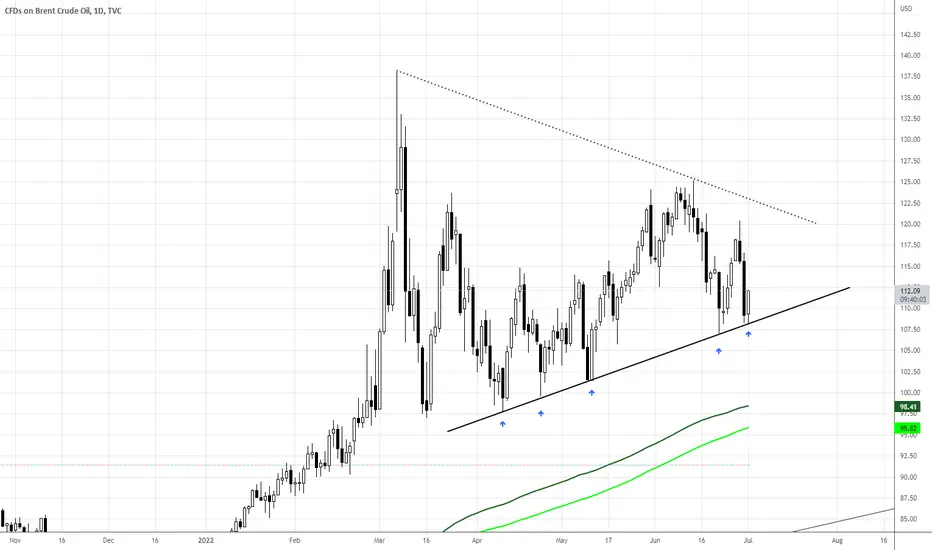
#BRENTCRUDEOIL Still making higher lows within triangleIts no surprise anymore that OIL and energy stocks have been one of the only places to find some alpha this year. Even with oil taking a bit of a beating lately, looking at the technicals we are still in a very healthy shape for the time being with Brent Crude making higher lows within this triangle formation and well above its ascending 200 day moving averages. Until this breaks down, you have to give energy the benefit of the doubt to run higher this year..
Oil and gas producers have come to a dead endLast Friday WTI crude NYMEX:CL1! dropped together with the broader equity markets and closed almost 7% lower at $107.99, slightly below the 50 days moving average. Earlier in the month the oil was still trying to break and stay above $120 however the hype cooled down quickly, partly due to the sharp 75 basis points rate hike by the Fed on Wednesday.
This recent round of oil rally actually started in late Dec-2021 when the oil price tested the 250 days moving average, failed then reversed back to the upside. In late Jan-2022, the global inflation concern pushed the commodity across the major resistance at $86. And by late Feb-2022, fueled by the “special military operation” initiated by Russia against Ukraine, WTI crude went through the $100 handle and never looked back again. With the recent more affirmative backdrop of global recession, as well as the increasing political cost for the current government allowing inflation to worsen, last week's drop might officially mark the end of the 6 months long oil rally.
There are 2 ways you can capitalize the idea. One is to short the commodity directly. Two is to short those who produce the commodity . In the following scenario analysis, we believe the second seems to be a more profitable way, even if oil price continue to rally.
1. Oil Price Up
Although it’s unlikely, there are still factors on both the demand and supply side that might drive up oil price, such as extreme weather and military conflict. Another wild card is OPEC. But in any case, one thing for sure for the US government is that the oil companies are making a lot of money. The US president Joe Biden even directly pointed out “Exxon made more money than God last year” in a recent event in Los Angeles. With Britain recently announcing a 25% windfall tax on oil and gas producers, the white house is even more motivated to join “Robin Hood” to rob the rich (whether to give to the poor is another matter, lol). The windfall tax essentially is setting a profitability ceiling for oil companies. Even if the oil price goes higher, they will not be able to pocket more money.
2. Oil Price Down (Supply Side)
This is likely to be a continuation of the windfall tax narrative. One option the producers can choose instead of paying more tax is to increase capex, i.e. increase oil production by drilling more crude, and expand refinery facilities. In fact, raising capex is the last thing the producers want to do given the global carbon zero commitment and the shift in consumer behavior such as shifting from traditional fossil fuel vehicles to EV. Hence if the oil companies at the end really compromised, their profit and distributable cash would definitely be harmed.
3. Oil Price Down (Demand Side)
In the market economy we trust, even without government intervention, the market itself has an in-built feedback mechanism to neutralize any imbalance. When oil price is too high, demand will naturally be depressed (e.g. drive less, work from home more, take more public transport). Less demand in turn will pull down the price until demand-supply equilibrium is restored. If we look at the latest release of companies Q1 result, the economic slowdown is no longer a slogan but has already materialized. The demand downward spiral has actually taken place in the US, and it is only one trigger away to set this into motion for the oil market as well. For the oil producers, it means selling less oil at lower price, double whammy for their profitability.
Now it should be clearer why no matter how the oil price moves from this point onward, oil companies have all reached a dead end.
Trading Plan
Instead of hand picking which producers to short, one can directly short oil & gas theme ETF, effectively shorting the whole bucket of companies in the sector to avoid tail risk from individual companies. I would recommend AMEX:XLE and AMEX:XOP for this operation, for their larger market cap and better liquidity.
The best time to short was actually 2 weeks ago when oil price was still above $120 and there was a divergence between oil price and the major equity indexes. I placed my first short position in AMEX:XOP on Jun-10 at $161. Last week the drop was faster than I expected. In fact all the nearby resistances were taken down one by one without much consolidations:
20 days moving average: Jun-15
50 days moving average: Jun-16
Lower bound of bollinger bands from 20-days moving average: Jun-17
For those who are looking to raise their short exposure, I would recommend to wait until it rebounds back to one of the above resistance levels, place the short when the buying momentum dries and the selling force becomes dominant again . That translates to price levels around 140-155.
For those who are looking to buy (Note: profit taking only, not buying in anticipation of new highs), the following levels are the major supports of this round of rally:
May support: $123.5
Feb pre-war peak turned support: $115.2
250 days moving average: ~$110
Last note I want to share this week is, never rush into a trade. Any last minute rush means your preparation is inadequate. If you missed a trade it's not because you were not decisive enough to rush in, but because you did not do your homework. So stop overthinking about what you have missed, focus on the next, and make sure you win when you are right.
I wish you all a happy and prosperous trading week ahead!

#XLE - time to buy energy names again?200ema has provided solid support for energy names since November 2020. Will history repeat or is this time different?

XLE Playing For A Wave 5 Upside ExtensionIn this update we review the recent price action in XLE and identify the next high probability trade location and price objectives to target

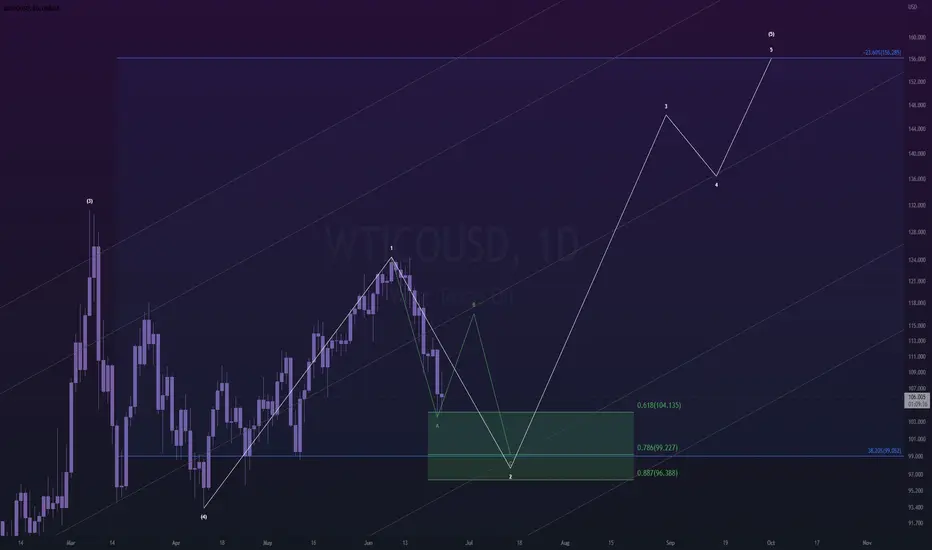
oil 6\23 update~i recently discussed the possibility of oil topping out,
but after diving a little deeper into the charts (specifically the energy sector) -
i've come to the conclusion that it wants to move higher.
---
i'm going to be looking for some chop in the days ahead, which can take oil down to anywhere between $99~$96
followed by a pretty nice move up to $156.
it can go higher theoretically, and i almost would expect it to, but that's my conservative upside target.
$XLE starts to look cheap around $70.50$XLE broke below weekly support, which happens to be 0.768 Fibonacci support level as well.
I'd want to get long at $70.50 as it'll be the 0.618 level of Fibonacci support and also other important technical factors coincide in that zone. Including volume profile value area high at the same level.

$OXY Bearish Sentiment - In Line with Energy Sector Rather than look at XLE or the energy sector as a whole - looking at an integrated Oil and Gas company with more volatility gives us a better picture of the environment. There are obviously severe worries of a recession - hence the breaking of correlation between OXY and OIL futures the past couple days. With oil futures falling as well, the backdrop sets a fairly bearish tone for the short term. Looking at the levels, OXY could fall into the mid 40s prior to consolidation and then possible bullish setup.
Bullish case: Russia and/or OPEC production shortages supply constraining...US Demand stays strong...GDP growth stays positive for Q2
Bearish case: Oil continues to fall due to expected demand falling... Russia/OPEC issues subside/aren't as bad as expected...Fiscal policies before midterms

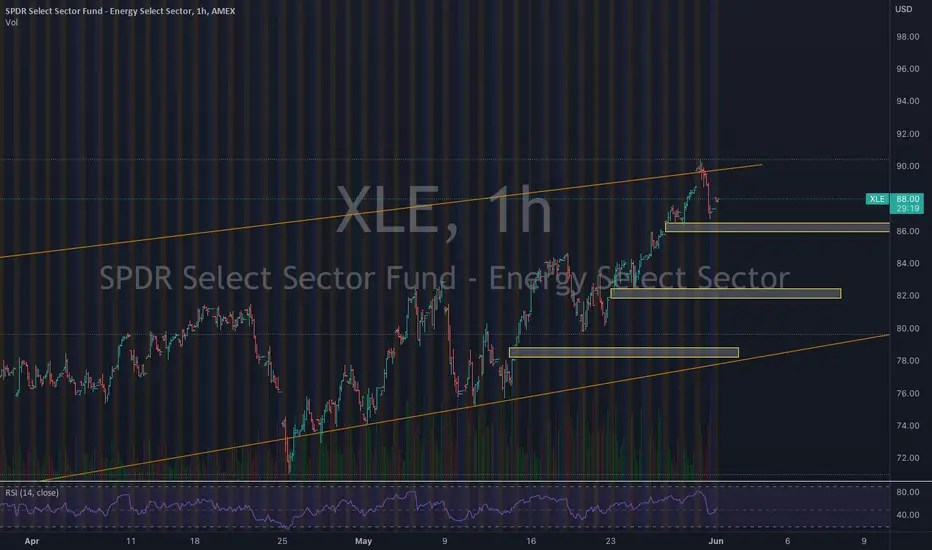
XLE breaks TL but holds vol profile zone(75-77); is 71 or 65 nxtUpdate on my last post that XLE energy sector must hold the red trendline at 79.
BEARISH CASE shortterm: On Thursday it broke not only the TL but also broke below my yellow consolidation box.(middle one). As of now it is holding the volume profile zone at 75 to 77 area. Looking at the heavy selling volume in all sectors, a double bottom at 71 is very probable. 76.70 is the 0.618 Fib level while 71 is the 0.786 Fib.
Worse, we may even see a retest of the blue wedge at the 65 pivot line. That will be a 100% retracement back to the Feb 24 invasion low. (It broke out of the blue wedge & retested it last Jan 2022 & proceeded to make a measured 10 points move to 82 & then another 10 points move to 92)
Still BULLISH longterm:
If XLE bottoms out at the current volume profile zone & reclaims the red trendline in the next few days, we may see a retest of 92 or maybe even push another 10 points higher to 102. You may ask if that is still possible with a slowing economy? Bear markets on average starts 5 months before actual recession (2 consecutive Quarters of negative GDP). We are now at the 5th month but employment & production & consumption numbers still suggest recession is still far out maybe in 2H2023. Either we are in uncharted territory with a prolonged bear market or maybe we will see another melt-up rally first before recession kicks in. This will be possible if inflation & rates slow down with the FED pivoting to less hawkish stance in September after the already priced-in June & July 75 basis point rate hikes.
Note: A slowly rising dollar will not be good for commodities like oil, food, industrial metals & gold but it will help cushion the bad effects of inflation on buying power…good for imports but bad for exports.
Not trading advice. Pls like & follow if this helps!

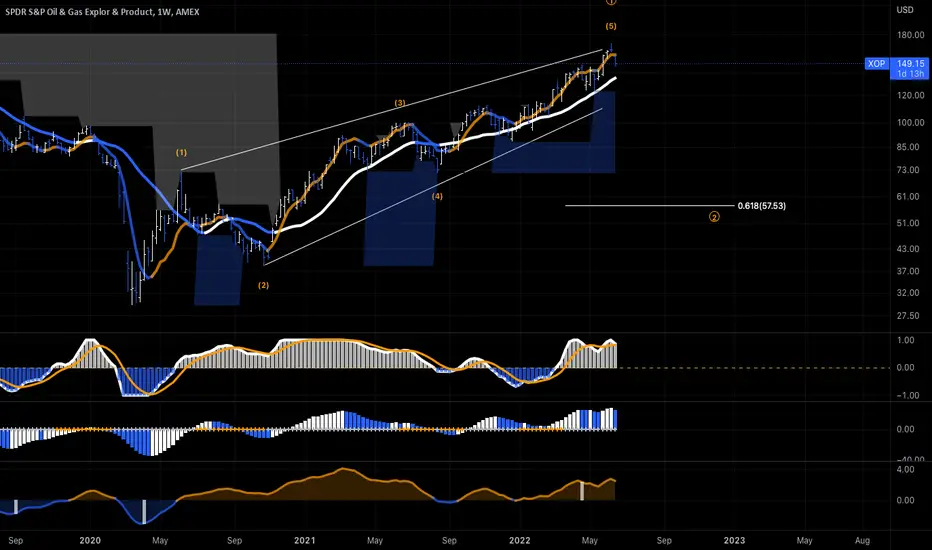
$XOP ~ Same as previous expectation...As shown with XLE, expect rollover to continue. Energy sector cooling off and will present amazing opportunity in the near future. Patience will be key. Will monitor and continue to publish updates as required.
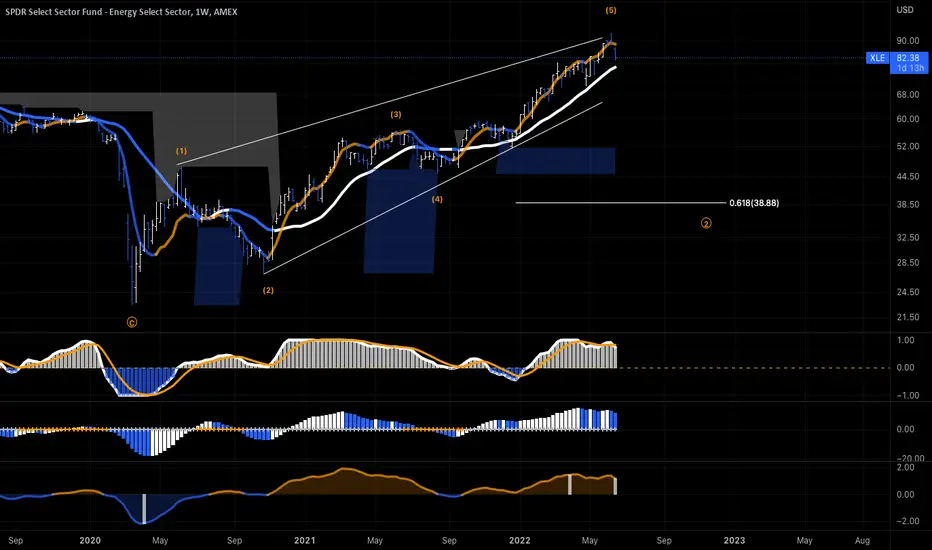
$XLE ~ Appears correction is occurring...As shown, finally it appears energy companies are cooling off. Expectation is XLE continues to rollover and will create a exceptional opportunity within the next 12-24 months. Will track closely and when the opportunity presents itself, we will be ready.
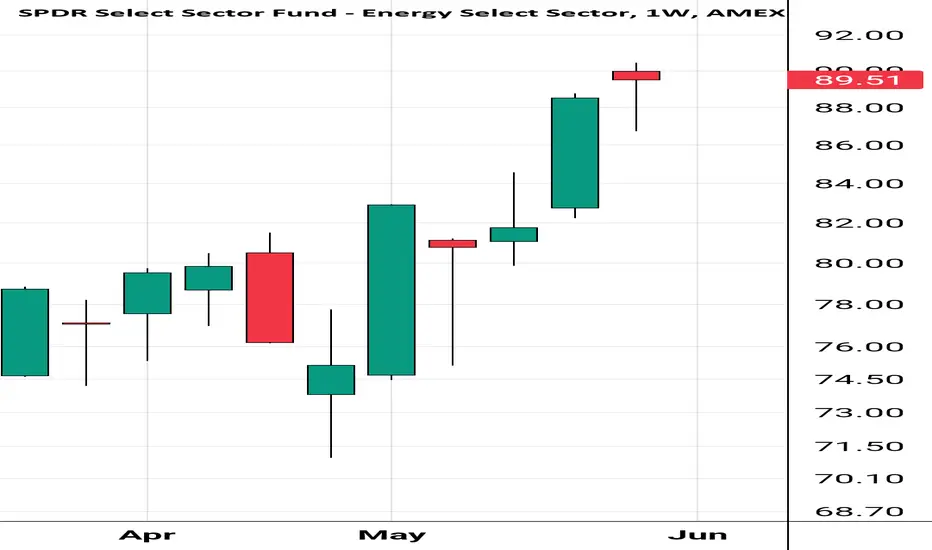
6/12/22 XLESPDR Select Sector Fund - Energy Select Sector ( AMEX:XLE )
Sector: Miscellaneous (Investment Trusts/Mutual Funds)
Market Capitalization: $--
Current Price: $88.71
Breakout price: $90.50
Buy Zone (Top/Bottom Range): $84.30-$74.05
Price Target: $112.00-$114.20
Estimated Duration to Target: 133-140d
Contract of Interest: $XLE 9/16/22 90c
Trade price as of publish date: $5.90/contract

XLE may retrace to 82 @ TL; more pain to come if 79 breaksUpdate on my previous warning that XLE is soon to retrace.
BULLISH CASE: XLE reached ATH 93.31, my FIb 2.0 target & retraced. It should bounce at the red Dec2021 trendline @ 82…FIb 1.0 which is a previous April top.
BEARISH CASE: XLE had a very impressive run up since its pandemic low & a correction is overdue at this ideal time when extreme high oil price may dampen demand & OPEC & US to increase production. This correction will be temporary since China has re-opened from lockdown & demand will slowly increase going forward pointing a higher wave 3 or a wave 5 after a potential wave 4 correction whichever case may play out. But if 79 (FIB 0.50 retracement from 65 to ATH) is lost, more pain will come to the broader market SPX. This may also mean that wave 3 has peaked & an ABC wave 4 down may be underway.
Not trading advice

XLE Trading The Bullish SequenceIn this update we review the recent price action in XLE and identify the next high probability trading pattern and price objectives

even my dead grandmother is long XLEShe needs to get ready for a rude awakening on energy prices, we're close to a top or already there today. Logical target is about 75.

XLE short idea
Cracks are starting to show
Been overbought for a while
See the chart for stop and PT

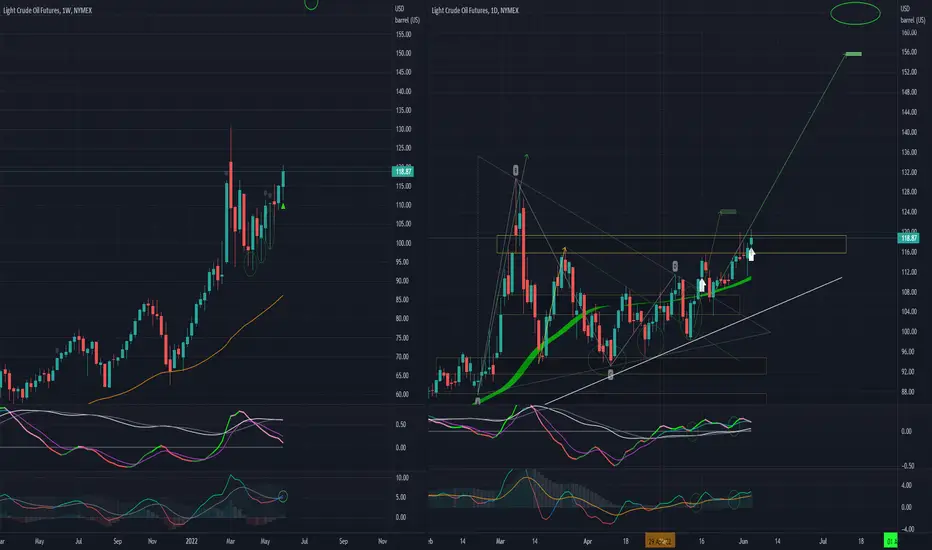
Crude on track to rocket up...It has been weeks (maybe months) since Crude had yet to commit to an up move (clearly) although it gave early indication of the imminent move.
This past week was volatile and eventually closed the week relatively bullish. The weekly MACD crossed up and appears set to continue the momentum, slowly but surely.
The daily chart shows an invasion into a gap area, forming a resistance. The week closed near the top of the range, but has not yet decisively cleared the resistance. Technicals are supportive of a breakout.
Upside targets are maintained, but time adjusted for another 3-6 weeks buffer.

$XLE Incoming Buying Opportunity Posting from a mobile device. I apologize if the chart image isn't perfect.
This is $XLE Energy SPDR ETF. Weekly Candle is forming an Evening Star. High probability of a powerful sell off coming. Long term energy charts are all very bullish. Take profits and/or look for buying opportunities for new longs.
Peak Oil? Downwards reversal loadingXLE is showing early signs of a significant reversal following a 27.5% gain since April 25th this year.
1. Bearish rising wedge pattern forming on the Daily timeframe
2. Descending volume across pattern vs rising price
3. Five unfilled gaps to the downside
Short from $87
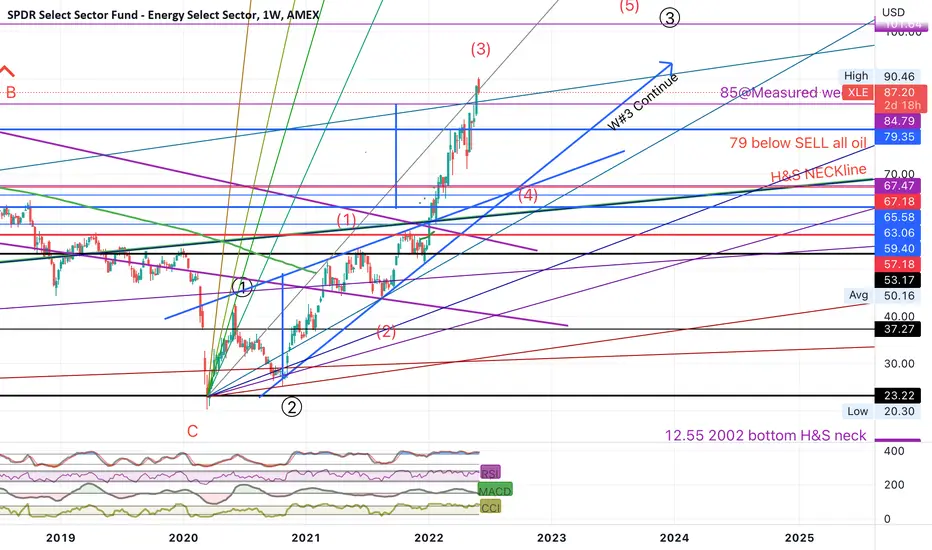
XLE a W3 BO of 2GANN FAN lines+wedge move or a bulltrap to W4?XLE formed a big H&S pattern in 2002 & has since bottomed during pandemic. From there, it started a blue rising wedge which had a more chance of breaking down. However, due to the Russian invasion, it broke to the upside above the H&S green neckline.. Measuring the height of this wedge gives a target of 82.40 which XLE had reached & recently exceeded. It also exceeded 2 GANN FAN lines from 2002 & 2020 lows but registered a big red candle the next day.
I think XLE is currently at an impulse wave 3 of 3. XLE must hold 79 for wave 3 to continue higher. Losing 79 may signal a corrective wave 4 of 3 back down to retest the wedge at near the 68 level before a wave 5 0f 3 starts. It may even retest the green H&S neckline started in 2002 approximately near the 66 level.
Supports at 79, 68 & 66.
Resistances at 88 (1.618 Fib) & 92.24(2.0 Fib of recent wave b in a zigzag move)
There is better chance of XLE holding 79 with wave 4 & do the last wave 5 of 3 as the world energy crisis is not abading in the near future. XLE is the ultimate winning sector for months.
Not trading advice