SOX Update (weekly chart)SOX, as well as the broader XLK, has diverged somewhat from SPY, and remains stubbornly above the 52 week EMA. The red D point is a longer term Gartley target based on a 61.8% retrace from point C.
However, it is still in an Ichimoku resistance area, and has potential to reverse.
Key support areas are;
1) 2854 -2794 DOJI, and potential pivot area
2) 2848-2742 Blue Point B, a prior swing high and potential pivot area
3) 2838 Gann Confluence Point and potential support
Should pivot areas 1) and 2) above fail, the final point to watch is the Gann Confluence around 2838. A fail below this point would be bearish. Also, an extended stay below the 52 week EMA would be bearish.
Presently the chart sits above the longer term downtrend set from 1/22 high to 10//22 low and has a ways to go before that channel should continue.
XLK

NASDAQ Bounce - how high??Someone gave me a heads up earlier this week that ChatGPT returned an answer to say that the market will tank on 15 March 2023. While I see it a little more different, I still keep an open mind as a lot can happen in a week (as we know in recent years).
So first up, ChatGPT is an amazing quantum leap and it is one of those triggers that form a tangent in our development time line. To me, broadly this is like when Google met Siri/Alexa. That said, perhaps the 15 March is a collation of expectations.
Nonetheless, looking into the technical picture for the NASDAQ futures, NQ1!, gives a technical collation of the happenings in the past weeks. Previously, a retracement target was marked out on the weekly chart (faded yellow ellipse). Since then, the NASDAQ made a lower high, and pulled back to the 50% Fibonaccie retracement level and support level about 11,800. And Friday clearly broke out of trend.
So, now how?
First, we look at the green and red dotted lines. These are the TDST levels that need to be broken to have a trend in force. According to the current TD Sequential, the NASDAQ is still in a bullish trend, and just finished a Buy Setup on Thursday, hence a clockwork bounce thereafter expected (and happened).
Next, looking at the range support resistances, we see the green and red rectangles. Breaking out or down with a decisive close and technical alignment (MACD and VolDiv) confirms the trend.
Taking into account the MACD and VolDiv, both are retracing, but are not yet bearish. So taken together, we can expect a bounce, which probably just started. Watching the strength of the bounce is critical, and the first check in point is about 12,500. A trend line connecting the last two highs also point to an approximate area at 12,500 (yellow ellipse). Noted, the MACD is weakening, and so is the shorter term VolDiv. So not yet crazy bullish.
Overall, expecting a lower high (at this point). And going back to the "15 March", although long range analysis not shown here, it appears that May to Oct is a deeper down time. Will update on this in time...

NASDAQ pulling back - for nowAs per heads up given earlier, the NASDAQ stalled and is pulling back. The weekly candle is similar to a bearish harami, but should wait to see if this week continues the down draft. Am expecting a bounce around the 23-week EMA. But if it slices through, then it would be a ominous turn of events.
Technical indicators are somewhat bullish, hence expecting the bounce.

Week 6 - 2023 - Weekly S&P500 Sector AnalysisDiscussing all the major weekly trends for each sector.

Week 5 Sector Analysis: S&P 500Discussing all the leading sectors
0:15 XLK
1:40 XLV
3:45 XLY
4:45 XLC
5:37 XLP
6:26 XLF
7:33 XLI
9:00 XLU
10:54 XLRE
12:14 XLB
13:15 XLE

Relative Strength analysis of Sectors relative to Broader MarketRelative Strength analysis of Sectors relative to Broader Market
One of the fastest way to look for relative strength is to see how different sectors are performing relative to the broader equity markets.
I have recorded this 20 seconds video, and it gives a clear answer right now only energy and tech are performing

XLL Continues to be sidewaysXLL Continues to be sideways
Let's watch this on shorter time frame, 135 is area of confluenc
NASDAQ on the verge of retracementNot saying that the NASDAQ might not have a blow off top, but the lower high and the stalling and the candlestick patterns suggest that there is a break down incoming. MACD levelled off and is retracing already.
Likely a reversion to mean retracement, and breaking down below 11,355 (the TDST) is bad news...
Let's see

Microsoft has likely put in a near term topMicrosoft just provided an epic sell signal to the market.
The extreme reversal on volume after MSFT was up 3% and closed the session negative is indicating the sellers are emerging.
If the second largest company has put in a near term high, we could see the tech sector subdued.
Now we wait for other sell signals.
A 50% retrace is typical after a strong reversal but so is a gap down.

Weekly S&P500 Sector ReviewDiscussing all the leading sectors and stocks to identify major trends.
This weekly timeframe is suitable for longer term investors but insightful for traders.

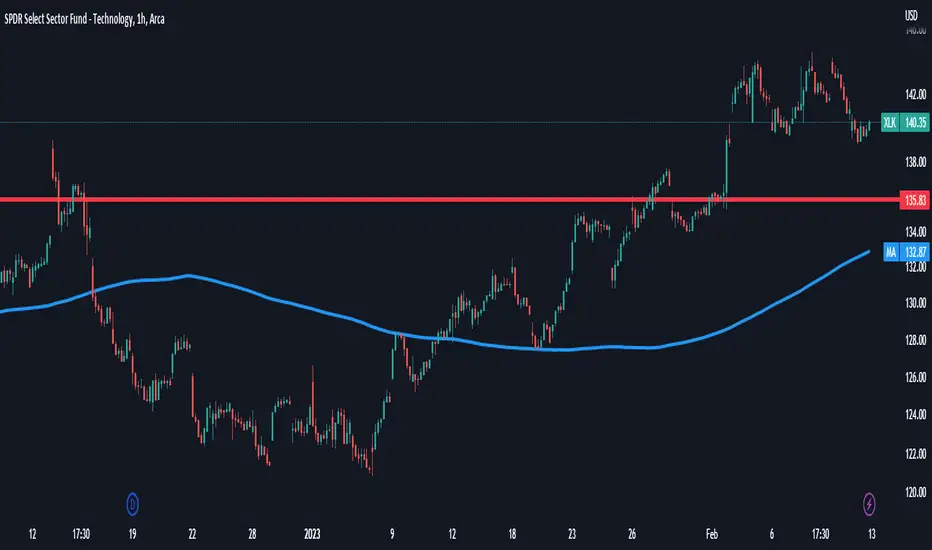
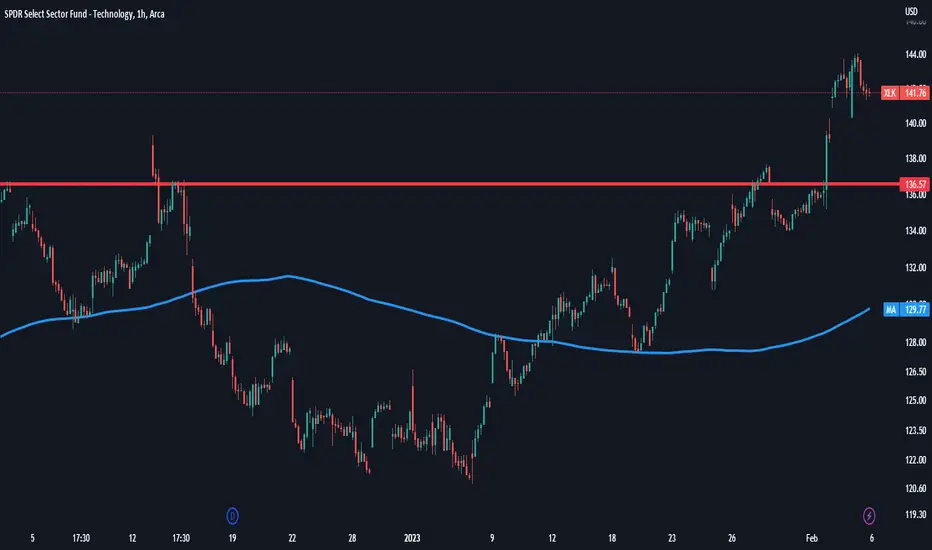
$XLK short term pullback to previous resistance$XLK short term pullback to previous resistance, interesting dynamic on short time frame
Weekly Sector Analysis S&P 500Looking into all the major sectors of the S&P 500 to see if this breakout can be trusted.
we review all sectors on a weekly basis to provide insights of the overall market.
Most sectors have not broken out & trading at major resistance.

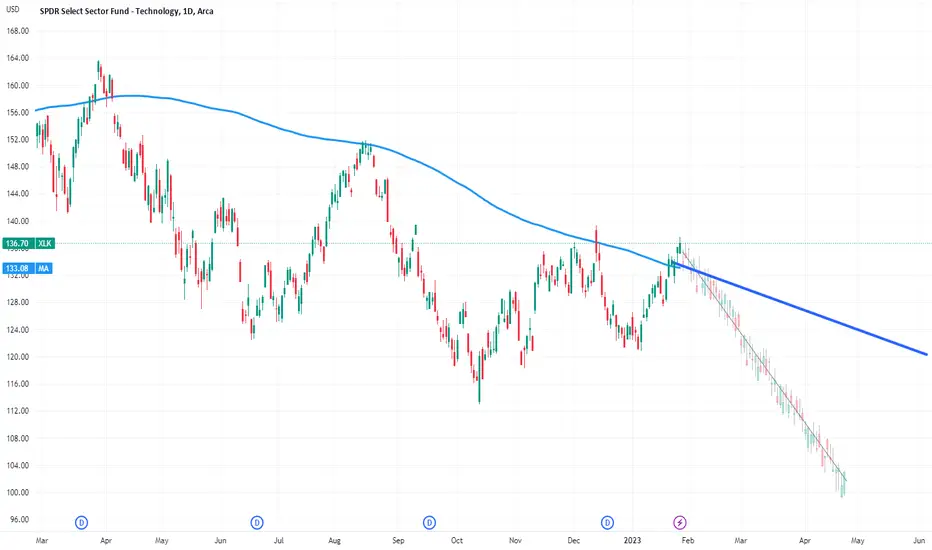
XLK Tech sector ETF, broke the 200 day moving Average downtrend,XLK Tech sector ETF, broke the 200 day moving Average downtrend, does this marks the end of the downtrend, and start of a new Bull run?
To answer this question we will have to see how this trends in weeks ahead
Tech growth is still slowing
Higher multiples are difficult to justify
JBL weekly pullback candidateSolid earnings beats, ROE 31.26, broke out of cloud and prior swing high. Good price to sales, cash flow, and debt metrics. I will consider an entry at: pivot on weekly (74.71), prior swing high (73.79), RSI(9) on daily LE 31, or RSI(12) on weekly LE 50.

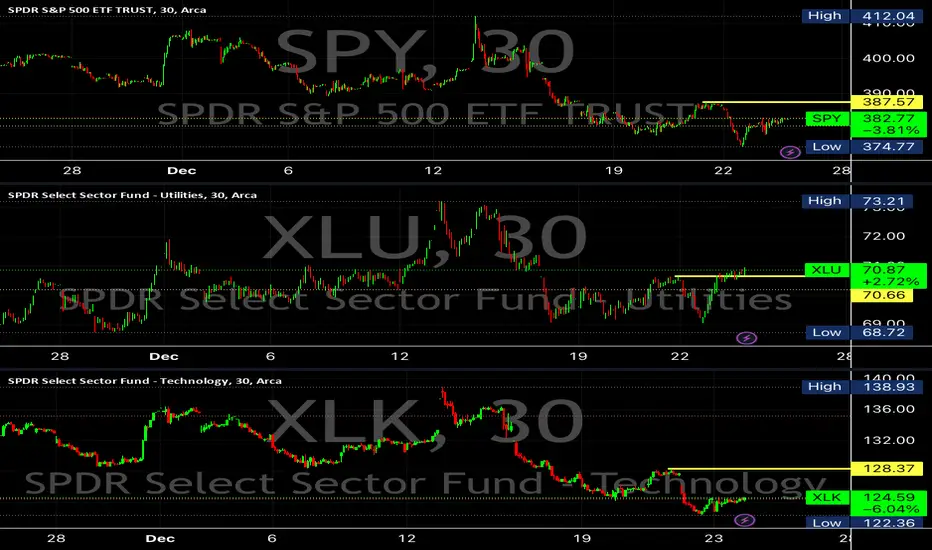
ROTATION FROM 'GROWTH' TO 'DEFENSIVE' OVER LAST 10 DAYSCHART DISPLAYS LAST 30 DAYS
Utilities ($XLU) outperforming the broader market as represented by ($SPY) and growth oriented, tech based, sub-sector ($XLK) over the last 30 days.
This has a correlation with an increased 'potential' for instances of heightened, near term (2 to 4 weeks) market volatility.
During the recent selloff we can see that the 'bids' did not push the broader market as represented by ($SPY) or the S&P 500 tech sector ($XLK) back over its pre-selloff top. On the other hand, the market did buy the utilities (XLU) back up over its respective, pre-selloff top. (see yellow horizontal lines)
So utilities stay bid while tech and the broader market begin to falter. In my opinion this is what a rotation out of 'growth' ($XLK) from the last 6 weeks and into 'defensives'($XLU) looks like from a price structure perspective. I would interpret this as an expression of 'risk off' market sentiment going into 2023. (NOT FINANCIAL ADVICE)
Portfolio Selected Visuals (PSV) vol IThis is a list of my personal portfolio selected ETFs with the simplest visuals, using MACD as the only technical indicator and the trend lines with breaks or breakdowns to give us a new series of PSV charts. ;-)
Note that these are using Weekly charts, and a break out is qualified when there is a trendline break out accompanied by a MACD crossover (within a week or two).
From left to right...
GDX (Gold Miners ETF) qualified a break out on 31 Oct, after a higher low, but sees to have met resistance (red ellipse)
ILF (LatAm ETF) is still within a trapped range.
XLK (Technology ETF) qualified a break out on 14 Nov, after a higher low, but seems to have met resistance (red ellipse) soon after.
GXC (China ETF) qualified a break out on 28 Nov, after a higher low. Appears to have another break out above a resistance line.
XLE (Energy ETF) qualified a break out on 17 Oct, after a higher low, but seems to have broke down of support/resistance (red ellipse).
INDY (India ETF) qualified a break out on 31 Oct, after a higher low, but seems to have met resistance (red ellipse).
XME (Metal Mining ETF) qualified a break out on 24 Oct, after a higher low, but seems to have met resistance (red ellipse).
EWS (Singapore ETF) qualified a break out on 14 Nov, without a higher low, and further qualified a better stronger break out pattern on 28 Nov.
From this set of visuals, GXC and EWS are the front runners. GDX appears a close third.

XLK target 122.07 on 12/22/22Could not break out of down channel at the 61.8% retrace. Considerable resistance overhead and weakening RSI. Look for target of 122.07 on 12/22/22.

NVDA Potential - but....NVDA showing the makings of a Cup & Handle Breakout. It has retraced 78% from high, and has attempted to clear the 78% fib line. However, it is riding the upper band of the Bollinger, which is widening and signalling a consolidation. There is considerable resistance above which might lead to a false breakout and breakdown.
I would consider a long swing position only if it takes out its most recent high (black horizontal line) and consolidates the handle tightly.

Anatomy of a NASDAQ interim topAn interesting set of events just occurred in the NASDAQ futures. In early November, the NASDAQ (and most market indices) spiked in a bullish rally, only to find a resistance at about 12,000 in mid-November. It then retraced to test the support at 11,560. While it bounced off the support then, there was a momentary spike down to 11,528. This is the significant low for this consolidation range at the top of the short term rally. The bounce brought it to 11830, where a resistance level was failed. This was then followed by a revisit to the consolidation range support (bottom of yellow box).
About an hour ago, a lower low was triggered (red support line) and currently the NASDAQ futures is struggling to keep above the consolidation zone support.
Technical indicators MACD and VolDiv are slightly bearish, boding a more likely breakdown. MACD crossed under, and remains under the zeroline. VolDiv is not uptrending, but below its SMA, and looking for a breakdown below zero line.
Also noted is the green "BD" where it denotes a Break Down of an auto-plotted trendline support.
The price action is a little long to the downside, and has been support hugging. It is likely to have some sort of a rebound, but what happens next depends on whether there is more juice to sustain. A technical rebound is due and appears to be forming up at time of writing. Definitely, is there enough juice to get this to the upper part of the range?
The other thing here is that a decisive breakdown out of the consolidation range is needed and appears to be lining up for the later part of the week. This is invalidated IF a technical rally closes above 11850.
Wait for it...

COINBASE in technical trouble... Noted that Coinbase COIN is in some sort of technical trouble.
Based on downside projections, the downdraft is technically aligned and sound, with a target of 23.36, by mid-December. This is a 50% cut in stock price from last Friday's closing.
An earlier breakdown of the triangle, and the more recent failure of the 2022 support last Friday suggest more downside to follow in the days and weeks ahead.
Heads up...

Financials XLF Flipping Technologies XLK..The last time Financials flipped Technologies was in 2000 which lead to six years straight of overperformance by the banking industry.
This is an important relationship to keep an eye on. These types of trends tend to stick for long periods of time and can lead to generational trades.

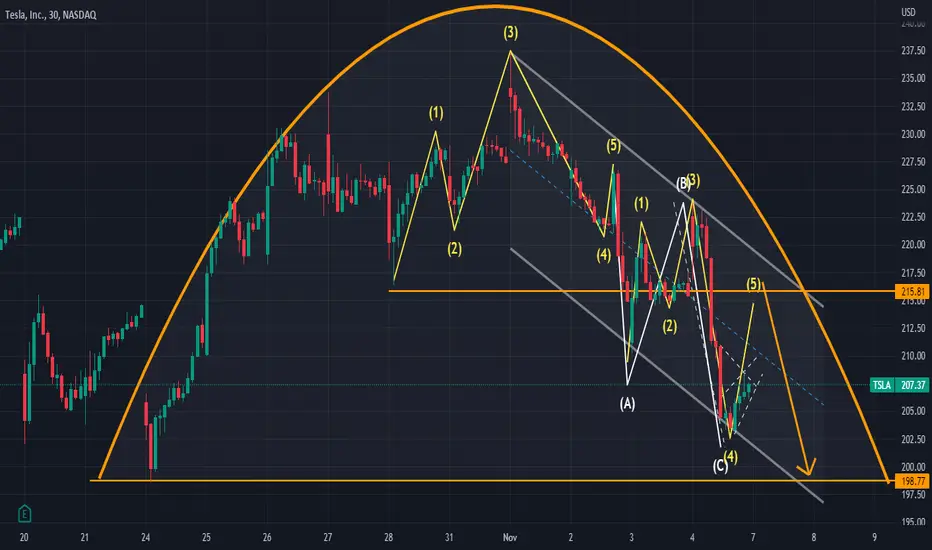
bearish rounding top on Tesla forming , short setupcurrently in a 4th way up , however there is a bear flag forming I see. Tesla needs to get over $215, to possibly invalidate the bearish sentiment. Even still, it would also have to breakout above trendline resistances near 220-225. That might be a difficult task. There is also B leg of the previous cypher pattern, that will act as a resistances for wave 5. I'm looking for a short entry above $215.00, if price action fails to get above this level. I'm looking for a quick breakdown below $200... Monitoring for short set up
technology with bullish base needs to clear $130 to test C legI have a short term target of $130.00, after buyers stepped in and bought D leg of the bullish Cypher. Price action needs to clear C leg of the ABCD pattern, which would lead to a higher price action to C leg of the ABCD pattern.
Disclosure: I have calls on $tecl (3x technology bull)
