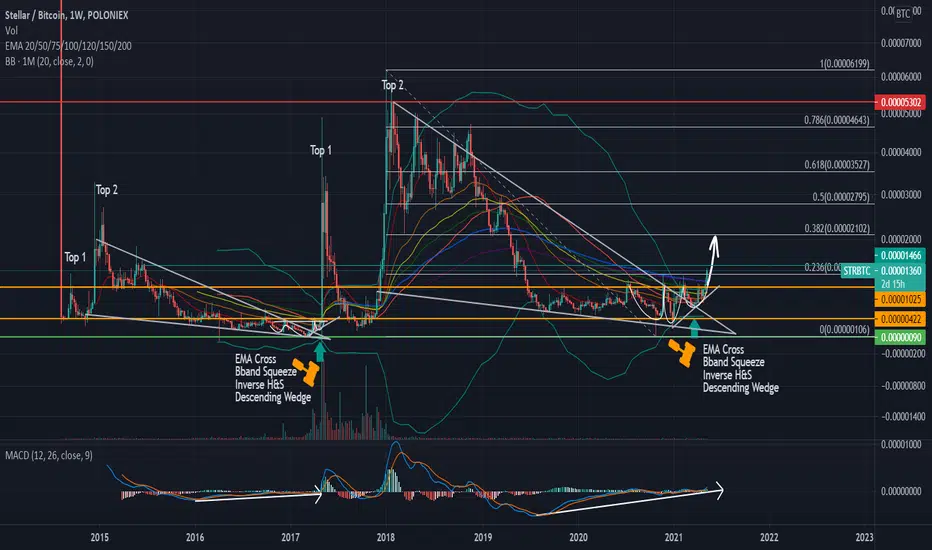
STELLAR LUMENS (STR/BTC|XLM/BTC) LONG TERM MOVETechnicals:
Weekly EMAs are crossing and momentum is shifting towards the bulls
Monthly BBands are squeezed tight and significant accumulation has taken place over the past couple of months and the BBands are ready to expand for a parabolic move
Descending wedge repeating fractal pattern
Inverse H&S pattern formed on the daily period (same at the start of the previous 2017 cycle)
BTC Ratio Targets:
TP1 = +- 0.00002100
TP2 = +- 0.00002800
TP3 = +- 0.00003500
TP4 = +- 0.00004600
TP5 = +- 0.00006200
Xlmbtc
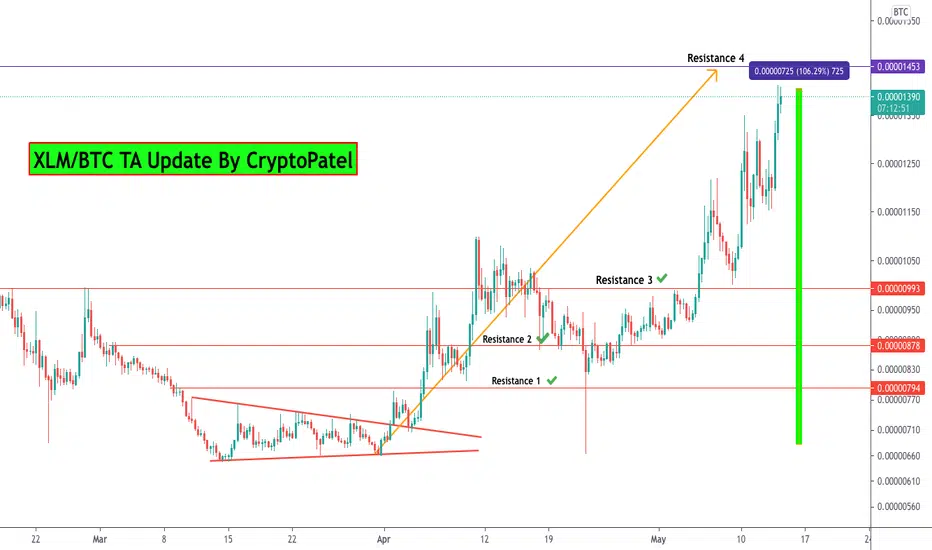
XLM/BTC now 100% up from our entry zone congrats guys#XLM/BTC Profit Update:-
#XLMBTC currently trading at 1400 Satoshi
And hope you are enjoying my signals.
106% pure profit from entry after market dump also #XLM in green zone.
Entry:- 690 Satoshi
TP1:- 794 Satoshi ✅
TP2:- 878 Satoshi ✅
TP3:- 993 Satoshi ✅
TP4:- 1453 almost done went upto 1413 Satoshi
Still I am expecting from #XLM
I can expect 2000/3000 Satoshi
But only hold profit not try to hold 100% positions.
Always book profit partially time to time.
🚨:- This analysis is not for fresh entry.
Support:- 1300/1200/1000 Satoshi
Resistance:- 1453/2000/3000 Satoshi
Please click like button and Appreciate my hard work.
Must follow me for latest crypto real time updates.
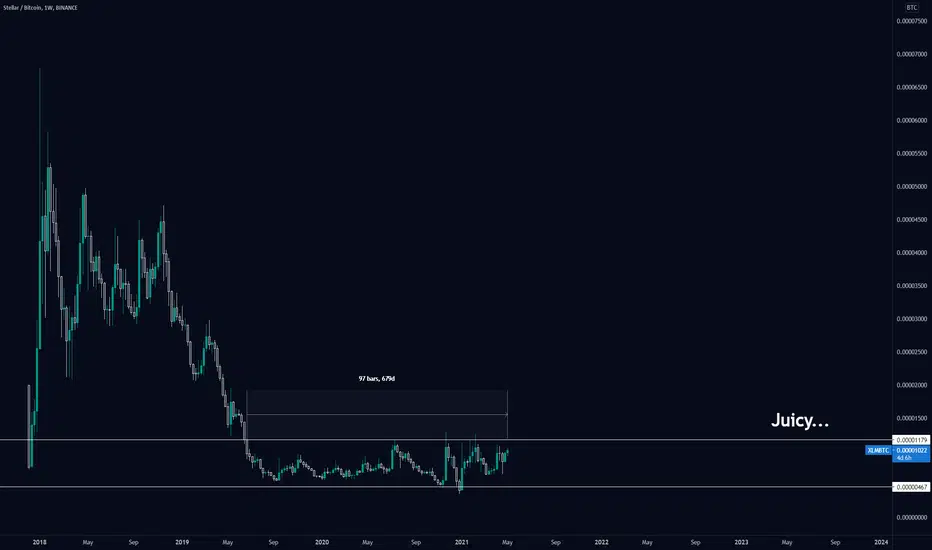
XLMBTC breakoutXLMBTC breaks out from the 2 years long consolidation, it's an easy 2x play buying from current levels
(Rectangles tends to not only fulfill but double or even triple depending on how long the consolidation phase it had)
###NOT FINANCIAL ADVICE###


Stellar XLM/BTC UpdateXLM/BTC looks ready to rumble. A break out above this parallel channel should send it flying.
Mid Term Targets: 0.00002150, 0.00002880, 0.00002950

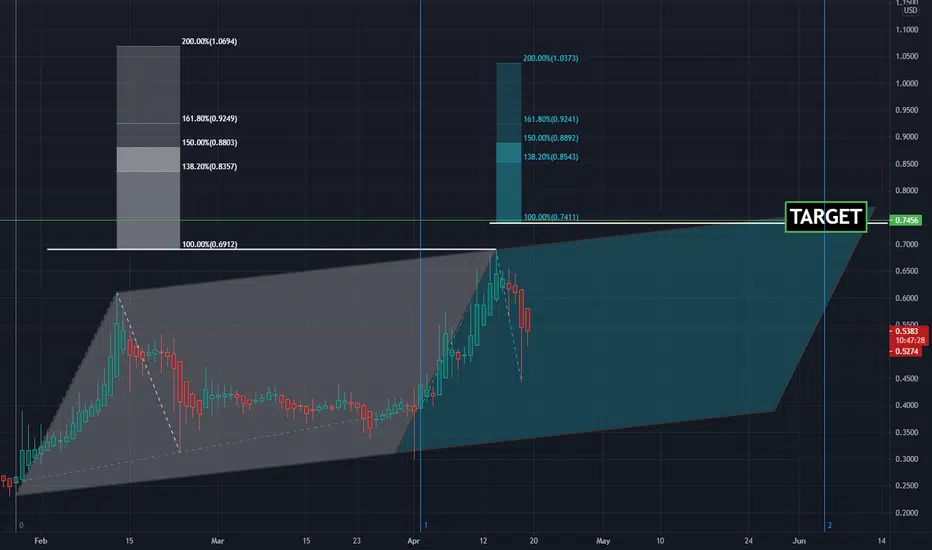
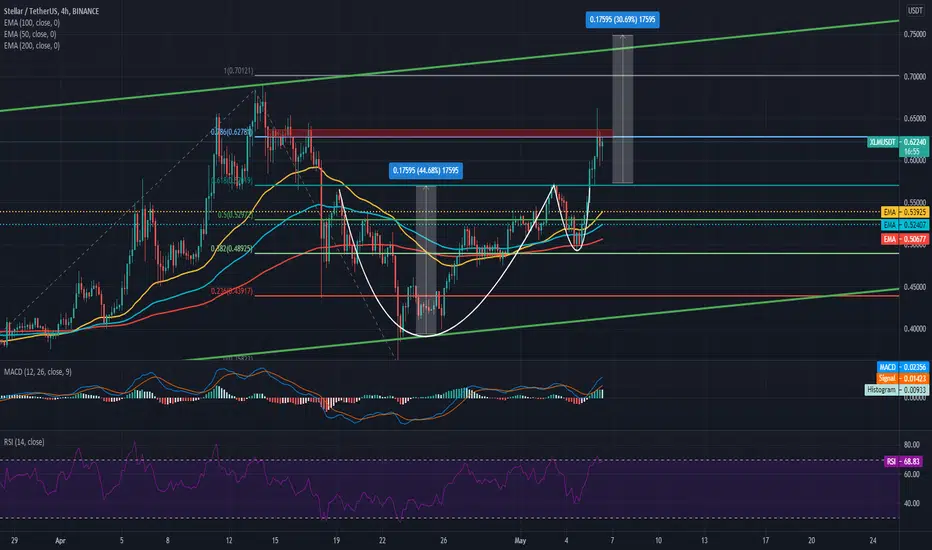
A sensible very short term XLMUSD <0.68$ correctionA sensible, most likely A-B-C 0.5/0.618 retracement
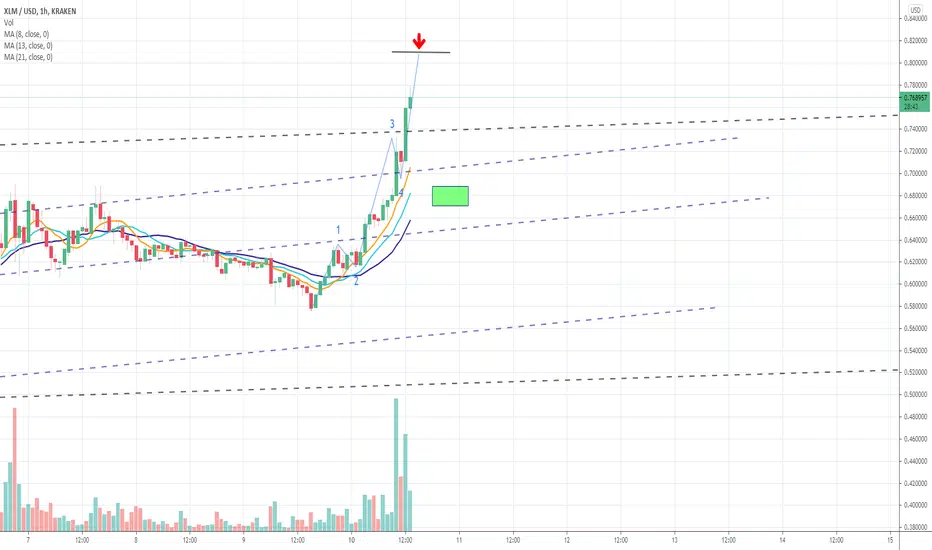
XLMUSDBased on the FIB Extension on Jan 28 / Feb 13 / Feb 21, I expect a similar pattern for the Apr 2 / Jun 5 timeframe.
Not investment advice.
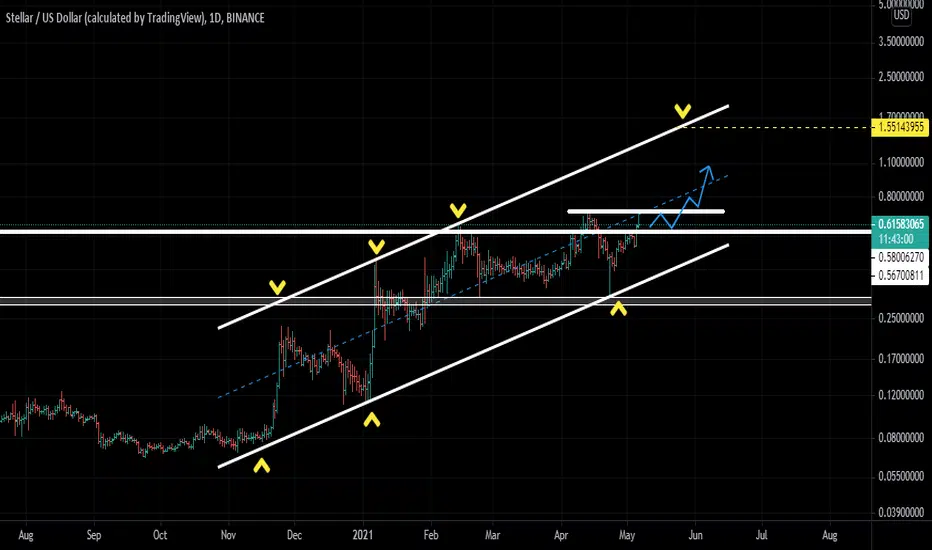
XLM to 72c....upward channelNice upward channel for XLM and looks like it is trailing now at the support line moving up. Good time to lock in a sweet price before this hits $1 or higher......


Longing for Sats #5 - XLM/BTCXLM/BTC pair has found support and I expect it to stay in this range for a bit before deciding to break up or down with increased volume (currently leveled out). I'm long with a stop loss.
Bullish if it breaks upwards to test resistance again
Very very bullish if we close above resistance
Bearish if it breaks down below support

XLM: 1750 - 2600 - 3500 - 5000 stsLong correction is enough!
1750 - 2600 - 3500 - 5000 sts are waiting for XLM.

XLM almost thereHello everyone,
Nothing new to my followers as you guys know I´m big XLM fan but for newcomers and to remind what to look for ...
Huge opportunity is cooking up for XLM. The accumulation phase is heading to its end and once XLM breaks 1200 satoshi main resistance then it should perform really well next weeks and months
Cheers
ChaChain
-------------
Disclaimer:
I´m not registered or licensed in any jurisdiction whatsoever to provide investing advice or anything of an advisory or consultancy nature, and therefore I´m unqualified to give investment recommendations. Always do your own research and consult with a licensed investment professional before investing. This communication is never to be used as the basis of making investment decisions, and it is for entertainment purposes only.
KEYWORDS
R:R, money management, risk, reward, technique, style, trading, bitcoin , bitcointrading, profitable trading, profittrading, profit trading, secret, divergence, bull divergence, bear divergence, divergencetrading, divergence trading, trading strategy, how to trade bitcoin , bitcoin trades, bitcoin trading, make profit, take profit, trading strategy, trading technique, successful, successful trader, successful technique, successful strategy, successful secret, how to trade, trend analysis, technical analysis , indicators, rsi , relative strenght index, let it rain, successful life, easy strategy, easy trading, easy technique, make money, crypto investing, investing, crypto, cryptocurrency, cryptocurrencies, mentoring, money, chartart, beyond technical analysis

StellarXLM has great potential! If it breaks the resistance we can see a giant rise to 0.618 fib level


$XLM, Looking for continuation toward ~1200 sats$XLM
Bot took an entry on the latest 1D Buy as volume is slightly rising..
Looking for continuation toward ~1200 sats (YTD high & highest level since 2018) after the R/S flip on whats now support at ~1k sats
Give it time to develop
#XLM

Stellar ready for interstellar travelXLMBTC is the largest base I have ever seen in crypto. The weirdest and largest at the same time... This could seriously reach the stars once it gets going. I think there are some pretty big forces behind stellar, especially as Jed McCalleb has managed to escape from the wrath of the SEC.
Stellar is one of those coins that had a massive run in 2017, its supply also increased massively, was the only one that held strong without capitulating for so long... And was the only such large coin with such few listings. Clearly a lot have changed since then, tons of listings, tons of news pairs and so on... And I think this will have a massive impact on the price. Jed is also a very rich and powerful man and they are trying to do quite a lot of stuff to send it much higher. In terms of price, this is more than ready.
The two lines are the places i'd sell some short term. Looking fantastic and I don't think the pump will be delayed for much longer, especially when it makes a new ATH vs USD.


Stellar (XLM) - May 4Hello?
Dear traders, nice to meet you.
By "following" you can always get new information quickly.
Please also click "Like".
Have a good day.
-------------------------------------
(XLMUSD 1W chart)
(1D chart)
You should watch for any movement that deviates from the 0.50032101-0.65641072 section.
In particular, we need to see if it can climb along the uptrend line and rise above the 0.61234368 point.
If it falls at the point of 0.44829110, a Stop Loss is required to preserve profit and loss.
However, it may rise along the uptrend line, so careful trading is necessary.
-------------------------------------
(XLMBTC 1W chart)
It remains to be seen if it can move above the 1029 Satoshi point and turn into an upward trend.
(1D chart)
We have to see if we can rise above the critical point, the 1029 Satoshi point, and get support.
In particular, we have to see if we can move upward from the 1130 Satoshi point and move towards the 1560 Satoshi point.
It deviated from the long-term downtrend line, and the starting point of the uptrend is expected to begin with support at the 1029 Satoshi point.
--------------------------------------
It is advisable to trade at your average unit price.
This is because if the price flows below your average unit price, which was on an uptrend or downtrend, there is a high possibility that you will not be able to earn a large profit due to the psychological burden.
The center of every trade starts with the average unit price you start trading.
If you ignore this, you may be trading in the wrong direction.
Therefore, it is important to find a way to lower the average unit price and adjust the proportion of the investment, so that the money that ultimately corresponds to the profit can regenerate the profit.
-------------------------------------------------- -------------------------------------------
** All indicators are lagging indicators.
So, it's important to be aware that the indicator moves accordingly with the movement of price and volume.
Just for the sake of convenience, we are talking upside down for interpretation of the indicators.
** The wRSI_SR indicator is an indicator created by adding settings and options from the existing Stochastic RSI indicator.
Hence, the interpretation is the same as the traditional Stochastic RSI indicator. (K, D line -> R, S line)
** The OBV indicator was re-created by applying a formula to the DepthHouse Trading indicator, an indicator published by oh92. (Thank you for this.)
** Check support, resistance, and abbreviation points.
** Support or resistance is based on the closing price of the 1D chart.
** All explanations are for reference only and do not guarantee profit or loss on investment.
Explanation of abbreviations displayed on the chart
R: A point or section of resistance that requires a response to preserve profits
S-L: Stop Loss point or section
S: A point or segment that can be bought for profit generation as a support point or segment
(Short-term Stop Loss can be said to be a point where profit or loss can be preserved or additionally entered through installment transactions. It is a short-term investment perspective.)
GAP refers to the difference in prices that occurred when the stock market, CME, and BAKKT exchanges were closed because they do not trade 24 hours a day.
G1: Closing price when closed
G2: Market price at the time of opening
(Example) Gap (G1-G2)

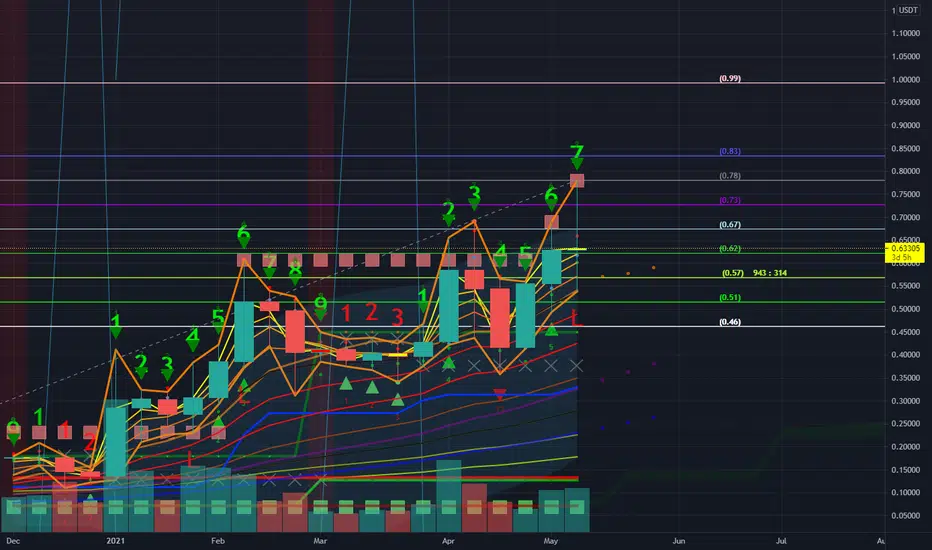
Follow The Dots I DoI started trading XLM in 2018 when trading was strictly btc based. Then it seemed to lay low for a year and a half till late 2020. Staring last November XLM started making a real nice wave pattern on the MacD 1 D. Since XLM is a longterm stable coin in the crypto world, it provides a great example of the trade on the MacD dots.
For the last three years I’ve been trying to figure out a trading strategy that works for me. You see, I don’t have five big computer screens showing me the actual electronic pulse of crypto space that I can glue myself to. I got a job. I cook in the house. I try and go fishing occasionaly. I don’t want to be fretting and worrying about a trade I make. Nor do I have time to be “on it” all the time. What to do says I.
Then a postulation. What if one just traded following the MacD 1 D dots.
I was giddy with excitement.
Could this be a concept? Could this allow me to trade oh with ease on my shoulders and good sleeps at night. Lets us use the last XLM MacD 1 D wave that started November 07 and SEE if this concept could actually work.
To even make it more for me, I’ll just admit up front that I miss the lower buy dot and the upper sell dot by 1 day. You know, because I have a job, and gotta cook and fish once in a while. I also roughly estimated the purchase price on that day to keep math simple. Let’s use an initial invetsment of $1,000 so it’s easy to see where we end up.
1st trade
buy - Nov 07 @ 0.08
sell - Dec 05 @ 0.16
result - +100% = $2,000
inconsequential (incon) trade - Dec 19/21
An inconsequential trade is basically an in and out. It has no great effect on the outcome so I didn’t include them in the math. I show them because they happen. Fortunately, there are only two during this time period.
2nd trade
buy - Jan 06 @ 0.33
sell - Jan 18 @ 0.29
result - - 14% = $1,720
3rd trade
buy - Feb 01 @ 0.31
sell - Feb 21 @ 0.50
result - +61% = $2,769
inconsequential (incon) trade - Mar 21/25
4th trade
buy - Mar 30 @ 0.39
sell - Apr 18 @ 0.59 / 0.52
result - +51% = $4,181
5th trade
buy - May 02 @ 0.54
Man I wish I really did this because I’d be pretty happy right now. Anyway, life isn’t that simple. Of course I do due diligence, I follow some social media, although I find it thick with too much comment. I also utilized all the time frame MacD’s as well as other indicators to get a good overall and specific picture when choosing a buy in / sell out.
Therein lies the basis of the concept.
So where now XLM ?
Well the 5th pretend trade is active. I believe we’ll see another uptrend ossilation with the high perhaps 0.90 or maybe even that elusive yet shinny penny man.
My thoughts, not advice Oklah. Cheers
