XLMUSDT I started forming a bullish positive channel, which I think is a good opportunity to enter
Bottoms are entry points and headers will be selling points.
Do not enter the currency with all your capital, if the bullish pattern is broken and the exit from the price channel to the bottom falls, the pattern will fall, you will place loss stops at the bottom before the bottom from which you will enter …..
what is your opinion ??
support me
thank you
Xlmbtc
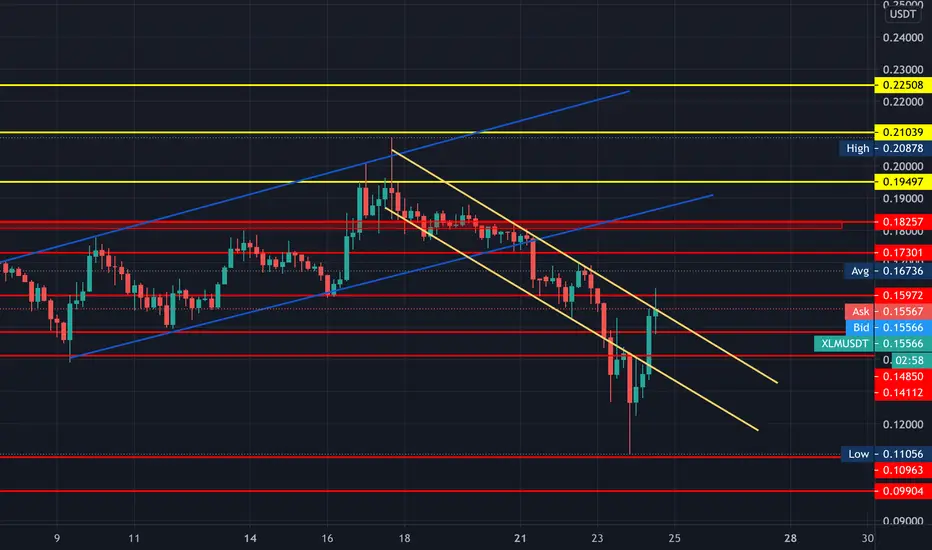
XLMUSDT Currently, the XLM the channel broke the bearish price. If the next 4-hour candle closes above it, you will try to bounce back up again and try to enter the old positive price channel if you break the strong support at 0.18250 area.
what is your opinion ?
please share with me your opinion …
thank you
Stellar even follows the SEC news that XRP received lol..Stellar even follows the SEC news that XRP received lol..
When uncorrelated?

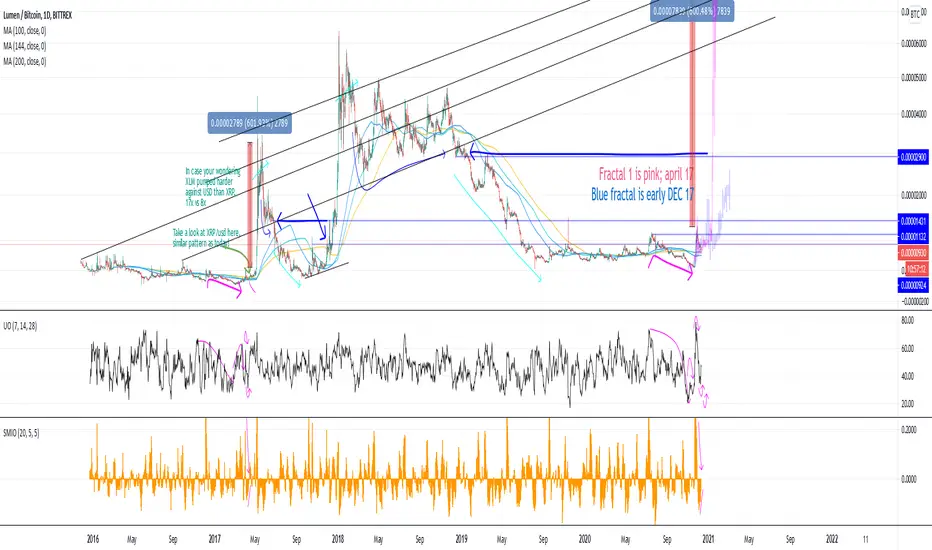
XLM/BTC long term graph showing possible pathsXLM/btc
Take a look at the xlm and xrp /usd charts for these highlighted periods. Both look possible. I am leaning towards April 17 option though (pink).
I am always wondering which to hold more of though. If pink replays then XLM is the one to hold. So after XRP snapshot ill be re balancing much heavier into XLM.
Let me know what you think! I've been doing these type of charts/analysis for years but never published them before. :)
GLHF
Technical Outlook on XLM.XLM is a very similar story as XRP as they correlate a lot. So the most of thing said about XRP can be also said about XLM.
Still we can find one difference that the price is pointing towards the support area located at $0.145 to $0.15 per XLM, as the MACD is on a selling wave.
As the price is currently located at $0.17 area, a break of $0.207 will bring bullish momentum while a break below $0.145 will bring bearish momentum.
It seems like the price of XRP is ahead of XLM as the 50 EMA was tested already, while XLM wasn’t tested yet and is currently located in the support area.
The overall outlook for XLM looks bullish in overall as the price as above both 20 and 50 EMA levels and the RSI is trending higher.

XLM USD where will we go next? Hi everyone, this morning we saw a breakout in most cryptocurrencies. This is my first analysis that I am posting publicly and would appreciate some feedback. I am fairly new to trading, and would advise you to do your own research. This is for learning purposes only, not financial advice.

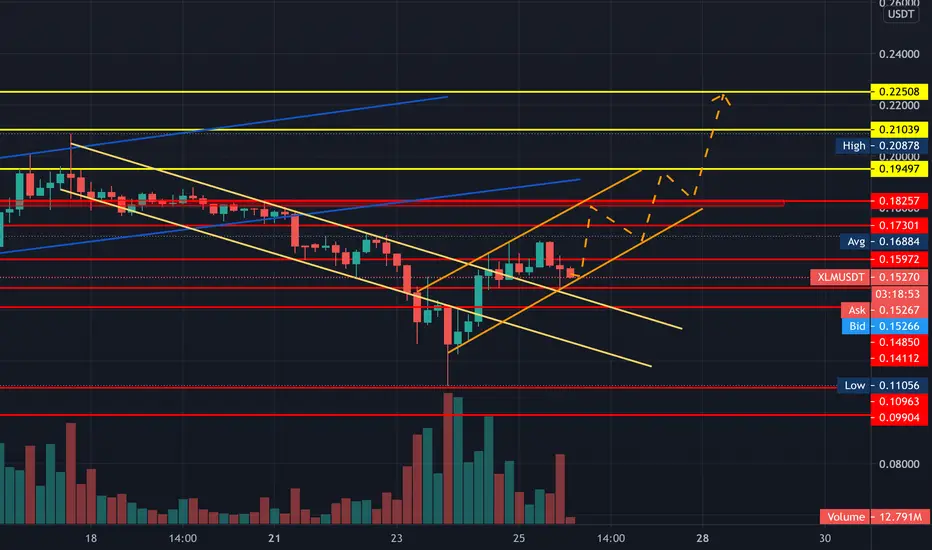
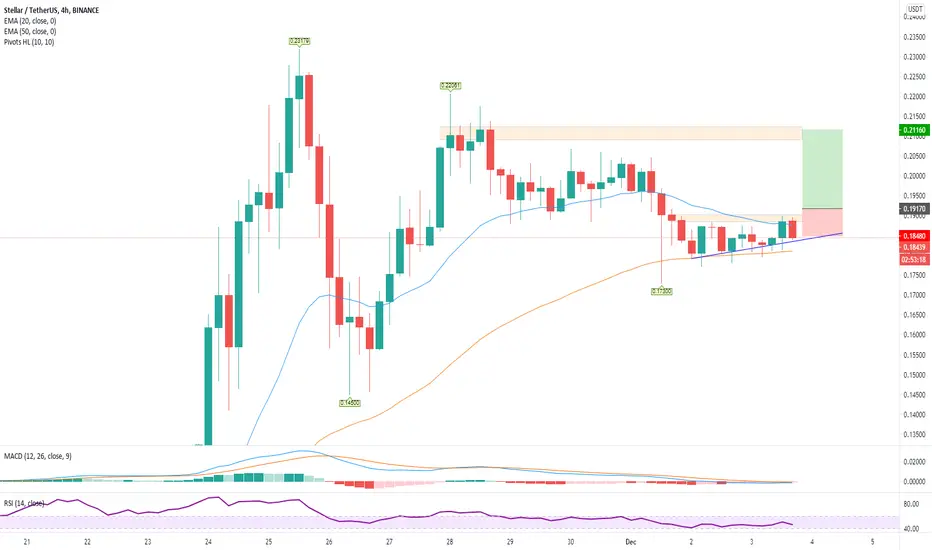
XLM Buy a break setup.Stellar - Intraday - We look to Buy a break of 0.1917 (stop at 0.1848)
Price action has formed a bullish ascending triangle formation.
A break of 0.1920 is needed to confirm follow through bullish momentum.
Short term MACD is moving higher.
50 4-hour EMA is at 0.1800.
We look for gains to be extended today.
Our profit targets will be 0.2116 and 0.2248
Resistance: 0.1900 / 0.2000 / 0.2120
Support: 0.1800 / 0.1730 / 0.1570
Bull Flag on the dailySeeing a bull flag forming on the daily. If the next couple days break out from the top with relatively high volume, should continue the upward momentum from last week.
Not investment advice.


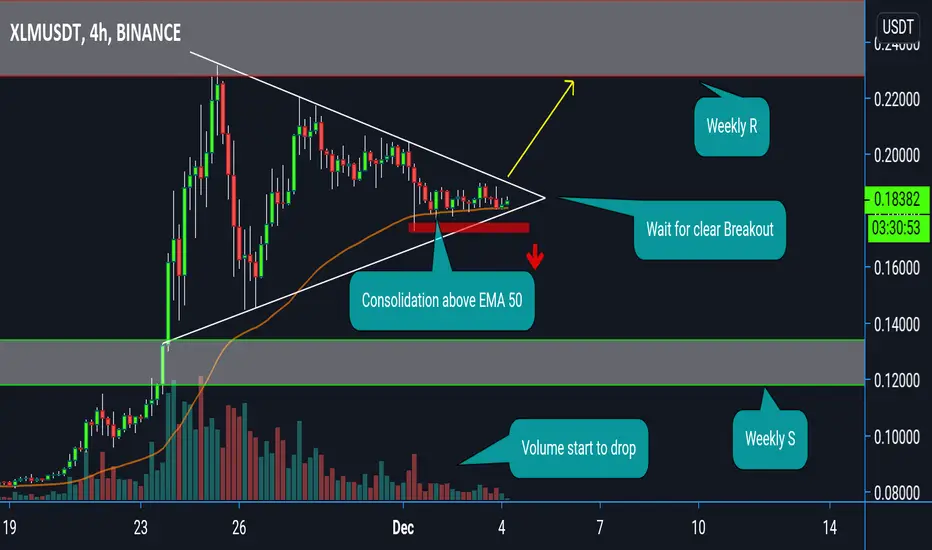
XLM / USDT wait for clear BreakoutXLM / USDT
🌟 Techincal Analysis 🌟
The price after recent massive pump start to consolidate and volume dropping
These are normal signs before every big move of the price
Market on edge of both way and in senstive area
dont try to guess the way up or down
Alot top tether coins show this pattern now
wait the clear Breakout confirmation before entery
And if you are already on the market ...then the price shouldn't close below this pattern
If Breakout upward happened
the targets are around 0.22$-0.25$ (Weekly R)
If breakdown below
targets are around 0.13400-0.11 area (weekly S)
Please have a plan before trading and use stoploss
Good luck and happy trading 🌹
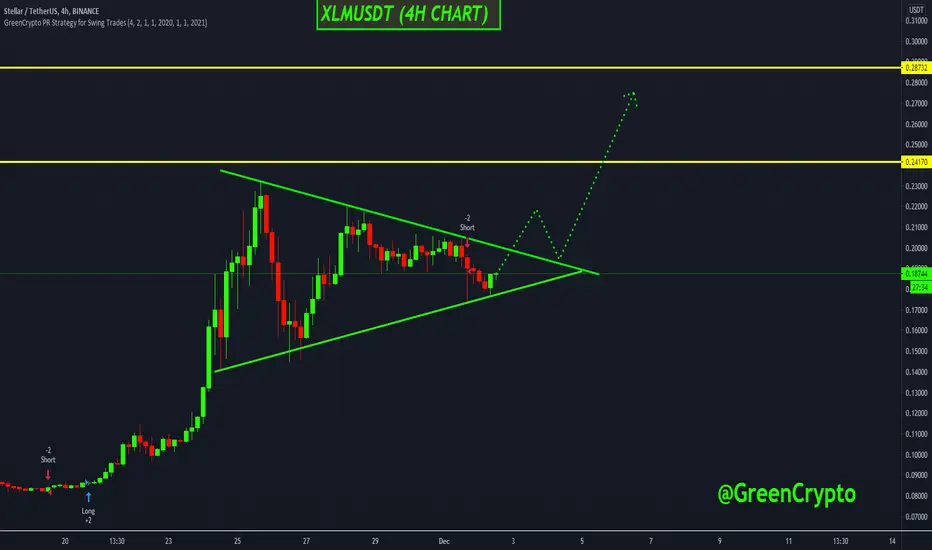
Stellar XLMUSDT - Symmetrical triangle + Bullish continuation- Stellar is now popular to traders due to increased volatility and huge gains
- No reason to be bearish, as this triangle should be a bullish continuation pattern
- Trading volume is decreasing, which will lead to explosive move
If you want more of these ideas, hit the like button and follow me, so you don't miss any update!
Also, check my signature down below ↓

XLMUSDT (Symmetric triangle )#XLMUSDT Technical Analysis Update
'
Wait for the Symmetric Triangle Breakout
XLM/USDT currently trading at $0.1872
LONG ENTRY: Only enter long after Symmetric triangle Breakout
STOP LOSS: I will update once Break out happened in 4 h chart
Resistance level 1( Target): $0.2410
Resistance level 2 (Targe ): $0.2870
Max Leverage: 4X
ALWAYS KEEP STOP LOSS...
Follow our Tradingview Account for more Technical Analysis Update, | Like, Share and Comment your thoughts
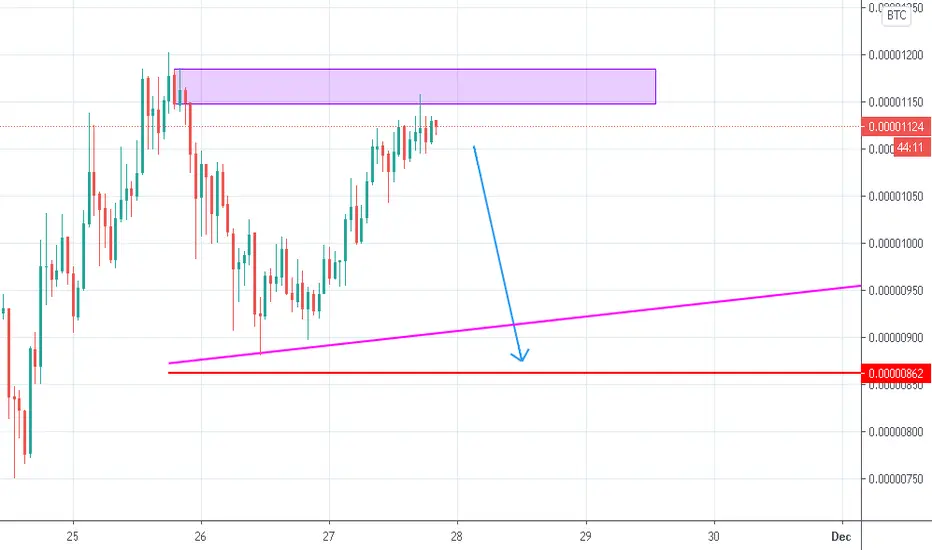
XLM/BTC - Breakout from Double Three Correction
An update on XLM/BTC. It looks like a clear breakout from the Double Three structure with price breaking out from the zigzag into an initial five wave impulse of a smaller degree. Let's see how it plays out for confirmation.
Please refer to the previous idea I have linked below and follow for further updates.
Trade safe,
Beyond Edge
Disclaimer
This is not trading advice. All content/ information shared in this idea is purely educational in nature and is expected to be used for analysis and illustration purposes only.
Do not trade or speculate based solely on the information provided. Trust your own analysis.
Beyond Edge

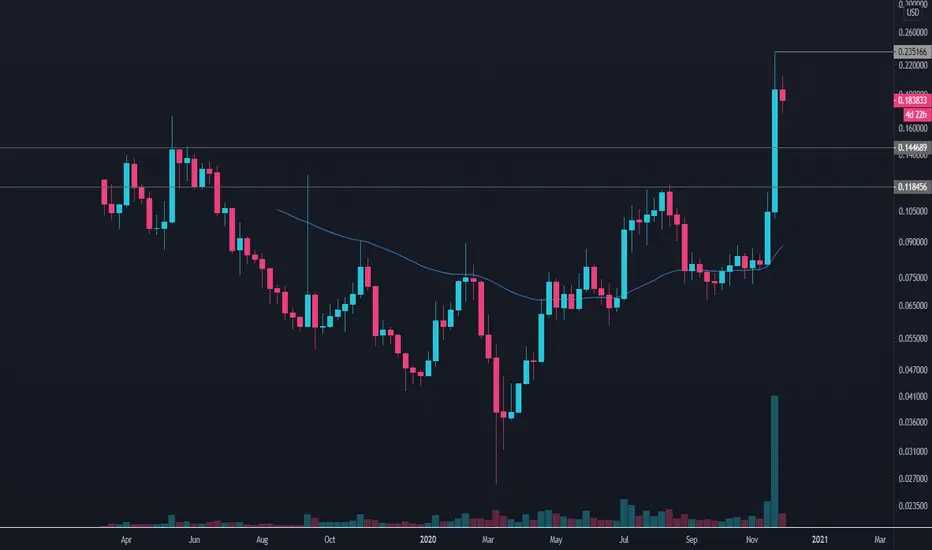
Long term XLM/USD Looking Bullish on the Weekly time frame. Looking for a pull back to 0.155 area for entry. PT 0.53 area
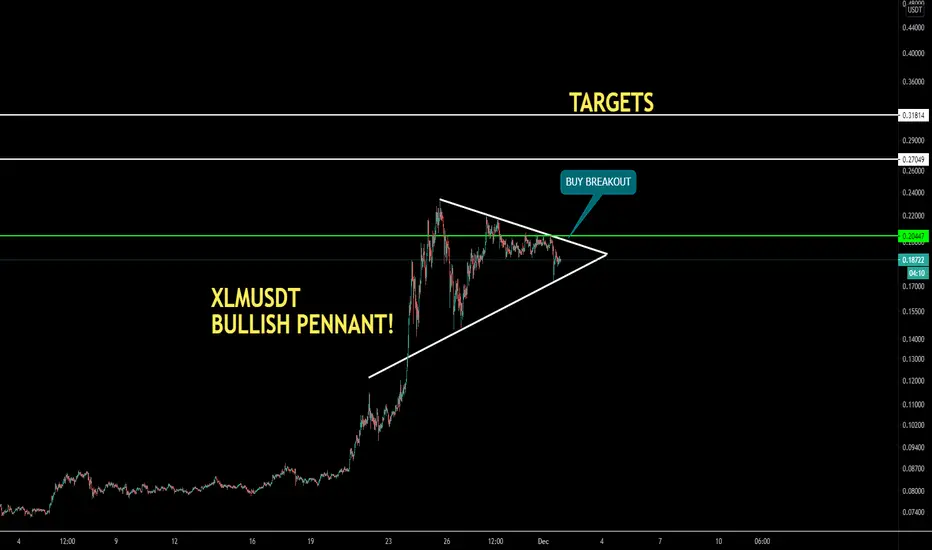
#XLMUSDT Bull Pennant! What Is Stellar (XLM)?
Put simply, Stellar is an open network that allows money to be moved and stored. When it was released in July 2014, one of its goals was boosting financial inclusion by reaching the world’s unbanked — but soon afterwards, its priorities shifted to helping financial firms connect with one another through blockchain technology.
The network’s native token, lumens, serves as a bridge that makes it less expensive to trade assets across borders. All of this aims to challenge existing payment providers, who often charge high fees for a similar service.
If all of this sounds familiar, it is worth noting that Stellar was originally based on the Ripple Labs protocol. The blockchain was created as a result of hard fork, and the code was subsequently rewritten.
💠Join The Crypto Collective For More Signals & Set-Ups💠
💠Like, Comment and Follow Us for More💠
XLMUSDT (Support Breakout)
XLMUSDT (H CHART) Technical Analysis Update
Support Breakout
XLM/USDT currently trading at $1.16
SHORT Entry: 0.19$ - 0.18$
STOP LOSS ( support): 0.2070
Support level (Target) : $0.0.1466
Support level 2 : 0.11600
Max Leverage: 3X
ALWAYS KEEP STOP LOSS...
Follow our Tradingview Account for more Technical Analysis Update, | Like, Share and Comment your thoughts

XLMUSDT (stellar) Symmetric Triangle Breakout#XLMUSDT Technical Analysis Update
Symmetric Triangle Breakout
XLM/USDT currently trading at $0.2000
LONG ENTRY: Only enter long after Symmetric Triangle Breakout in 4 h chart
STOP LOSS: I will update once Break out happened in 4 h chart
Resistance level 1( Target): $0.2410
Resistance level 2 (Targe ): $0.2870
Max Leverage: 5X
ALWAYS KEEP STOP LOSS...
Follow our Tradingview Account for more Technical Analysis Update, | Like, Share and Comment your thoughts

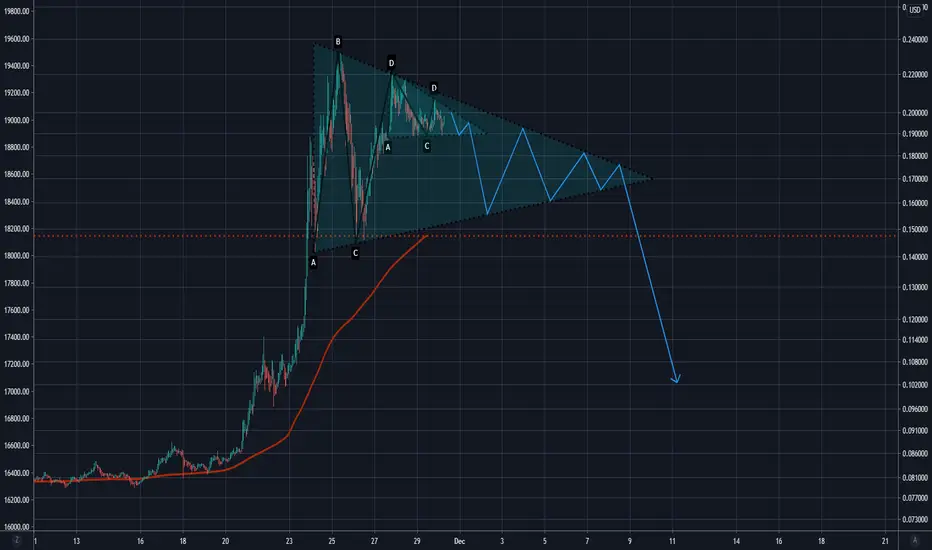
xlmusd in reversal pennant descending triangleXLM seems forming big and small descending triangles.
If XLM will be at 21 cent tomorrow then uptrend.
Otherwise pirce below 19 will result to crush till 10 cent and further lower till end of December.
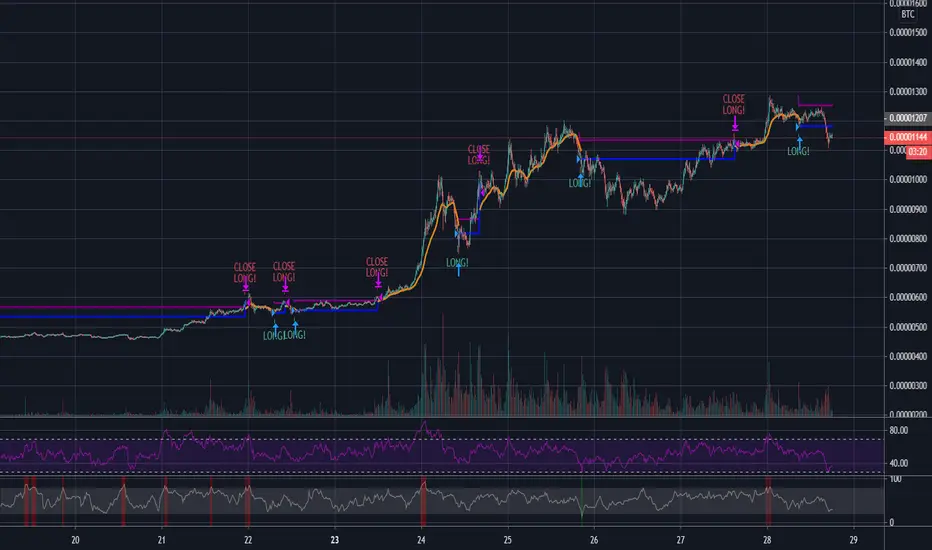
Gunbot Backtesting Automated Trading on BTC-XLM with +42% profitGunbot Backtesting Automated Trading on BTC-XLM with +42% profit
Gunbot Backtesting Gain-Gain 15 min strategy on BTC-XLM - +42% in Profits!
What's This Chart About ?
This is a Backtesting result for the Gunbot trading bot Gain-Gain Strategy (plus additional custom confirming indicators)
Coin-pair : BTC-XLM
Trading on: Binance
Gunbot Strategy : Gain-Gain
Estimated Profitability (LONG | Buy+Sell): ~ +42%
(Based on the last 21 days of trading history)
Gunbot Strategy Specs:
PERIOD = 15
BUY_LEVEL = 0
GAIN = 6
MFI_ENABLED = true
MFI_BUY_LEVEL = 45
MFI_SELL_LEVEL = 60
MFI_LENGHT = 20
RSI_BUY_ENABLED = true
RSI_BUY_LEVEL = 45
RSI_SELL_ENABLED = true
RSI_SELL_LEVEL = 50
RSI_LENGHT = 20
Optional Gunbot Strategy Settings (NOT included in the above backtesting chart):
- activate the DCA / Dollar-cost-averaging function in your Strategy settings ( this would re-buy 50% of the invested capital, each time the price drops 2% with a watching trigger starting when the price is at bought price minus 0.5% ).
- The CU_CAP_COUNT is the number of times Gunbot will trigger the DCA trading logic.Set accordingly.
DU_CAP = 0.5
DU_CAP_COUNT = 5
DU_BUYDOWN = 0.5
DU_METHOD = 2
Scripts used : Allanster's Gunbot Deluxe Tuners BE
tradingview.sweetlogin.com
Automated Trading Bot used : Gunbot Ultimate
thecryptobot.com
_______________________________________
Gunbot is a Trading automation software for crypto-currencies . Gunbot works with following markets : Bitmex, Poloniex, Bittrex, Cex.io, Binance, Coinbase Pro (GDAX), Kraken, Bitfinex, Kucoin, Cryptopia, Huobi .
Available Trading Strategies in Gunbot 20
ADX | ATRTS | Bollinger Bands | Bollinger Bands (TA) | EMAspread | Emotionless | Gain | Ichimoku | MACD | MACDH | PingPong | StepGain | SMAcross | Trailing stop – stop limit | Time series analysis + more
_______________________________________
DISCLAIMER: By using this script, you agree to the 'Terms of Use' at TheCryptoBot.com, as presented on our website (TheCryptoBot.com) and below.
This script is strictly for individual use and informational purposes only. Any information provided on this website, or, via our website, or, via our profile, or via emails, is not to be considered legal or investment or financial advice. Investments are made at your own risk. TheCryptoBot.com is not responsible for any losses you may incur.

Here I go long on Stellar Lumens and XLM will go upHere I go long on Stellar Lumens
and Stellar Lumens will go up.
The price is testing the major resistance, so now I go 5x long and the bullish breakout will start. And Stellar Lumens will go up. See you up there