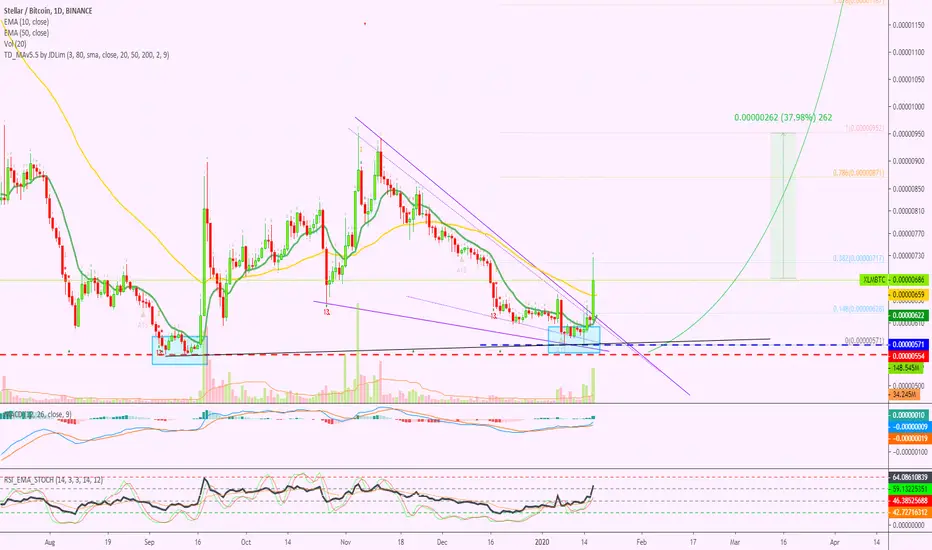
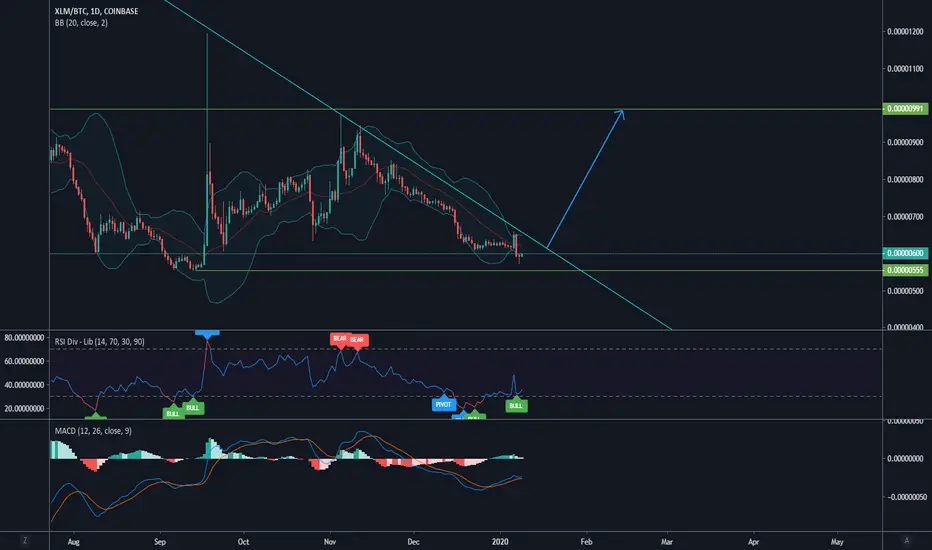
Stellar Lumens Looking Better, High Volume, Easy Target MappedStellar (XLMBTC) is looking better now as a strong bounce is taking place and good volume is starting to show up.
I can see the same signals we are seeing in most of the altcoins that are starting to move... Let's take another quick look at those:
1) Higher low (light blue).
2) Increasing volume.
3) Break above EMA10.
4) Strong RSI with MACD trending up.
5) Most of the people are still clueless about the incredible bullish action that will permeate the entire cryptocurrency markets... especially the small altcoins.
We have more signals and tools that we can use for charting and trading, but the ones above are more than enough for us to say that Stellar Lumens completed its retrace, now it is time to resume its uptrend.
Namaste.
Xlmbtc
$XLM, Flipping into support ~620sats level and pushing up..$XLM
Flipping into support ~620sats level and pushing up with some volume...
UCTS Buy signal flashing on the 1D
RSI bullish divergence..
If it gets traction from here (Volume mostly) then next target should be at ~700 sats (12%+).
#XLM

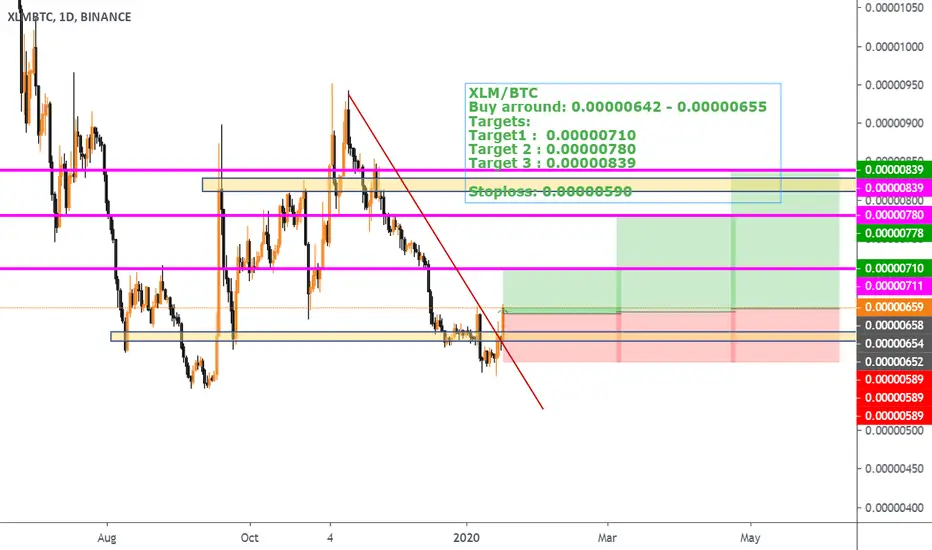
XLM breakout - Good entry from hereXLM/BTC
Exchange: Binance
Buy arround: 0.00000642 - 0.00000655
Targets:
Target1 : 0.00000710
Target 2 : 0.00000780
Target 3 : 0.00000839
Stoploss: 0.00000590
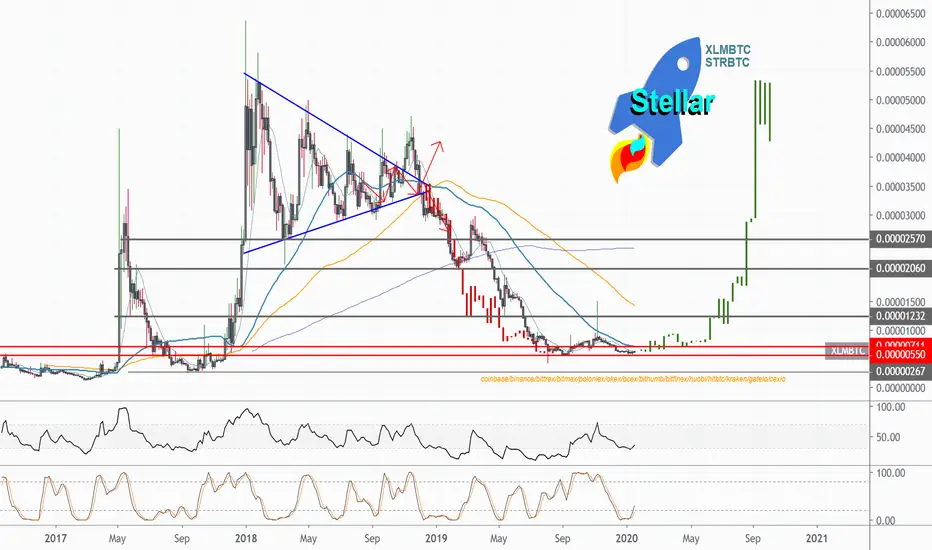
XLMBTC Brokeout Resistance bull Is comming>??XLMBTC now looking Good.
Very long resistance line breakout upward side and now we can see some uptrend.
now current price is 640 Satoshi.
if price hold above this trend line then we can expect 30%-70% profit.
entry: 620-640 Satoshi.
Targets: 870/988/1233 Satoshi.
Check chart and learn and earn with your good Strategy .
Like share and follow.

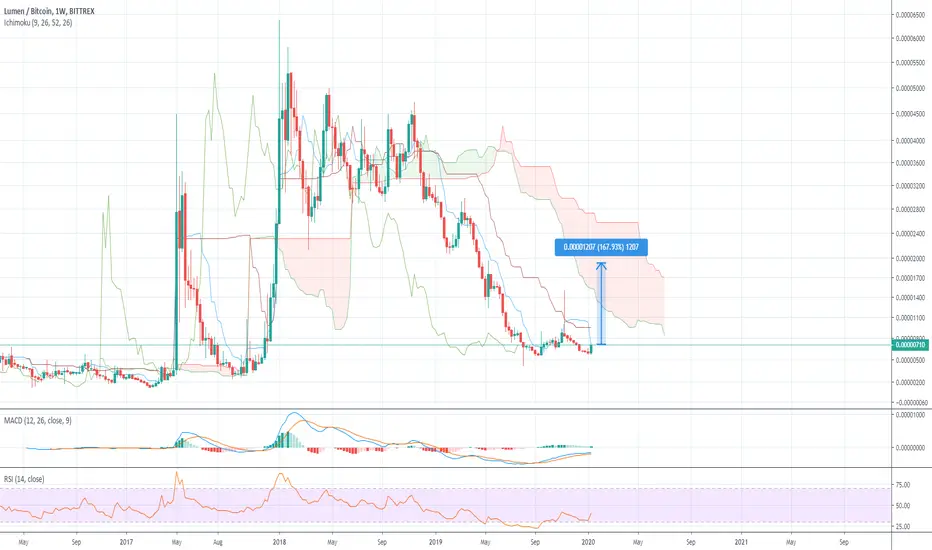
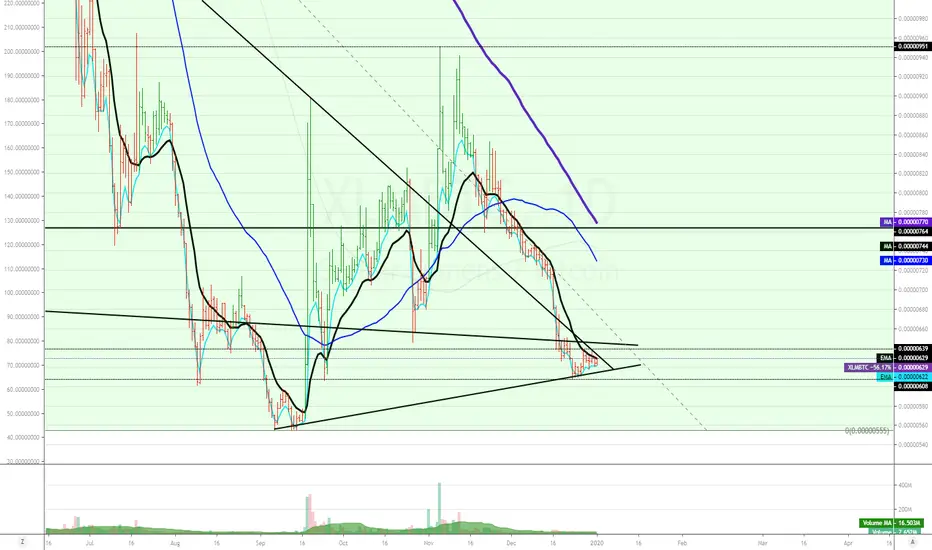
XLM/BTC, Bullish Butterfly (Monthly chart)Seems like there maybe a bit further bleeding even though I'm hoping XLM has one of those DASH pumps that we just had which I got a good amount out of. XLM/BTC looks bullish to me longterm once zoomed out and looking at the monthly having nearly completed this harmonic and the stoch rsi just waiting to cross bullish.
@moon333 here on TV posted a monthly chart as well but that doesn't look too accurate to me, although he has more experience and could be right. However this is the way I am seeing it. I did buy some at current levels for the longterm (unless we get a DASH like pump and then I will sell to book profit and rebuy lower).

XLMI am buying here expecting a break out of this falling wedge as XLM is slow and has yet to break out as of yet unlike the other alt coins which have already moved above the 200 ema D1 and broke out of the wedge already .

STELLER Daily breakout and Resistance | Trade IdeaBuy : 600 - 625
Stop : 7%
Target : 5% to 20%
1 ) Daily breakout
Daily RSI
2) price taking support at 12 ema .
3) 4 hour chart 21ema - 50 ema cross and 100 ema resistance closing above needed
overall loooks good for long


XLMBTC Daily Chartlets see what happens, crypto is very crazy and right now bitcoin just looks weird IMHO


XLM building to make 200%+ movement soonWavetrend and Volume oscilator indicators seem to be lining up to retrace back to the Major resistance 2 line. This may happen once XLM breaks Major resistance 1 line.
This isn't trading advice, just documenting and learning ideas.
Any feedback is appreciated.

Stellar Lumen-XLMBTC-
The situation is not so bad.
-XLMUSD-
It has entered the long-term downtrend line.
Something worried happened.
-----------------------
Unlike other coins, XLM has kept prices near the XLMBTC's high point by around November 2018.
In 2019, it fell sharply.
I think more time is needed for XLM to rise.
Think about it and think carefully about your investment.

$XLM/BTC Falling Wedge pattern - bullish break out expectedOn the short-term XLM/BTC chart there is a Falling Wedge pattern.
But price can go in both directions considering current market sentiment.
Thorough XLM/USD and XLM/BTC analysis here .
Do not forget to use stop-loss.
Trade carefully and good luck!
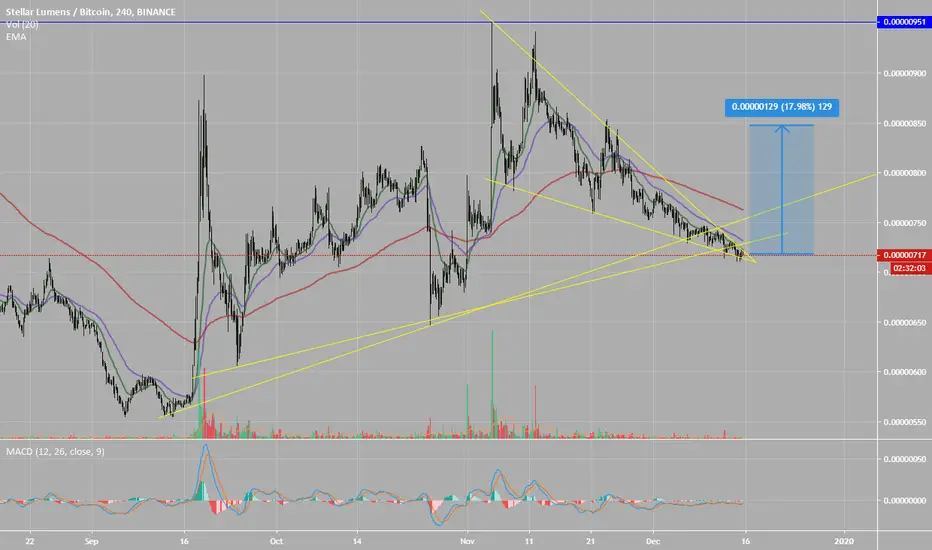
Stellar Lumens - 4H Trade IdeaDue to popular demand, this is a zoomed in version of my last Stellar post about the imminent breakout of altcoins and the topping of bitcoin dominance.
The move up to 898 sats was held by a historically known resistance level. From there since it didn't break out, the move failed and found the lowest support it could at 685 sats.
Entry at the Support @ 685 sats
(Anything below 755 sats is a GREAT buy)
Short-Term Target SELL @ 898 sats for a 32% gain
Long-Term Target SELL @ 1250 sats for a 64% gain
History repeats itself on all of these altcoin charts, let alone bitcoin. It really is the start of altcoin season and I could make a chart on every single altcoin, they ALL look the same..
As always please do your own research, I am not a financial advisor.

Stellar Lumen ($XLM) - trend analysisXLM/USD is still in the downtrend however price reaching major historical support level.
For sure it a great place to accumulate some $XLM.
There are at least several things that we need to see on the chart to be sure that reversal is happening:
1. Price has to break bold yellow resistance line;
2. Price has to start making lower highs and higher highs on daily chart;
3. Price has to surpass 0.1$ first but minor psychological level
If current support level will not hold we may see price going to 0.03$ but it's unlikely in my opinion.
In any case 2 year cycle is coming to an end and we will witness a start of new uptrend cycle in the upcoming year.
Here is my XLM/BTC chart:
Trade carefully and good luck!

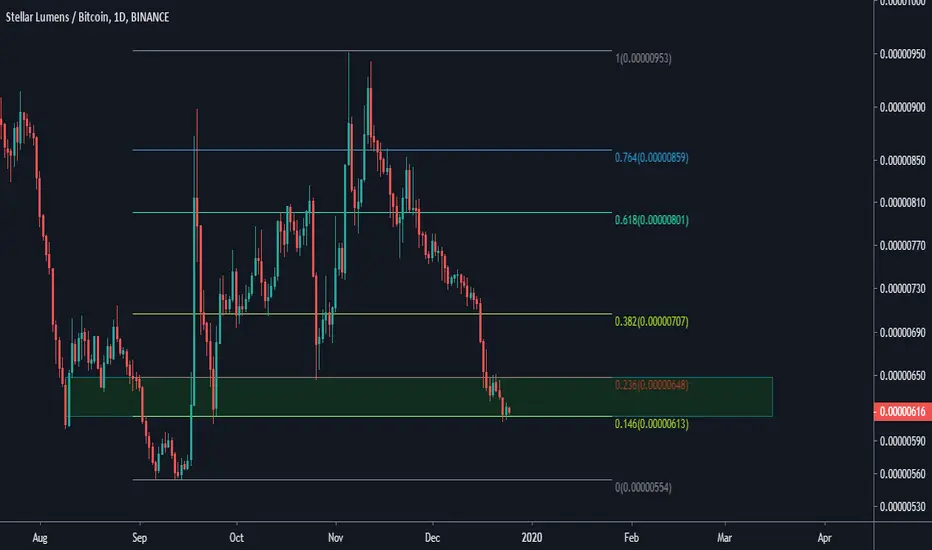
XLM/BTC TA Update (Bounce at Gold Fib?)XLM/BTC
XLM broke the upward trend-line support and now on a deep pullback targeting the 0.618 Fib support area.
Swing higher low tends to be a strong area for the price to react plus in a combination of the golden Fib.
I expect buyers to temporarily step in and their stop loss would be just below swing Low at 644 sats or lower.

