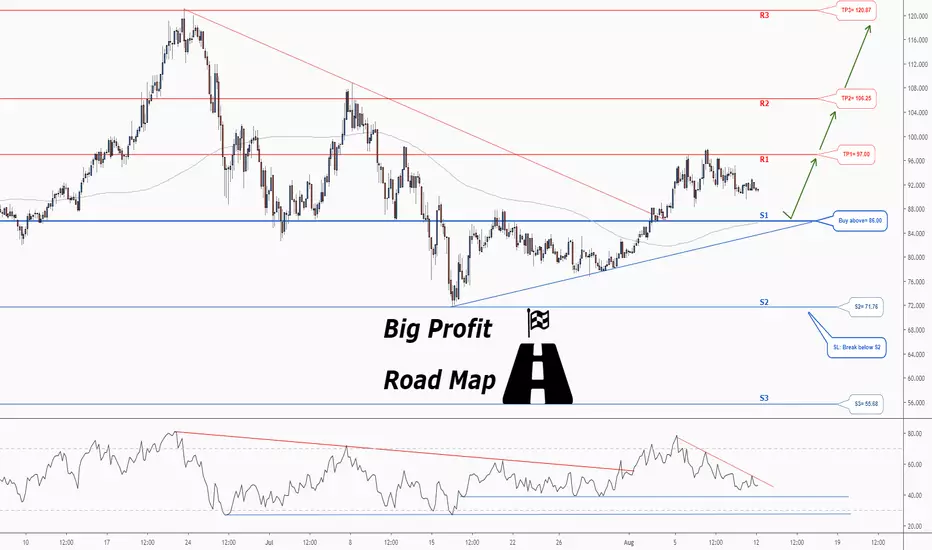
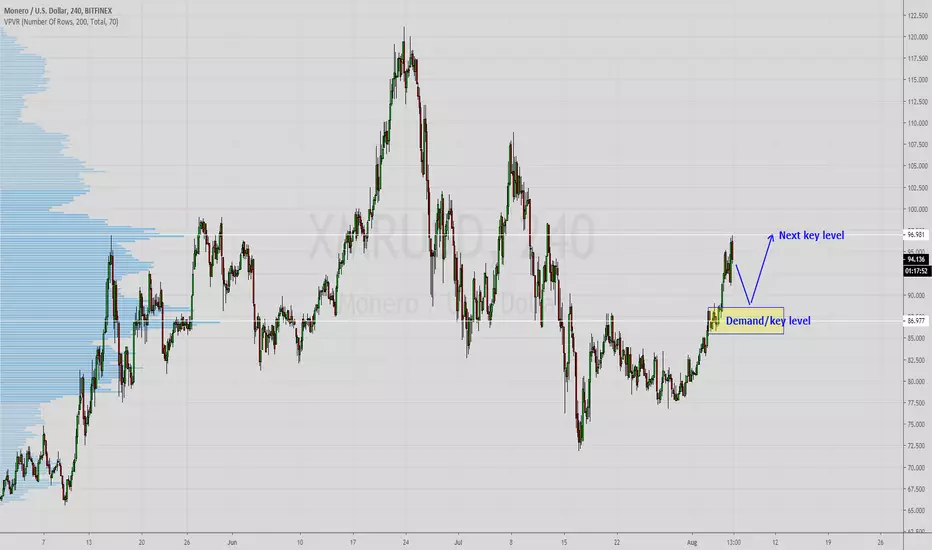
Don't miss the great buy opportunity in MONEROTrading suggestion:
. There is a possibility of temporary retracement to suggested support line (86.00). if so, traders can set orders based on Price Action and expect to reach short-term targets.
Technical analysis:
. XMRUSD is in a range bound and the beginning of uptrend is expected.
.The price is above the 21-Day WEMA which acts as a dynamic support.
. The RSI is at 45.
Take Profits:
TP1= @ 97.00
TP2= @ 106.25
TP3= @ 120.87
SL= Break below S2
Xmrusd
Don't miss the great buy opportunity in MONEROTrading suggestion:
. There is a possibility of temporary retracement to suggested support line (86.00). if so, traders can set orders based on Price Action and expect to reach short-term targets.
Technical analysis:
. XMRUSD is in a range bound and the beginning of uptrend is expected.
.The price is above the 21-Day WEMA which acts as a dynamic support.
. The RSI is at 45.
Take Profits:
TP1= @ 97.00
TP2= @ 106.25
TP3= @ 120.87
SL= Break below S2

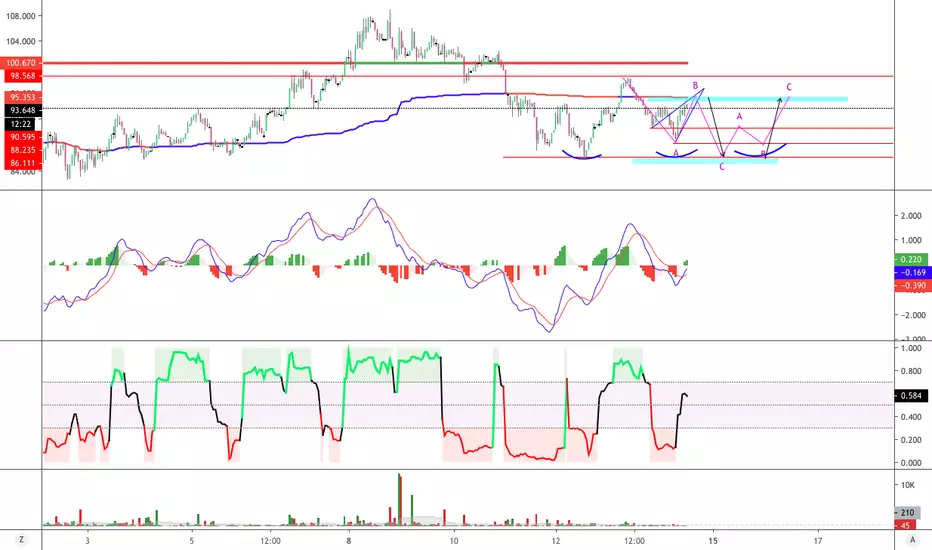
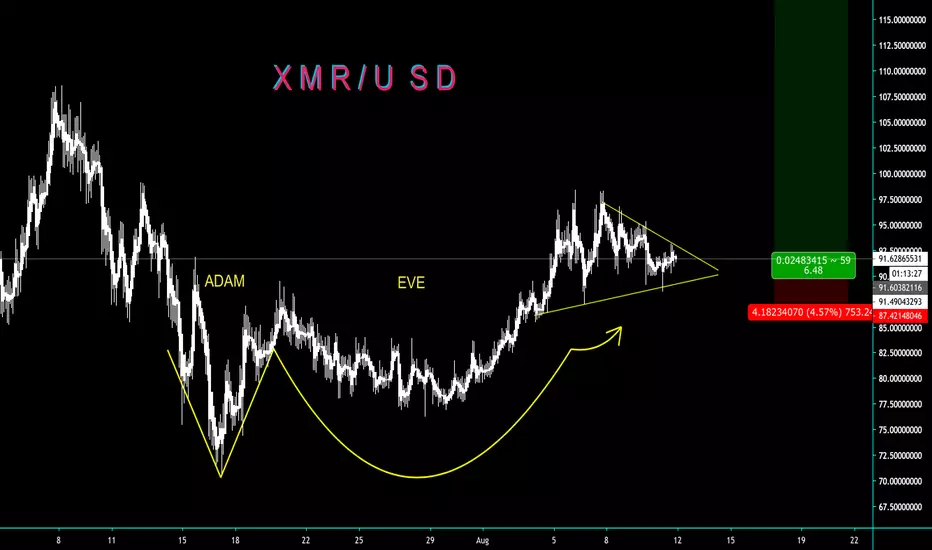
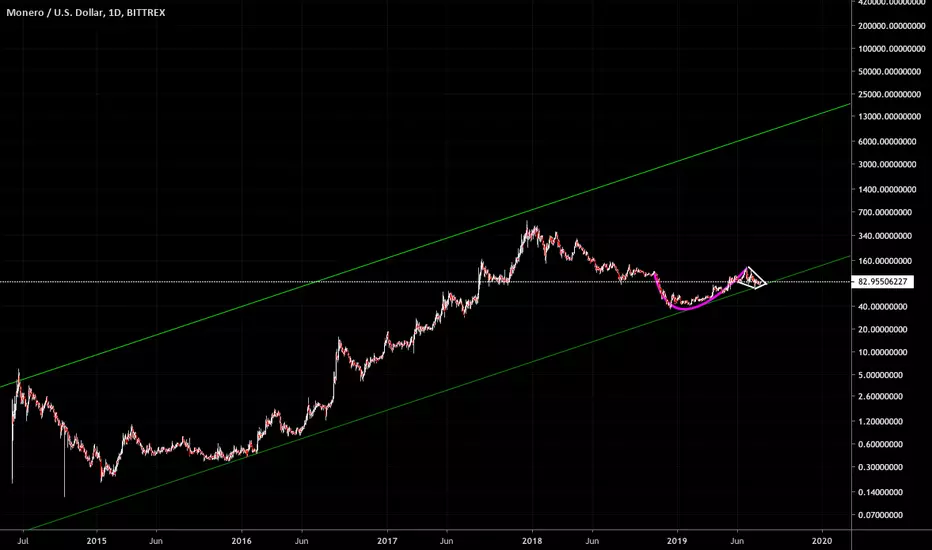
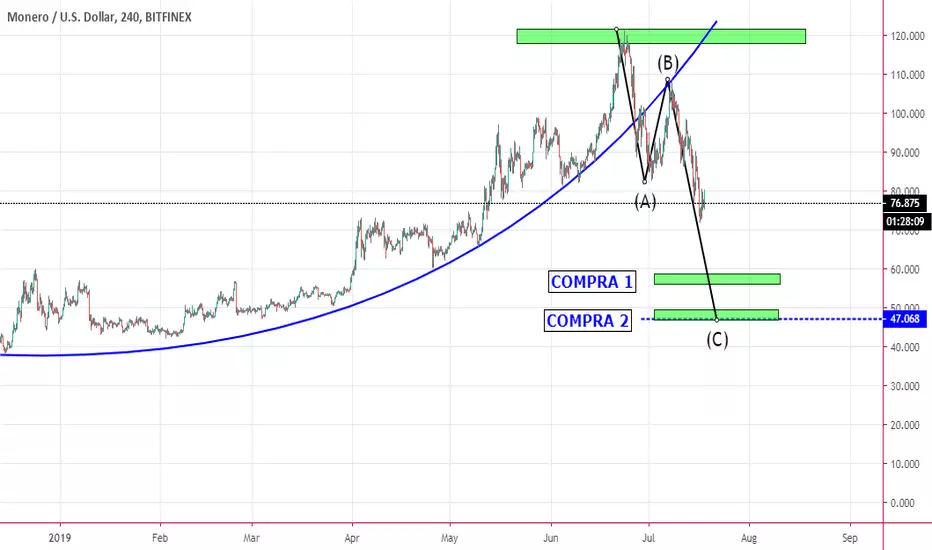
XMR - ADAM & EVE PATTERN READY TO EXPLODE - CryptoManiac101XMR / USD TA
ADAM & EVE pattern is looking ready to explode in coming weeks. Take at leas 5% Risk to 29% + reward
XMR schiff-pitchfork, break up into the median channelThis is my first foray into charting (be gentle)...;)
Looks like the price action is aligning well with the channels above, has just droppped out slightly from the median channel, only on low volume
I would expect it to hover here for the next day or two and then maybe break to the upside, needs good volume to overcome a confluent resistance at $95, but the overall trend should support such a move.
As this is my first use of charting and Schiff Pitchfork, if I have made any errors please let me know...here to learn and feedback is welcomed.
TIA


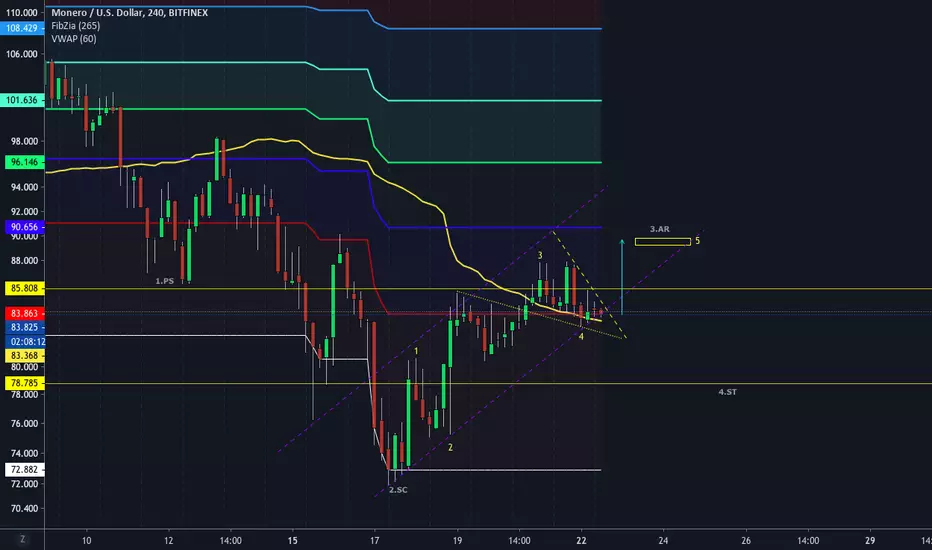
XMRUSD Market Structure Analysisif you have your market view, please share it in comments
Also, you can ask me questions...
Have a great day everyone!


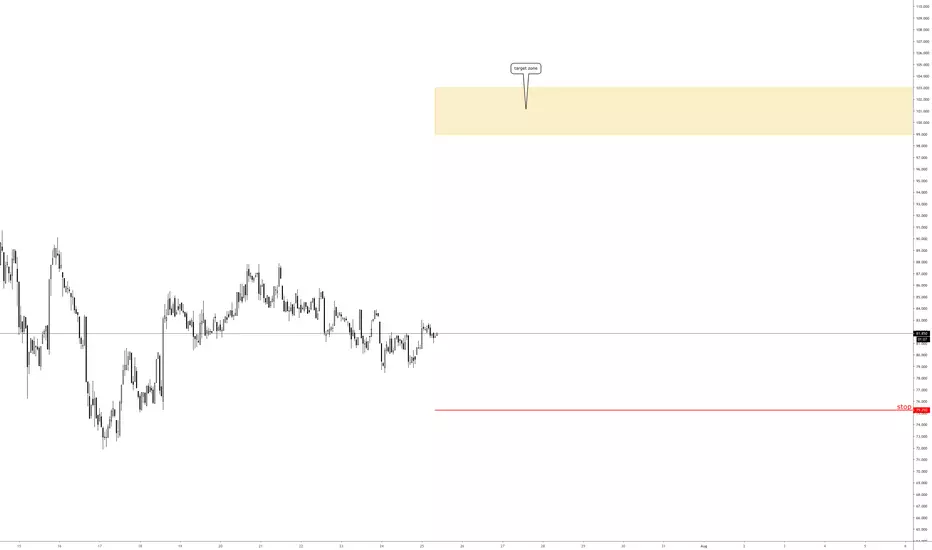
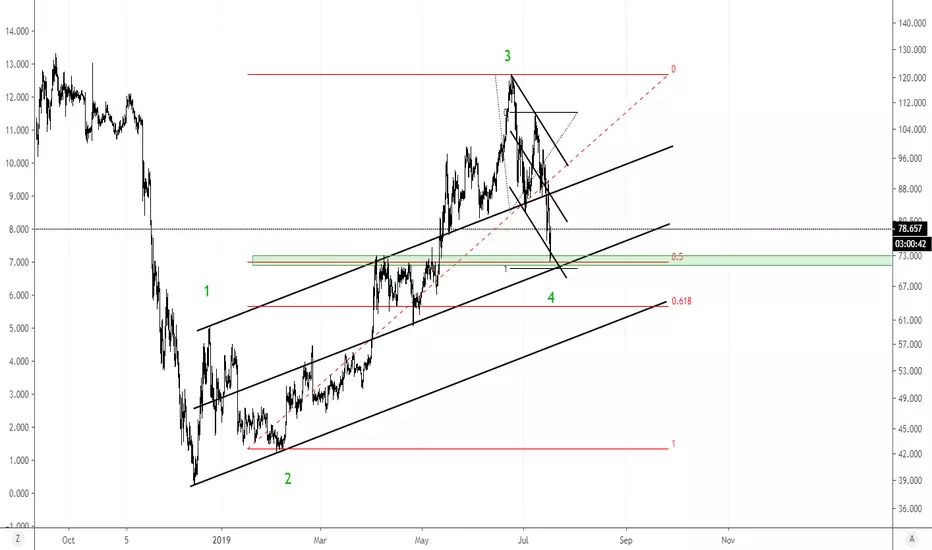
XMRUSD - 114 SoonA star on a rise, with great potential if Bitcoin breaksup que channel.
I see it on 114 in 5-7 days


Monero: Wave 3 of am Elliott Wave Structure of a lesser degreeMonero: Wave 3 of am Elliott Wave Structure of a lesser degree

Why Monero is more clear than the rest of the marketDoesn't mean it's not going to tank if BTC drops, but this setup is clean enough to justify a long position.

Monero (XMRUSD) long.All description on the chart.
Please, don't forget to like and follow.
Thank you.
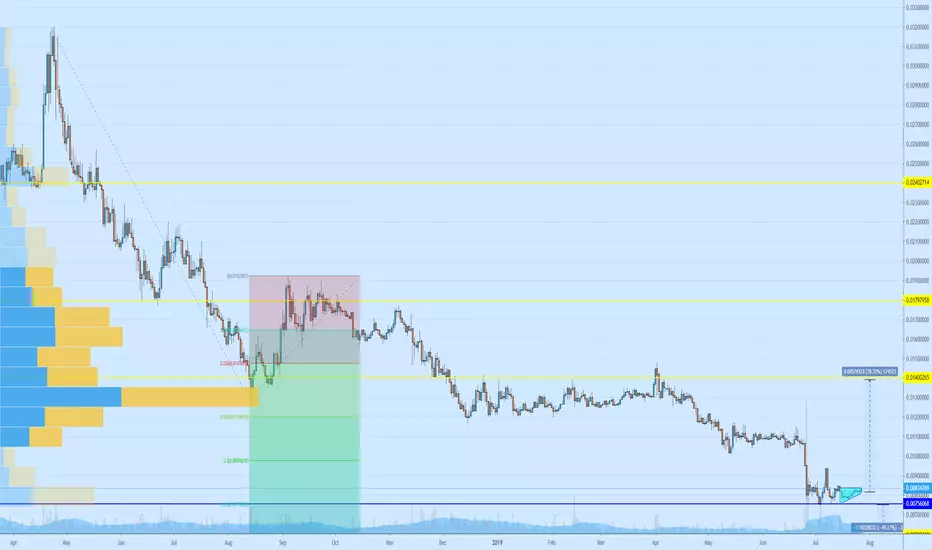
ZONAS DONDE COMPRARE XMRPOR EL MOMENTO MANTENGO UNA POSICION EN SHORT EN ESTA MONEDA Y DONDE MARCO LOS CUADROS SERAN LAS ZONAS DONDE COMPRARE
XMR looks good as long as it holds this supportholidays with no internet for 5 days and you guys dump the market 40%, that's not cool. Back on internet but no mouse. Quick look at $XMR which looks good if it doesn't go any lower than that. Still on holidays until monday. Will look at the rest later
Monero Price Analysis XMR / USD: Power StruggleMonero / USD Short-term price analysis
Monero has a bearish short-term outlook, with the cryptocurrency tumbling to its lowest trading level since May 2019.
The four-hour time frame shows that a major bearish breakout has now occurred, with XRM/USD bears triggering a head and shoulders pattern into action.
Technical indicators are bearish on the four-hour time frame and continue to issue sell signals.
Pattern Watch
Traders should note that the bearish pattern has a downside projection of around $37.00.
Relative Strength Index
The RSI indicator is also bearish on the four-hour time frame, although it is attempting to correct from oversold territory.
MACD Indicator
The MACD indicator has turned bearish on the four-hour time frame and continues to generate a sell signal.
Monero / USD Medium-term price analysis
Monero retains its bullish medium-term outlook, with the cryptocurrency still trading above its trend defining 200-day moving average.
The daily time frame is showing that a sizeable head and shoulders pattern is also in play, with the $43.00 level the overall target of the bearish pattern.
Technical indicators on the daily time frame are bearish and continue to issue a strong sell signal.
XMR / USD Daily Chart by TradingView
Pattern Watch
Traders should note that an inverted head and shoulders pattern is still present on the daily time frame. The overall downside projection of the bearish pattern currently in play would fail to invalidate the larger bullish pattern.
Relative Strength Index
The RSI indicator has turned bearish on the daily time frame and is now issuing a strong sell signal.
MACD Indicator
The MACD Indicator on the daily time frame is bearish and is currently generating a sell signal.
Conclusion
Monero could start to come under increasing technical selling pressure as the bearish head and shoulders pattern across both time frames unfolds.
The key development to watch will be how far the downside in the XMR / USD pair extends and if bears can invalidate the huge bullish pattern on the daily time frame.

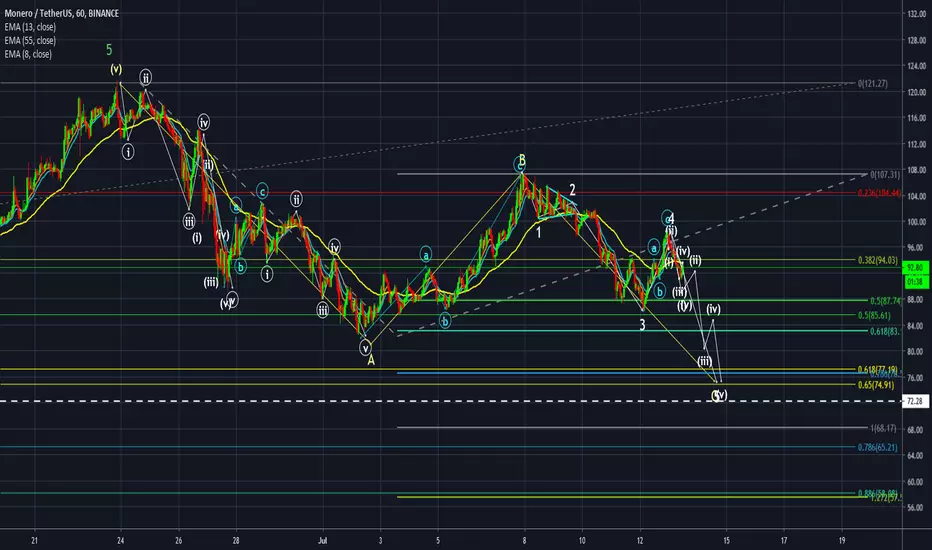
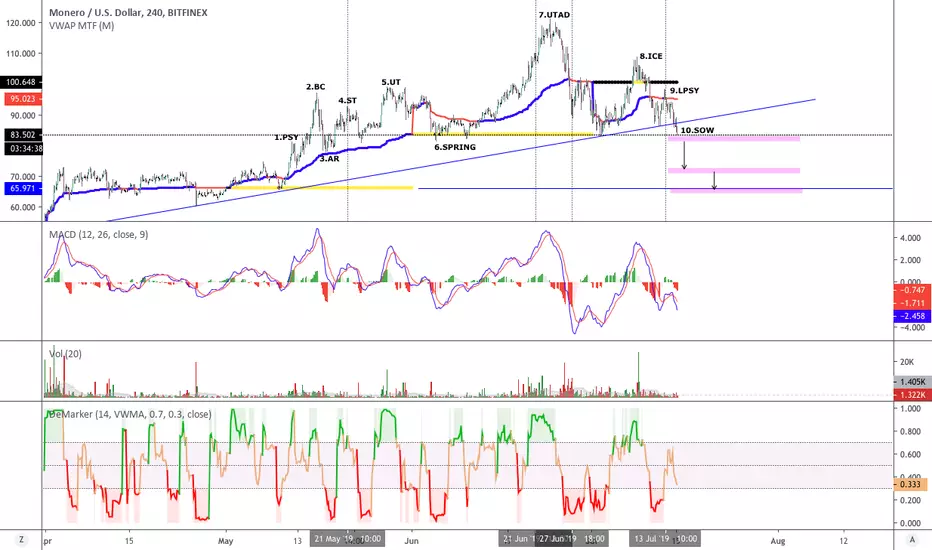
Monero (Binance) - Wave C will be finished soon. Be ready to buyAs you can see, we are doing my favorite 3-3-5 correction. C could end at the exact Golden Ratio of Entire 1-5 impulse waves structure. = 75-77 USD. Count waves and watch indicators for konvergence between waves (iii) and (v) of C.