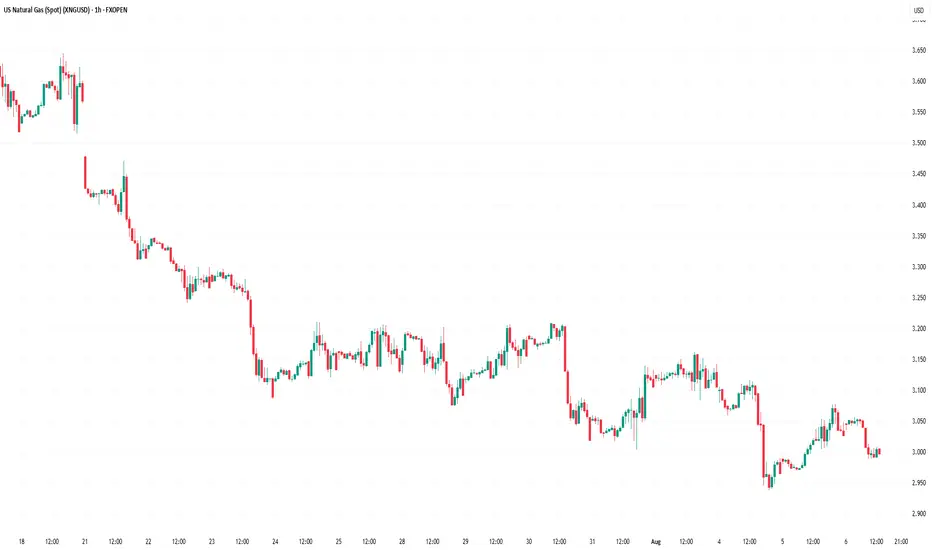
Natural Gas Prices Fall to Yearly LowNatural Gas Prices Fall to Yearly Low
Analysing the chart on 22 July, we constructed a descending channel and assumed that natural gas prices would continue to form a bearish market structure of lower highs and lower lows. Since then, the market has declined by almost 10%.
As the XNG/USD chart shows today, natural gas prices are hovering around the psychological level of $3.000/MMBtu. Earlier this week, gas was trading around $2.940/MMBtu — the lowest level of 2025.
According to media reports, the price decline is driven by both high production levels and favourable weather forecasts for August, the hottest month of the year. What might happen next?
Technical Analysis of the XNG/USD Chart
We have updated the descending channel, taking into account the recent fluctuations in natural gas prices.
The chart shows that bearish momentum remains intact — the rise from point B to C appears to be a corrective rebound within the prevailing downward trend, with the following developments:
→ point C formed in the 0.5–0.618 area, which corresponds to classic Fibonacci retracement levels following the A→B impulse;
→ the former support at 0.365 has now become resistance.
Bulls may hope that the current sentiment could shift following tomorrow’s natural gas storage report (scheduled for 17:30 GMT+3). A drop in inventories could potentially trigger a bullish impulse on the XNG/USD chart.
This article represents the opinion of the Companies operating under the FXOpen brand only. It is not to be construed as an offer, solicitation, or recommendation with respect to products and services provided by the Companies operating under the FXOpen brand, nor is it to be considered financial advice.
Xngusd
Supply surplus pressure XNG price despite demand increaseFundamental:
Natural gas (XNGUSD) continued its decline, driven by high storage levels and surplus supply. Despite a 6.8% increase in demand for the week ending 30 Jul, the daily average supply surplus remained at 3.6 bln cubic feet, boosting underground working storage capacity to near the five-year average high. The persistent supply surplus could exert further downward pressure on natural gas prices.
Technical:
The price remains within the descending channel. Unless broken decisively, trend favors lower prices.
If the RSI hits oversold and the price breaks $2.91, the next target could be testing the long-term support at $1.85.
Reversal would require a break and close above the descending channel and above clustered EMAs, ideally crossing $3.07 (EMA50) and $3.16 (EMA100).
MACD bullish cross with RSI rising above 50 would confirm a potential upward momentum.
Price may oscillate between current support ($2.91) and resistance ($3.16-$3.30) if volume and volatility remain low, consolidating before the next major move.

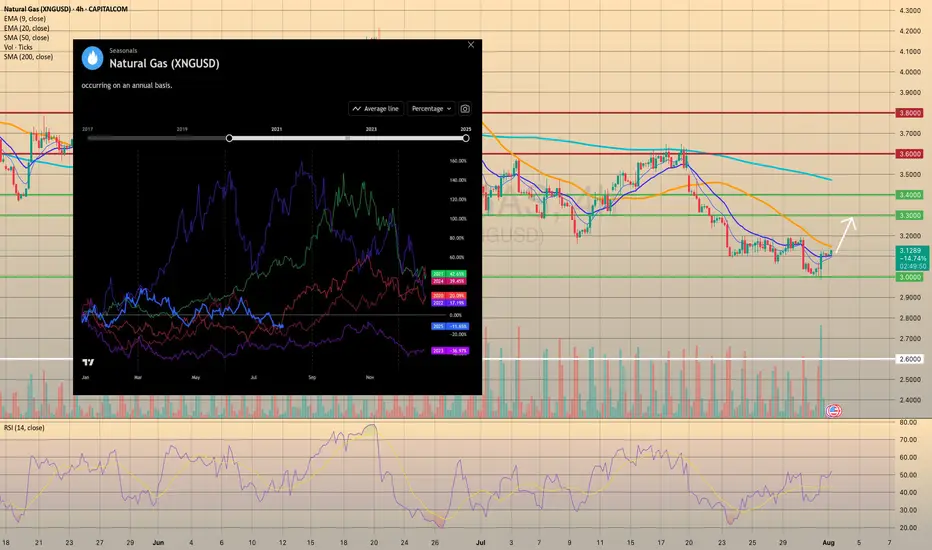
U.S. NATURAL GAS SUCCESSFULLY REBOUNDED FROM FIRM SUPPORT.U.S. NATURAL GAS SUCCESSFULLY REBOUNDED FROM FIRM SUPPORT.
Yesterday the natural gas storage report came out higher than expected. U.S. natural gas inventories increased by 48 billion cubic feet last week to 3,123 Bcf, increasing the surplus over the five-year average to 195 Bcf from 171 Bcf the week before, the EIA reports. The storage increase was bigger than the 24 Bcf average for the week, and above the 36 Bcf estimate. However, the price rised on 2.35% afterwards, supported by increased volume, which indicates the strength of the level. The upward movement towards the 3.3000 level is highly expected.
Additionally, seasonals suggest us that current prices may become the lowest till the end of the year. Historically, since August the natural gas prices increase in anticipation of a new heating season and higher energy demand (pic2).
XNGUSD CONTINUES ITS DOWNWARD TREND. FOR HOW LONG?XNGUSD CONTINUES ITS DOWNWARD TREND. FOR HOW LONG?
Recent bearish impulse started at the beginning of this week may come to an end soon. Yesterday the U.S. Natural Gas Storage report came out. Numbers appeared to be lower than expected and lower than previous. (23b vs 28b vs 46b). This is bullish signal for the market participants. Minutes after the report came out, market reacted bullish, however, soon price went sideways.
Right now gas prices continue to decline. Still, the opportunity for short-sellers here is quite limited. Not so far below there is a level of 3.0000, form where I expect the price to rebound, supposedly to a 3.3000.
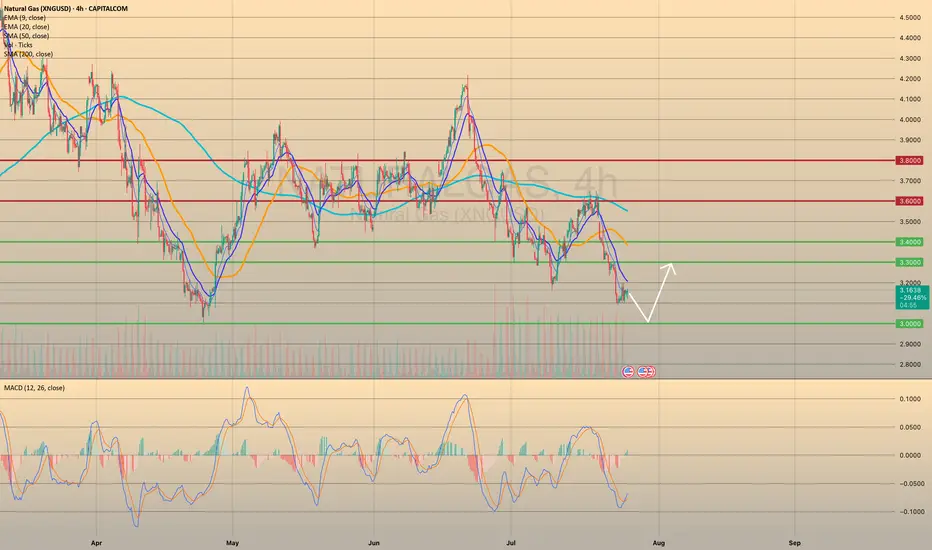
NATURAL GAS REACHED THE KEY SUPPORT LEVEL. WHERE TO GO NEXT?NATURAL GAS REACHED THE KEY SUPPORT LEVEL. WHERE TO GO NEXT?
XNGUSD has come to a crucial support level of 3.0000. Although the sentiment here stays as quite bearish (seasonally, August is not the perfect month for natgas buyers), we expect the price to rebound from the level of 3.0000 towards 3.3000 first. Afterwards, the continuation of bearish trend is expected with final target of 2.6000 before cold season beginning.
"NATURAL GAS PRICE THEFT IN PROGRESS – JOIN THE HEIST!"🔥 XNG/USD HEIST – BEARISH LOOT AWAITS! SWIPE & ESCAPE BEFORE THE COPS ARRIVE! 🔥
🌍 Greetings, Fellow Market Robbers! (Hola! Oi! Bonjour! Hallo! Marhaba!) 🚔💸
🚨 Mission Briefing:
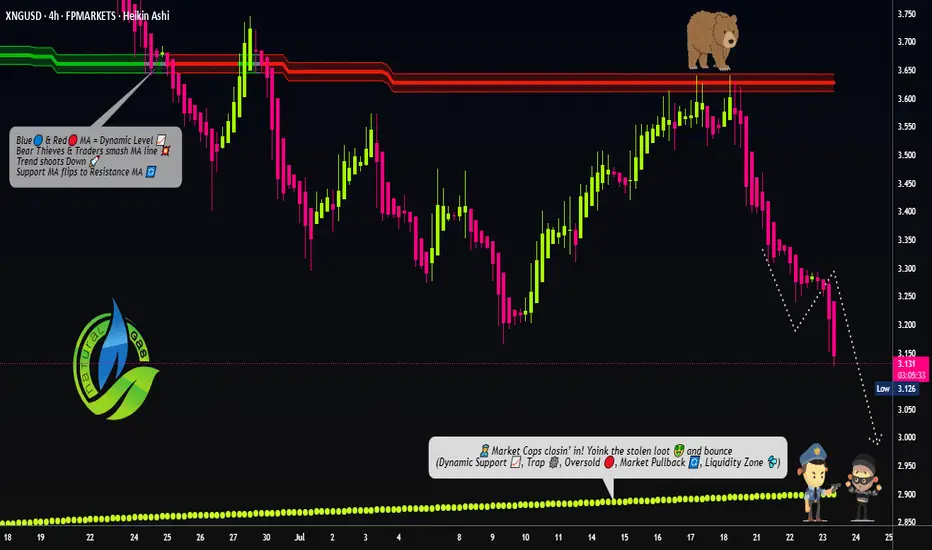
Based on 🔥Thief Trading Intelligence™🔥, we’ve identified a prime robbery opportunity in the XNG/USD (Natural Gas) Energy Market. Our Bearish Heist Plan is locked & loaded—long entries are a trap, and the real loot lies in the downside escape.
🎯 Heist Strategy:
Entry (Swipe the Loot!) 🏦
"The vault is cracked! Bears are distracted—time to steal!"
Sell Limit Orders preferred (15m-30m pullback entries).
DCA/Layering Strategy for maximum loot efficiency.
Stop Loss (Escape Route) 🚨
SL at nearest swing high (4H basis) – 3.480 (Day/Swing Trade)
Adjust based on risk tolerance, lot size, & number of orders.
Target (Police Evasion Zone) 🎯 2.900 (or earlier if cops close in!)
🔪 Scalpers’ Quick Heist:
Short-side scalp ONLY!
Big money? Go direct. Small stack? Join the swing robbers.
Trailing SL = Your Getaway Car! 🚗💨
⚡ Why This Heist? (Bearish Forces at Play)
Fundamentals: Oversupply, weak demand, storage glut.
Technicals: Overbought, trend exhaustion, reversal signals.
Sentiment: Bulls are overconfident—perfect trap setup!
📰 Breaking News Alert (Stay Sharp!)
High-impact news = Volatility spikes!
Avoid new trades during releases.
Trailing SL = Your Shield. (Lock profits before the cops raid!)
💥 BOOST THIS HEIST!
👉 Hit LIKE & FOLLOW to fuel our next robbery! More loot = More strategies! 🚀💰
⚠️ WARNING (Legal Escape Plan):
Not financial advice!
Your risk, your loot.
Markets change—adapt or get caught!
🤑 NEXT HEIST COMING SOON… STAY TUNED, ROBBERS! 🐱👤🔥
XNGUSD Technical Update – What the Chart Is Telling Us NowIn this video, I break down the current XNGUSD (Natural Gas) chart using pure price action analysis on the daily timeframe.
This update builds on my previous post, where I shared a comprehensive outlook supported by fundamentals, including supply/demand imbalances, geopolitical risks, and long-term LNG export growth.
In this video, I focus purely on the technical picture—highlighting key levels, market structure, recent consolidation, and where I see potential opportunities unfolding next.
📈 If you're trading or investing in Natural Gas, this is a must-watch update to stay in tune with the current market dynamics.
Remember: This is not financial advice. Always do your own research and manage risk appropriately.

XNGUSD PULLED BACK FROM 3.3000 RESISTANCE LEVEL. WHERE TO GO NEXXNGUSD PULLED BACK FROM 3.3000 RESISTANCE LEVEL. WHERE TO GO NEXT?
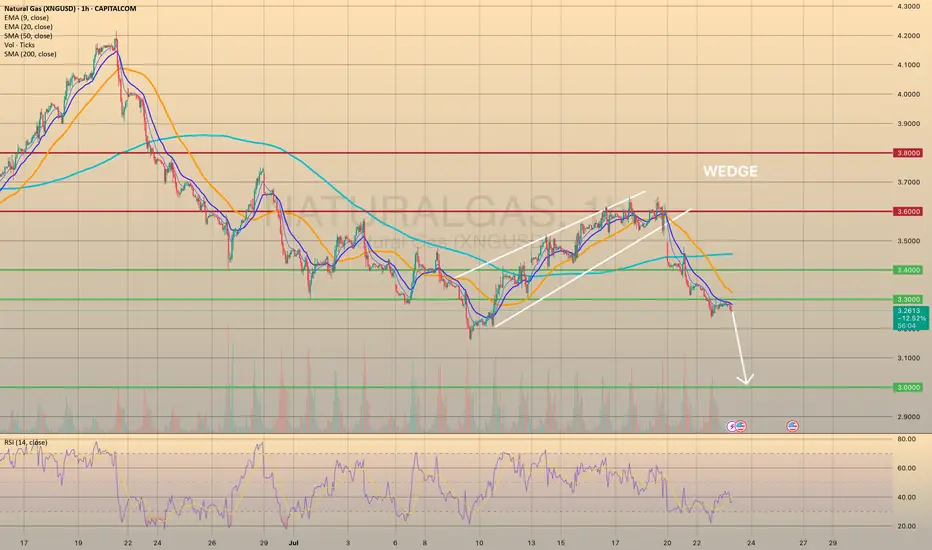
This Monday natural gas prices have successfully broken down bearish wedge formation. As we may observe, the price went down through all major support levels, establishing a new short-term bearish trend. Recently the price broke through the 3.3000 and successfully retested it. It is crucial, due to this level is the last mid-term major support before the 3.000.
Additionally, the weather in the vast area U.S. is supposed to be milder at the end of July - beginning of August, which would curb nat-gas demand from electricity providers for air conditioning usage. To sum up, the decline towards 3.000 level is expected.
The Great Gas Heist: Load Your Longs Before It Blows💎🚨“Operation Gas Vault: NG1! Breakout Robbery Blueprint”🚨💎
🌟Hi! Hola! Ola! Bonjour! Hallo! Marhaba!🌟
Welcome to all my Market Hustlers & Silent Robbers 🕵️♂️💼💰
Today’s target: NG1! Henry Hub Natural Gas Futures
📍Strategy: A bullish heist mission with a calculated escape plan.
🔥Thief Trading Blueprint: Gas Market Heist🔥
🎯 Entry Gameplan
“The vault cracks open at 3.630 – That’s your cue.”
Wait for resistance breakout 🧱 (around 3.630) – that’s the signal.
Set Buy Stop orders above the Moving Average.
Or, use a layered DCA entry via Limit Orders near swing highs/lows (15m or 30m timeframe).
Thief Tip: Set an alert/alarm so you don’t miss the breakout bang 🔔💥
🛡 Stop Loss Setup (Post-Breakout Only!)
“Don’t be reckless. No SL before breakout — wait for confirmation.”
SL Location: Swing low (4H) near 3.370.
Set SL after breakout happens, not before.
Adjust based on your risk tolerance, lot size & number of open entries.
⚠️ Placing early SL = triggering the trap before the door opens.
🏴☠️ Loot Target 🎯
Take Profit Zone: 4.100
Escape Tip: No need to be greedy. Take profit before the police arrive (resistance)!
🧲 Scalper’s Shortcut
Only go Long – avoid fighting the current.
If you’ve got cash flow, strike early. If not, ride with the swing crew.
Use trailing SL to protect your stack 💼📉
📊 Fundamental Clues Behind the Heist
The gas vault is heating up thanks to:
🔥COT Reports
🛢 Inventory & Storage data
📈 Seasonal trends
💹 Sentiment flows
⚖ Intermarket linkages
Checkk your own global indicators 🌍🔗 – don’t enter blindfolded.
🗞️ News Traps & Position Protection
Avoid new entries during major news releases 📰🚫
Trail stops to guard running positions
Markets react fast. Adapt even faster.
⚠️ Disclaimer: This is educational info, not personal investment advice. Your money, your risk, your decisions.
💥 Support the Robbery Squad 💥
If you vibe with the Thief Trading Style, smash that Boost Button 💖
Grow the gang, expand the vaults, and master this money maze together! 🤑🏆🚀
Stay tuned – another heist plan is on the way.
Until then, trade smart, trade sharp. 👊🕶💼
🔒#NaturalGas #ThiefTrading #BreakoutStrategy #SwingTrade #FuturesHeist #NG1Plan #RobTheMarket

Natural Gas Price Drops by 7%Natural Gas Price Drops by 7%
As the XNG/USD chart shows today, natural gas is trading around $3.333/MMBtu, although yesterday morning the price was approximately 7% higher.
According to Reuters, the decline in gas prices is driven by:
→ Record-high production levels. LSEG reported that average gas output in the Lower 48 rose to 107.2 billion cubic feet per day so far in July, surpassing the previous monthly record of 106.4 billion cubic feet per day set in June.
→ Favourable weather forecasts. Although the peak of summer heat is still anticipated, forecasts indicate that temperatures over the next two weeks may be lower than previously expected.
As a result, today’s XNG/USD chart appears bearish.
Technical Analysis of the XNG/USD Chart
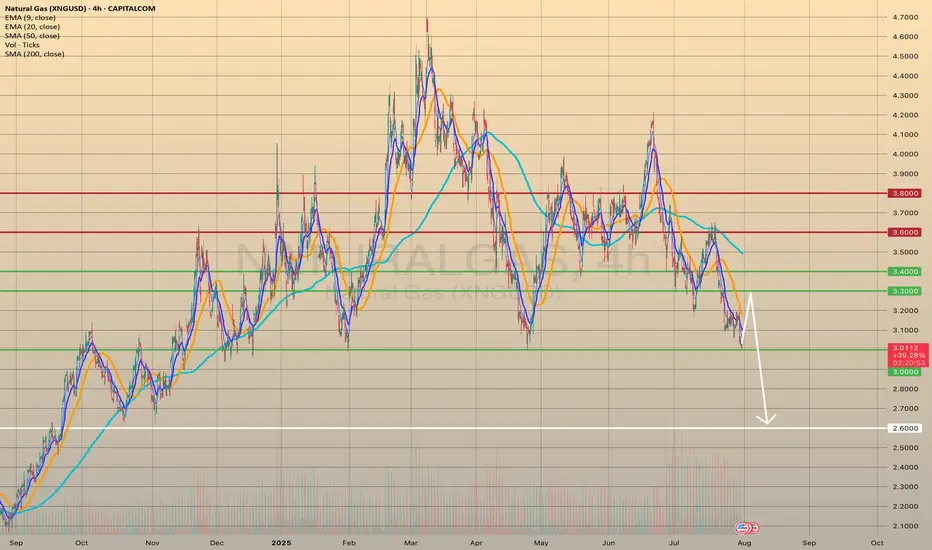
The chart indicates that since mid-May, natural gas prices have been fluctuating within a descending channel (marked in red), with July’s peak (E) highlighting the upper boundary of the pattern.
A key resistance area is now represented by a bearish gap, formed between:
→ the former support level at $3.525;
→ the $3.470 level – which, as the arrow suggests, is already showing signs of acting as resistance.
Under these conditions, it is reasonable to assume that the price may continue forming a downward market structure A-B-C-D-E, consisting of lower highs and lows, potentially moving towards the channel’s median – which approximately corresponds to July’s low (around the $3.200 level).
This article represents the opinion of the Companies operating under the FXOpen brand only. It is not to be construed as an offer, solicitation, or recommendation with respect to products and services provided by the Companies operating under the FXOpen brand, nor is it to be considered financial advice.

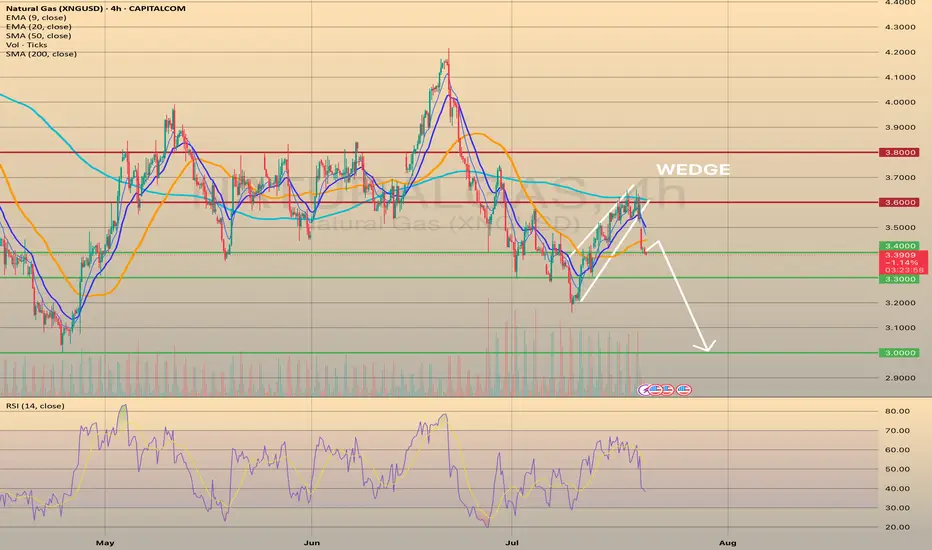
U.S. NATURAL GAS - BEARISH WEDGE WORKED OUT. WHAT'S NEXT?U.S. NATURAL GAS - BEARISH WEDGE WORKED OUT. WHAT'S NEXT?
Today, the market opened 2.66% below its closing price on Friday. The current price has already fallen on 4.8% since the closing on Friday, and it is now above the 3.400 support level. I expect further decline, however, with a possible rebound from the current level and pullback towards the SMA50, with a final target of 3.000.
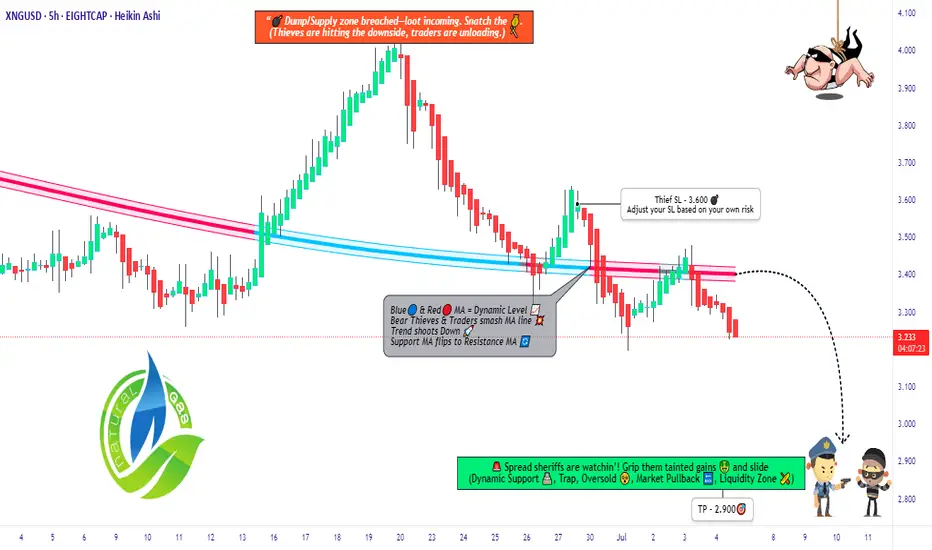
Operation Gas Leak: Bearish Swing in XNG/USD🧨XNG/USD Energy Vault Playbook: Natural Gas Power Grab!⚡💸
🌟Hi! Hola! Ola! Bonjour! Hallo! Marhaba!🌟
Dear Market Raiders & Strategy Hustlers 🕵️♂️📊💼
Welcome to the 🔥Thief Trader Energy Strategy🔥 for XNG/USD (Natural Gas) – our tactical plan for smart intraday & swing moves based on technical, fundamental, and sentiment fusion.
💼This setup focuses on short-side scalps & swing entries, with a target to lock profits around the high-risk Green Zone before the market guards show up. Resistance zones are hot – expect consolidation, pressure buildup, and possible shakeouts.
🔑 Entry:
📍Plan smart pullback entries on 15–30 min TF near swing high/low zones.
🎯“The vault is open”—watch the market for weak bounces or fakeouts to ride the move.
🛡️ Stop Loss:
📌Primary SL is the most recent swing high on the 4H (around 3.600)
🔧Adjust based on risk tolerance, lot sizing, and how deep your stack of trades runs.
💥 Target:
🎯 Aim for 3.200 – a clean technical pivot where past price action has shown tension. Perfect spot to secure the bag.
🧲 Scalping Strategy:
🦅Short bias only. Stay light, stay fast. Use trailing SLs and don’t overstay your welcome. Let the swing crew do the heavy lifting.
🔍Market Narrative:
📉 Currently biased bearish, Natural Gas is facing pressure from:
Macro fundamentals
Seasonal distortions
Inventory & storage levels
COT report & Sentiment
Intermarket signals
📊Stay aware of news events – they’re known to rattle price structures. Set trailing SLs and manage your exposure wisely.
💬Final Words from the Thief Playbook:
💣Boost your strategy, not your stress. Let’s outsmart the market makers with sharp entries, sniper exits, and disciplined risk. 🚀
🔥💖Smash that LIKE if you vibe with this Energy Heist Plan. More tactical drops coming soon, so stay alert! 🧠📈🐱👤
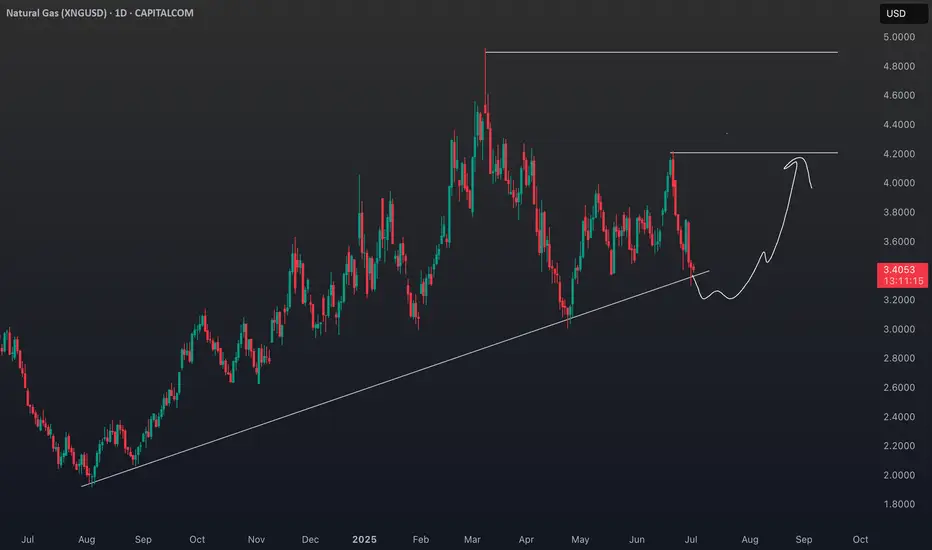
LNG Bull Market: How Geopolitics and Demand Are Fueling XNG🔥 The Natural Gas market presents a compelling risk/reward opportunity with strong fundamental support from ⚖️ supply/demand imbalances and 🌍 geopolitical factors. The technical chart shows a healthy 📊 consolidation after the explosive 🚀 February–March rally, with the potential for another leg higher.
📌 Key Investment Thesis:
• 📈 Structural bull market driven by demand growth outpacing supply
• 🌐 Geopolitical premium supporting price floor
• 🌦️ Weather-driven volatility creating trading opportunities
• 🛳️ LNG export growth providing long-term demand foundation
🧭 Recommended Approach:
• 💰 Accumulate positions on weakness near $3.00–$3.40 levels
• 🎯 Target initial resistance at $4.00, with extended targets at $5.00+
• ⚠️ Maintain disciplined risk management with stops below $2.60
• 👀 Monitor weather patterns and geopolitical developments closely
📊 Risk Rating: MODERATE TO HIGH (due to volatility)
💵 Return Potential: HIGH (⏫ 50–100% upside potential over 12–18 months)
❗ This analysis is for informational purposes only and should not be considered as financial advice.
⚠️ Natural gas trading involves significant risk and volatility.
📚 Always consult with a qualified financial advisor and conduct your own research before making investment decisions.
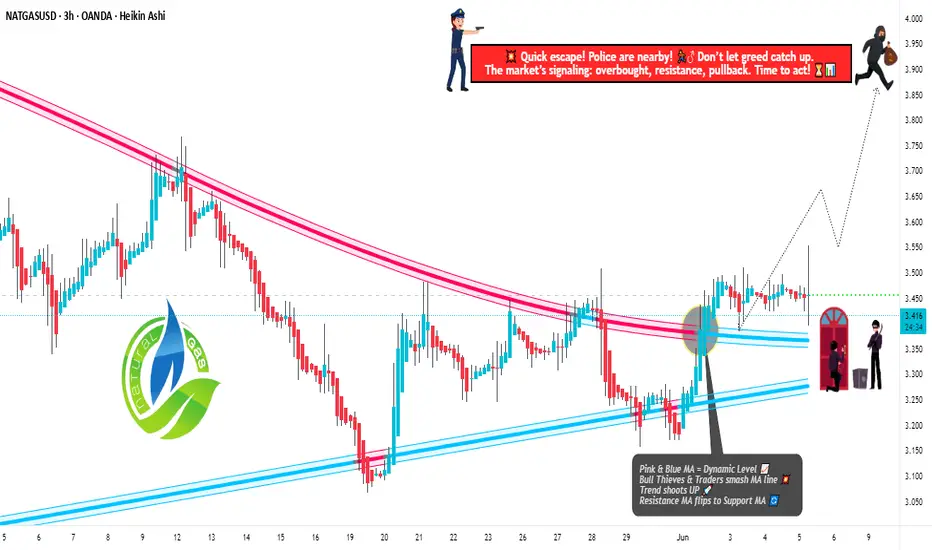
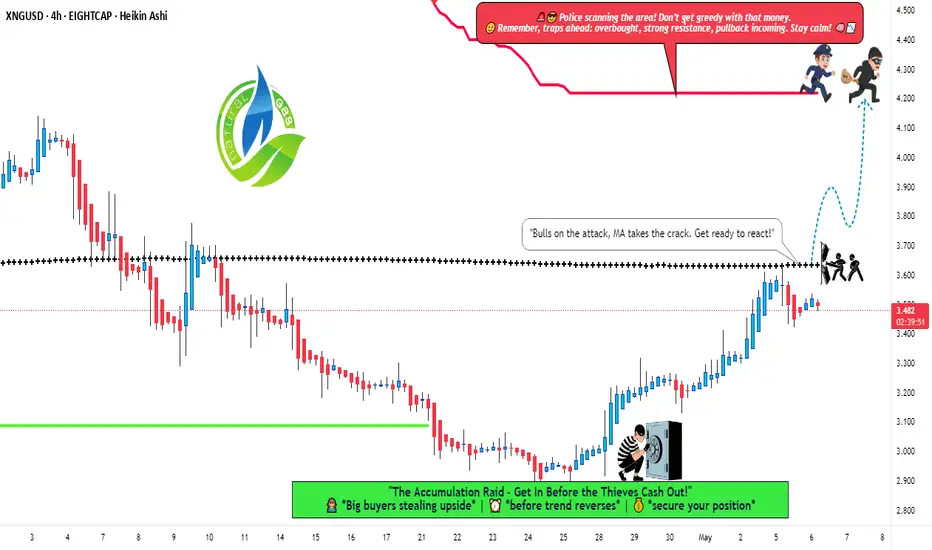
XNG/USD Market Swipe: Bullish Breakout Blueprint!🌟 Natural Gas Heist: XNG/USD Bullish Breakout Plan 🌟
Hey Money Snatchers & Market Raiders! 🤑💸
Ready to pull off a slick heist on the XNG/USD "Natural Gas" Energy Market? 🔥 Using our slick Thief Trading Style (technical + fundamental analysis), here’s the plan to grab the bullish loot and dodge the bearish traps! 🏴☠️💰
Entry 📈:
The vault’s cracked open! 🕳️ Snag the bullish loot at any price—swing low/high pullbacks are prime. Set buy limit orders in 15/30-min timeframes near swing levels for clean entries. 🕵️♂️
Stop Loss 🛑:
📍 Place your Thief SL below the moving average swing low candles on the 3H timeframe for swing/scalp trades.
📍 Adjust SL based on your risk, lot size, and multi-order setups. Stay sharp! ⚡
Target 🎯:
Aim for 3.900 or bail before the high-risk RED Zone (overbought, consolidation, or trend reversal). Bears lurk there—don’t get caught! 🐻🚨
Scalpers 👀:
Stick to long-side scalps. Got big cash? Jump in! Smaller stack? Join swing traders with a trailing SL to lock in profits. 💰🛡️
Market Vibes ⛽:
XNG/USD is shaking off bearish vibes, fueled by fundamentals, COT reports, inventory, seasonal trends, and sentiment. Check our bio0 for links to dive deeper! 🔗🌎
⚠️ News Alert 📰:
News drops can spike volatility. Play it safe:
Skip new trades during news releases. 🚫
Use trailing stop-loss to guard profits. 🔒
💥 Boost the Heist! 💥
Hit that Boost Button to power up our robbery squad! 💪 With Thief Trading Style, we’re stealing profits daily. Stay tuned for the next heist plan! 🐱👤🚀
Let’s swipe the cash and celebrate! 🎉💸
Natural Gas Prices on the RiseNatural Gas Prices on the Rise
As shown on the XNG/USD chart today, natural gas prices are trading around $3.960 per MMBtu — the highest level in over a month. This week’s series of bullish candles confirms strong demand.
Natural gas is becoming more expensive due to concerns over the military conflict between Iran and Israel. According to media reports:
→ Israel has attacked Iran’s South Pars gas field, and Donald Trump has called for the evacuation of Tehran.
→ Market participants fear that a blockade of the Strait of Hormuz could disrupt oil and natural gas supply chains.
In addition, forecasts of extreme heat in the US and increased demand for gas-powered air conditioning are also pushing prices higher.
Technical Analysis of the XNG/USD Chart
The chart shows that since mid-May, natural gas price movements have formed a narrowing triangle, suggesting a temporary balance between supply and demand.
However, the triangle has been broken to the upside — a sign of demand strength — with the price:
→ breaking through resistance at $3.800 per MMBtu;
→ forming the outlines of an ascending channel (shown in blue).
The following factors could act as resistance to the current upward move in natural gas prices:
→ the upper boundary of the channel;
→ the psychological level of $4.000 per MMBtu, near the May peak.
However, given that the hottest months of summer lie ahead and the situation in the Middle East remains highly volatile, it is reasonable to assume that the upward trend may continue.
This article represents the opinion of the Companies operating under the FXOpen brand only. It is not to be construed as an offer, solicitation, or recommendation with respect to products and services provided by the Companies operating under the FXOpen brand, nor is it to be considered financial advice.

XNG/USD "Natural Gas" Energy Market Robbery (Bullish Plan)🌟Hi! Hola! Ola! Bonjour! Hallo! Marhaba!🌟
Dear Money Makers & Robbers, 🤑 💰💸✈️
Based on 🔥Thief Trading style technical and fundamental analysis🔥, here is our master plan to heist the XNG/USD "Natural Gas" Energy Market. Please adhere to the strategy I've outlined in the chart, which emphasizes long entry. Our aim is to escape near the high-risk ATR Zone. Risky level, overbought market, consolidation, trend reversal, trap at the level where traders and bearish robbers are stronger. 🏆💸"Take profit and treat yourself, traders. You deserve it!💪🏆🎉
Entry 📈 : "The heist is on! Wait for the MA breakout (3.700) then make your move - Bullish profits await!"
however I advise to Place Buy stop orders above the Moving average (or) Place buy limit orders within a 15 or 30 minute timeframe most recent or swing, low or high level for Pullback entries.
📌I strongly advise you to set an "alert (Alarm)" on your chart so you can see when the breakout entry occurs.
Stop Loss 🛑: "🔊 Yo, listen up! 🗣️ If you're lookin' to get in on a buy stop order, don't even think about settin' that stop loss till after the breakout 🚀. You feel me? Now, if you're smart, you'll place that stop loss where I told you to 📍, but if you're a rebel, you can put it wherever you like 🤪 - just don't say I didn't warn you ⚠️. You're playin' with fire 🔥, and it's your risk, not mine 👊."
📍 Thief SL placed at the recent/swing low level Using the 4H timeframe (3.300) Day/Swing trade basis.
📍 SL is based on your risk of the trade, lot size and how many multiple orders you have to take.
🏴☠️Target 🎯: 4.200 (or) Escape Before the Target
🧲Scalpers, take note 👀 : only scalp on the Long side. If you have a lot of money, you can go straight away; if not, you can join swing traders and carry out the robbery plan. Use trailing SL to safeguard your money 💰.
💨⛽XNG/USD "Natural Gas" Energy Market Heist Plan (Swing / Day Trade) is currently experiencing a bearishness,., driven by several key factors.
📰🗞️Get & Read the Fundamental, Macro, COT Report, Inventory and Storage Analysis, Seasonal Factors, Sentimental Outlook, Intermarket Analysis, Future trend targets.. go ahead to check 👉👉👉🔗🔗🌎🌏🗺
⚠️Trading Alert : News Releases and Position Management 📰 🗞️ 🚫🚏
As a reminder, news releases can have a significant impact on market prices and volatility. To minimize potential losses and protect your running positions,
we recommend the following:
Avoid taking new trades during news releases
Use trailing stop-loss orders to protect your running positions and lock in profits
💖Supporting our robbery plan 💥Hit the Boost Button💥 will enable us to effortlessly make and steal money 💰💵. Boost the strength of our robbery team. Every day in this market make money with ease by using the Thief Trading Style.🏆💪🤝❤️🎉🚀
I'll see you soon with another heist plan, so stay tuned 🤑🐱👤🤗🤩
XNG/USD "Natural Gas" Energy Market Robbery Plan (Scalping/Day)🌟Hi! Hola! Ola! Bonjour! Hallo! Marhaba!🌟
Dear Money Makers & Robbers, 🤑💰✈️
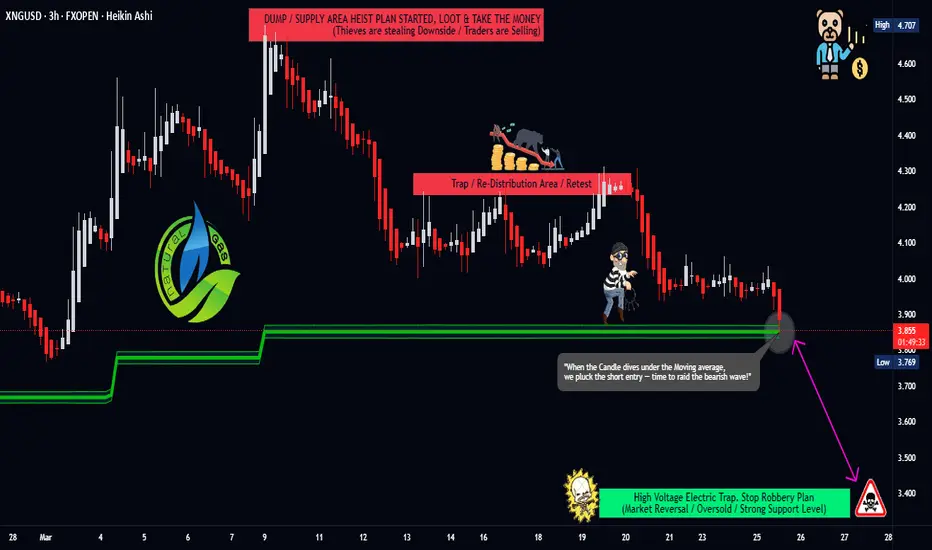
Based on 🔥Thief Trading style technical and fundamental analysis🔥, here is our master plan to heist the XNG/USD "Natural Gas" Energy Market. Please adhere to the strategy I've outlined in the chart, which emphasizes short entry. Our aim is the high-risk Green Zone. Risky level, oversold market, consolidation, trend reversal, trap at the level where traders and bullish robbers are stronger. 🏆💸Book Profits Be wealthy and safe trade.💪🏆🎉
Entry 📈 : "The heist is on! Wait for the breakout (3.800) then make your move - Bearish profits await!"
however I advise placing Sell Stop Orders below the breakout MA or Place Sell limit orders within a 15 or 30 minute timeframe. Entry from the most recent or closest low or high level should be in retest. I Highly recommended you to put alert in your chart.
📌I strongly advise you to set an "alert (Alarm)" on your chart so you can see when the breakout entry occurs.
Stop Loss 🛑: Thief SL placed at 4.200 (Scalping / Day Trade Basis) Using the 3H period, the recent / swing high or low level.
SL is based on your risk of the trade, lot size and how many multiple orders you have to take.
Target 🎯: 3.400 (or) Escape Before the Target
🧲Scalpers, take note 👀 : only scalp on the Short side. If you have a lot of money, you can go straight away; if not, you can join swing traders and carry out the robbery plan. Use trailing SL to safeguard your money 💰.
💨⛽XNG/USD "Natural Gas" Energy Market Heist Plan (Scalping / Day Trade) is currently experiencing a bearishness,., driven by several key factors.
📰🗞️Get & Read the Fundamental, Macro, COT Report, Inventory and Storage Analysis, Seasonal Factors, Sentimental Outlook, Intermarket Analysis, Future trend targets.. go ahead to check 👉👉👉🔗
⚠️Trading Alert : News Releases and Position Management 📰 🗞️ 🚫🚏
As a reminder, news releases can have a significant impact on market prices and volatility. To minimize potential losses and protect your running positions,
we recommend the following:
Avoid taking new trades during news releases
Use trailing stop-loss orders to protect your running positions and lock in profits
💖Supporting our robbery plan 💥Hit the Boost Button💥 will enable us to effortlessly make and steal money 💰💵. Boost the strength of our robbery team. Every day in this market make money with ease by using the Thief Trading Style.🏆💪🤝❤️🎉🚀
I'll see you soon with another heist plan, so stay tuned 🤑🐱👤🤗🤩
"XNG/USD Natural Gas" Energy Market Heist Plan (Scalping/Day)🌟Hi! Hola! Ola! Bonjour! Hallo! Marhaba!🌟
Dear Money Makers & Robbers, 🤑 💰💸✈️
Based on 🔥Thief Trading style technical and fundamental analysis🔥, here is our master plan to heist the "XNG/USD Natural Gas" Energy Market. Please adhere to the strategy I've outlined in the chart, which emphasizes long entry. Our aim is to escape near the high-risk ATR Zone. Risky level, overbought market, consolidation, trend reversal, trap at the level where traders and bearish robbers are stronger. 🏆💸"Take profit and treat yourself, traders. You deserve it!💪🏆🎉
Entry 📈 : "The vault is wide open! Swipe the Bearish loot at any price - the heist is on!
however I advise to Place sell limit orders within a 15 or 30 minute timeframe most nearest or swing, low or high level for Pullback Entries.
Stop Loss 🛑:
📌Thief SL placed at the nearest/swing High or Low level Using the 2h timeframe (3.800) Day/Scalping trade basis.
📌SL is based on your risk of the trade, lot size and how many multiple orders you have to take.
🏴☠️Target 🎯: 3.200
🧲Scalpers, take note 👀 : only scalp on the Long side. If you have a lot of money, you can go straight away; if not, you can join swing traders and carry out the robbery plan. Use trailing SL to safeguard your money 💰.
⛽💨"XNG/USD Natural Gas" Energy Market Heist Plan (Scalping/Day) is currently experiencing a bullishness,., driven by several key factors. 👇👇👇
📰🗞️Get & Read the Fundamental, Macro Economics, COT Report, Inventory and Storage Analysis, Seasonal Factors, Sentimental Outlook, Intermarket Analysis, Future trend targets & Overall Outlook Score... go ahead to check 👉👉👉🔗🔗
⚠️Trading Alert : News Releases and Position Management 📰 🗞️ 🚫🚏
As a reminder, news releases can have a significant impact on market prices and volatility. To minimize potential losses and protect your running positions,
we recommend the following:
Avoid taking new trades during news releases
Use trailing stop-loss orders to protect your running positions and lock in profits
💖Supporting our robbery plan 💥Hit the Boost Button💥 will enable us to effortlessly make and steal money 💰💵. Boost the strength of our robbery team. Every day in this market make money with ease by using the Thief Trading Style.🏆💪🤝❤️🎉🚀
I'll see you soon with another heist plan, so stay tuned 🤑🐱👤🤗🤩
XNG/USD Analysis: Natural Gas Price Drops to March LowXNG/USD Analysis: Natural Gas Price Drops to March Low
On 27 January, our analysis of the natural gas chart highlighted the formation of an ascending channel. Later, on 10 March, we noted that the sharp price increase had created technical conditions for a correction.
Since then, as indicated by the arrow on the XNG/USD chart, natural gas prices have declined by approximately 19%.
Why Is the Price of Natural Gas Falling?
- Unseasonably Warm Weather: Atmospheric G2 reported on Wednesday that forecasts now indicate significant warming across the eastern half of the U.S. from 31 March to 4 April. This could reduce demand for natural gas used in heating.
- Rising Inventories: According to the EIA’s forecast, weekly natural gas storage levels are expected to increase by +33 billion cubic feet over the past week.
Technical Analysis of XNG/USD Chart
Looking at the broader trend since the start of the year, the ascending channel (marked in blue) remains relevant. However, bears have pushed the price below its median line, shifting movement into a short-term downward channel (marked in red).
Currently, natural gas is trading near the $3.780/MMBtu level, a key price point that has previously acted as both support and resistance. Whether a bearish breakdown or a bullish rebound occurs largely depends on the upcoming EIA report, scheduled for release at 17:30 GMT+3.
This article represents the opinion of the Companies operating under the FXOpen brand only. It is not to be construed as an offer, solicitation, or recommendation with respect to products and services provided by the Companies operating under the FXOpen brand, nor is it to be considered financial advice.
XNG/USD "Natural Gas" Energy Market Robbery Plan🌟Hi! Hola! Ola! Bonjour! Hallo! Marhaba!🌟
Dear Money Makers & Thieves, 🤑 💰🐱👤🚀
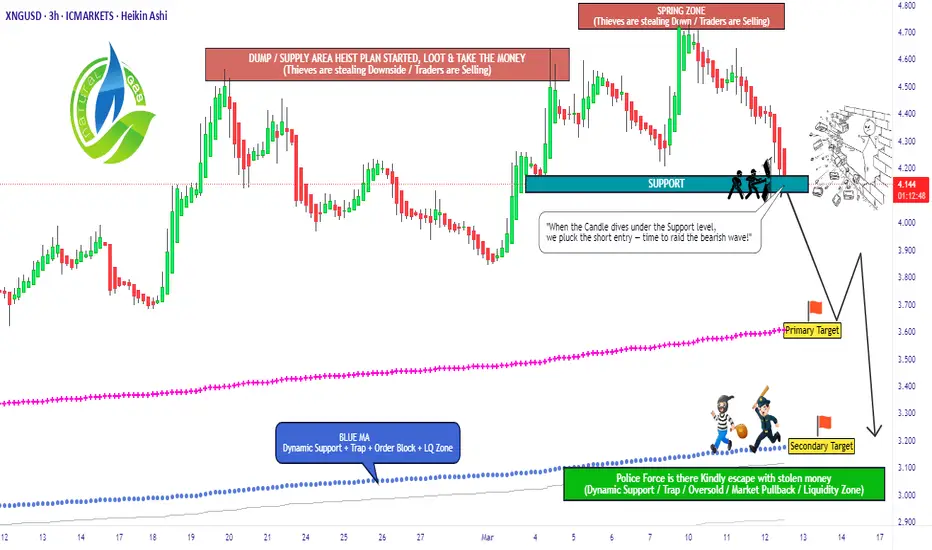
Based on 🔥Thief Trading style technical and fundamental analysis🔥, here is our master plan to heist the XNG/USD "Natural Gas" Energy Market. Please adhere to the strategy I've outlined in the chart, which emphasizes short entry. Our aim is the high-risk Green Zone. Risky level, oversold market, consolidation, trend reversal, trap at the level where traders and bullish thieves are getting stronger. 🏆💸Book Profits Be wealthy and safe trade.💪🏆🎉
Entry 📈 : "The vault is wide open! Swipe the Bearish loot at any price - the heist is on! however I advise placing Sell Stop Orders below the breakout MA or Place Sell limit orders within a 15 or 30 minute timeframe. Entry from the most recent or closest low or high level should be in retest.
Stop Loss 🛑: Thief SL placed at (4.070) swing Trade Basis Using the 4H period, the recent / swing high or low level.
SL is based on your risk of the trade, lot size and how many multiple orders you have to take.
Target 🎯:
Primary Target - 3.680 (or) Escape Before the Target
Secondary Target - 3.450 (or) Escape Before the Target
🧲Scalpers, take note 👀 : only scalp on the Short side. If you have a lot of money, you can go straight away; if not, you can join swing traders and carry out the robbery plan. Use trailing SL to safeguard your money 💰.
📰🗞️Fundamental, Macro, COT Report, Sentimental Outlook, Positioning Analysis:
XNG/USD "Natural Gas" Energy Market is currently experiencing a Bearish trend for short term period (Bullish in future)., driven by several key factors.
💨⛽Fundamental Analysis
Supply and Demand: Natural gas demand is expected to increase due to the ongoing winter season in the Northern Hemisphere.
Production: US natural gas production is expected to remain steady, with a slight increase in production from the Marcellus shale region.
Weather: Colder-than-expected weather in the US and Europe is expected to drive up natural gas demand.
💨⛽Macro Economics
Interest Rates: The US Federal Reserve has maintained its hawkish stance, keeping interest rates at 5.25% to combat inflation.
GDP Growth: The US GDP growth rate is expected to slow down to 2.0% in 2025, due to the ongoing economic uncertainty.
Global Trade: The ongoing trade tensions between the US and China are expected to have a minimal impact on the natural gas market.
💨⛽COT Data
Speculators (Non-Commercials): 35,019 long positions and 20,015 short positions.
Hedgers (Commercials): 20,011 long positions and 30,019 short positions.
Asset Managers: 25,015 long positions and 15,019 short positions.
💨⛽Market Sentiment Analysis
The overall sentiment for XNG/USD is bullish, with a mix of positive and neutral predictions.
60% of client accounts are long on this market, indicating a bullish sentiment.
💨⛽Positioning Analysis
The long/short ratio for XNG/USD is currently 1.75.
The open interest for XNG/USD is approximately 1.2 million contracts.
💨⛽Inventory and Storage Analysis
US Natural Gas Storage: The US natural gas storage level is currently at 1.8 trillion cubic feet, which is 10% below the 5-year average.
Inventory Levels: Inventory levels are expected to decline further due to the ongoing cold weather and increased demand.
💨⛽Additional Tools and Resources
Weather Forecasts: Colder-than-expected weather in the US and Europe is expected to drive up natural gas demand.
Production Data: US natural gas production is expected to remain steady, with a slight increase in production from the Marcellus shale region.
💨⛽Next Trend Move
Bullish Prediction: Some analysts predict a potential bullish move, targeting $4.20 and $4.50, due to the ongoing cold weather and increased demand.
Bearish Prediction: Others predict a potential bearish move, targeting $3.50 and $3.20, due to the expected decline in natural gas demand after the winter season.
💨⛽Future Prediction
Short-Term: Bullish: $4.00-$4.20, Bearish: $3.60-$3.40
Medium-Term: Bullish: $4.50-$4.80, Bearish: $3.20-$2.80
Long-Term: Bullish: $5.00-$5.50, Bearish: $2.50-$2.00
💨⛽Overall Summary Outlook
The overall outlook for XNG/USD is bullish, with a mix of positive and neutral predictions.
The market is expected to experience a moderate increase, with some analysts predicting a potential bullish move targeting $4.20 and $4.50.
Real-Time Market Feed
As of the current time, XNG/USD is trading at $3.90, with a 1.0% increase in the last 24 hours.
📌Keep in mind that these factors can change rapidly, and it's essential to stay up-to-date with market developments and adjust your analysis accordingly.
⚠️Trading Alert : News Releases and Position Management 📰 🗞️ 🚫🚏
As a reminder, news releases can have a significant impact on market prices and volatility. To minimize potential losses and protect your running positions,
we recommend the following:
Avoid taking new trades during news releases
Use trailing stop-loss orders to protect your running positions and lock in profits
💖Supporting our robbery plan 💥Hit the Boost Button💥 will enable us to effortlessly make and steal money 💰💵. Boost the strength of our robbery team. Every day in this market make money with ease by using the Thief Trading Style.🏆💪🤝❤️🎉🚀
I'll see you soon with another heist plan, so stay tuned 🤑🐱👤🤗🤩

XNG/USD "Natural Gas" Energy Market Robbery Plan🌟Hi! Hola! Ola! Bonjour! Hallo! Marhaba!🌟
Dear Money Makers & Thieves, 🤑 💰🐱👤🚀
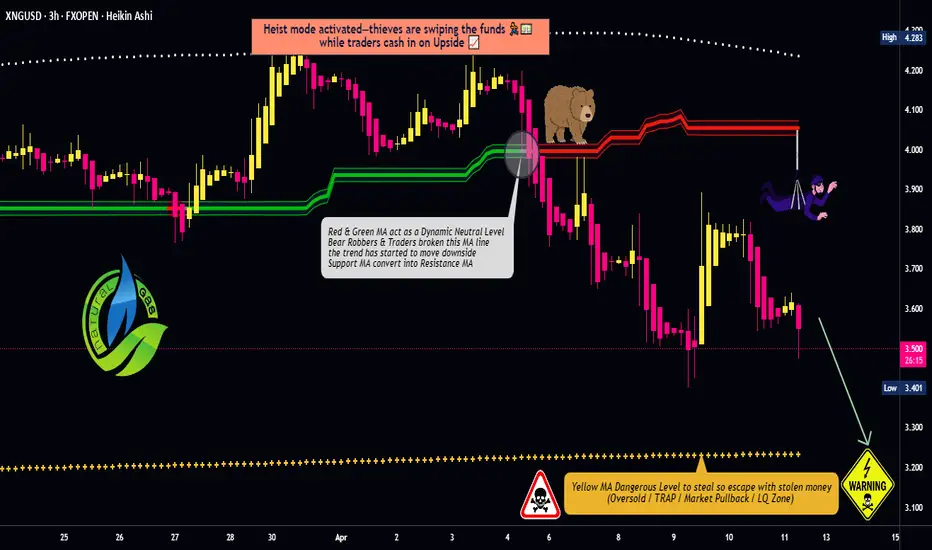
Based on 🔥Thief Trading style technical and fundamental analysis🔥, here is our master plan to heist the XNG/USD "Natural Gas" Energy Market. Please adhere to the strategy I've outlined in the chart, which emphasizes short entry. Our aim is the high-risk Green Zone. Risky level, oversold market, consolidation, trend reversal, trap at the level where traders and bullish thieves are getting stronger. 🏆💸Book Profits Be wealthy and safe trade.💪🏆🎉
Entry 📈 : "The heist is on! Wait for the breakout (4.100) then make your move - Bearish profits await!" however I advise placing Sell Stop Orders below the breakout MA or Place Sell limit orders within a 15 or 30 minute timeframe. Entry from the most recent or Swing high or low level should be in retest.
📌I strongly advise you to set an alert on your chart so you can see when the breakout entry occurs.
Stop Loss 🛑: Thief SL placed at (4.400) swing Trade Basis Using the 2H period, the recent / swing high or low level.
SL is based on your risk of the trade, lot size and how many multiple orders you have to take.
Target 🎯:
🏴☠️Primary Target - 3.600 (or) Escape Before the Target
🏴☠️Secondary Target - 3.200 (or) Escape Before the Target
🧲Scalpers, take note 👀 : only scalp on the Short side. If you have a lot of money, you can go straight away; if not, you can join swing traders and carry out the robbery plan. Use trailing SL to safeguard your money 💰.
📰🗞️Read the Fundamental, Macro Economics, COT Report, Global Market Analysis, Sentimental Outlook, Intermarket Analysis, Additional Tools and Resources, Inventory and Storage Analysis, Next Trend Move:
⛽XNG/USD "Natural Gas" Energy Market is currently experiencing a Neutral trend., driven by several key factors.
⭐☀🌟Fundamental Analysis⭐☀🌟
Supply and Demand: The current supply and demand dynamics suggest a surplus in the market, leading to downward pressure on prices.
Production and Storage: US natural gas production remains high, while storage levels are above the 5-year average, contributing to the bearish trend.
Weather: Mild winter weather has reduced demand for natural gas, exacerbating the bearish trend.
⭐☀🌟Macroeconomic Factors⭐☀🌟
Economic Growth: Slowing economic growth can lead to reduced energy demand, negatively impacting natural gas prices.
Inflation: Low inflation can lead to lower energy prices, including natural gas.
Interest Rates: Changes in interest rates can impact the cost of production and transportation of natural gas.
⭐☀🌟COT Data⭐☀🌟
Commitment of Traders: As of March 5, 2025, the COT report shows:
Commercial: Net-short 120,000 contracts ( increased by 10,000 contracts from previous week)
Non-Commercial: Net-short 80,000 contracts (increased by 5,000 contracts from previous week)
Managed Money: Net-short 50,000 contracts (increased by 2,000 contracts from previous week)
⭐☀🌟Intermarket Analysis⭐☀🌟
Crude Oil: Natural gas prices often correlate with crude oil prices. A decline in crude oil prices can lead to lower natural gas prices.
US Dollar: A stronger US dollar can make natural gas more expensive for foreign buyers, potentially decreasing demand.
⭐☀🌟Sentiment Factors⭐☀🌟
Market Sentiment: The current market sentiment is bearish, with a majority of traders and analysts expecting lower prices.
Options Data: Options data suggests a bias towards put options, indicating a bearish sentiment.
⭐☀🌟Seasonal Factors⭐☀🌟
Seasonal Trends: Natural gas prices often follow a seasonal pattern, with prices tend to rise during the winter months (December to February) and fall during the summer months (June to August).
⭐☀🌟Additional Tools and Resources⭐☀🌟
Technical Indicators: RSI (14) is at 30, indicating an oversold condition.
Chart Patterns: A bearish flag pattern is forming on the daily chart.
⭐☀🌟Next Trend Move and Future Trend Prediction⭐☀🌟
Short-Term Targets
Primary Target: $3.80
Secondary Target: $3.50
Ultimate Target: $3.20
Medium-Term Targets
Primary Target: $3.00
Secondary Target: $2.80
Ultimate Target: $2.50
Long-Term Targets
Primary Target: $2.20
Secondary Target: $2.00
Ultimate Target: $1.80
⭐☀🌟Overall Summary and Outlook⭐☀🌟
The overall outlook for XNG/USD (Natural Gas) remains bearish, driven by a combination of fundamental, technical, and sentimental factors. While there are potential risks and uncertainties, the current trend and market sentiment suggest lower prices in the short to medium term.
📌Keep in mind that these factors can change rapidly, and it's essential to stay up-to-date with market developments and adjust your analysis accordingly.
⚠️Trading Alert : News Releases and Position Management 📰 🗞️ 🚫🚏
As a reminder, news releases can have a significant impact on market prices and volatility. To minimize potential losses and protect your running positions,
we recommend the following:
Avoid taking new trades during news releases
Use trailing stop-loss orders to protect your running positions and lock in profits
💖Supporting our robbery plan 💥Hit the Boost Button💥 will enable us to effortlessly make and steal money 💰💵. Boost the strength of our robbery team. Every day in this market make money with ease by using the Thief Trading Style.🏆💪🤝❤️🎉🚀
I'll see you soon with another heist plan, so stay tuned 🤑🐱👤🤗🤩
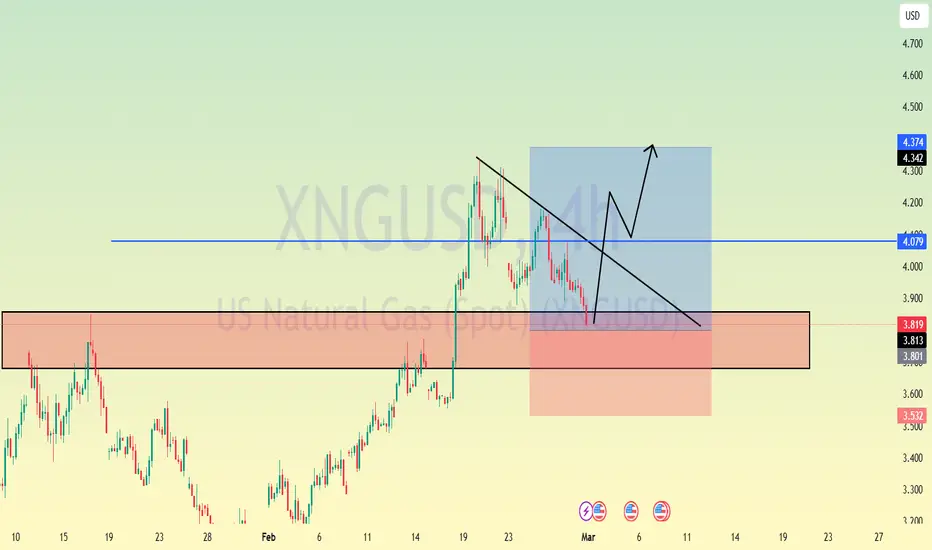
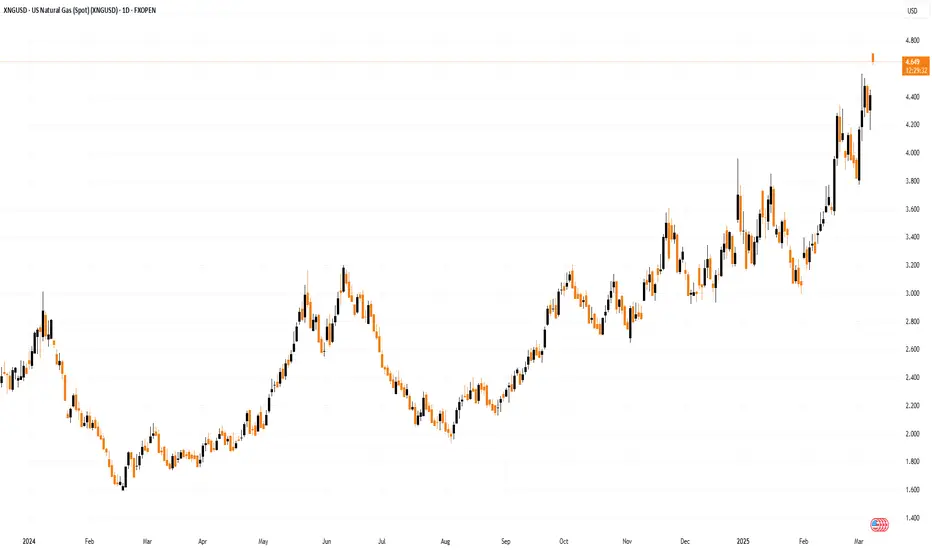
XNG/USD Analysis: Natural Gas Price Hits Over Two-Year HighXNG/USD Analysis: Natural Gas Price Hits Over Two-Year High
On 27 January, while analysing the natural gas chart, we noted that price fluctuations:
→ Were forming an ascending channel.
→ Identified $3.700 as a key resistance level.
As shown on the XNG/USD chart, bears had control in late January but failed to maintain their grip. Since then:
→ Natural gas prices have continued their upward trajectory.
→ The $3.700 level was breached, becoming part of a resistance zone with an upper boundary at $3.800, which later acted as support (as indicated by the arrow).
As a result, today, natural gas prices have surged to $4.800/MMBtu—the highest level since late December 2022.
Bullish Factors Driving the Market (According to Trading Economics):
→ Weather Conditions – A cold spell in the U.S. has increased demand for heating gas. Meteorologists predict a shift towards milder temperatures across 48 states in March.
→ LNG Exports – U.S. liquefied natural gas (LNG) exports have hit a record high of 15.6 billion cubic feet per day under the new administration. Meanwhile, trade uncertainties, including a potential slowdown in natural gas flows from Canada to the U.S., are raising concerns among market participants.
Technical Outlook for XNG/USD:
→ The market remains in an uptrend (indicated by blue lines), with the price now exceeding its upper boundary.
→ The RSI indicator is approaching overbought levels and may form a bearish divergence.
These observations suggest that the price is in a vulnerable position for a pullback. If this scenario unfolds, a test of the $4.250 area cannot be ruled out.
Trade on TradingView with FXOpen. Consider opening an account and access over 700 markets with tight spreads from 0.0 pips and low commissions from $1.50 per lot.
This article represents the opinion of the Companies operating under the FXOpen brand only. It is not to be construed as an offer, solicitation, or recommendation with respect to products and services provided by the Companies operating under the FXOpen brand, nor is it to be considered financial advice.
Natural Gas still coiling! breakdown or breakout?Hello Traders
In This Chart NATGAS HOURLY Forex Forecast By FOREX PLANET
today NATGAS analysis 👆
🟢This Chart includes_ (NATGAS market update)
🟢What is The Next Opportunity on NATGAS Market
🟢how to Enter to the Valid Entry With Assurance Profit
This CHART is For Trader's that Want to Improve Their Technical Analysis Skills and Their Trading By Understanding How To Analyze The Market Using Multiple Timeframes and Understanding The Bigger Picture on the Charts