Why Warren Buffett pours billions of dollars into OXY ?Legendary investor Warren Buffet is pouring billions of dollars into Occidental Petroleum Corporation ! when it rejected heavily from strong and valid down trend line ! why ?
Please note Buffett is a long term investor not a trader !. US market has been in a Bull run in large time frames (Yearly or Monthly) since 1932 therefore, any long term investor who chose fundamentally powerful stock has made a huge profit.
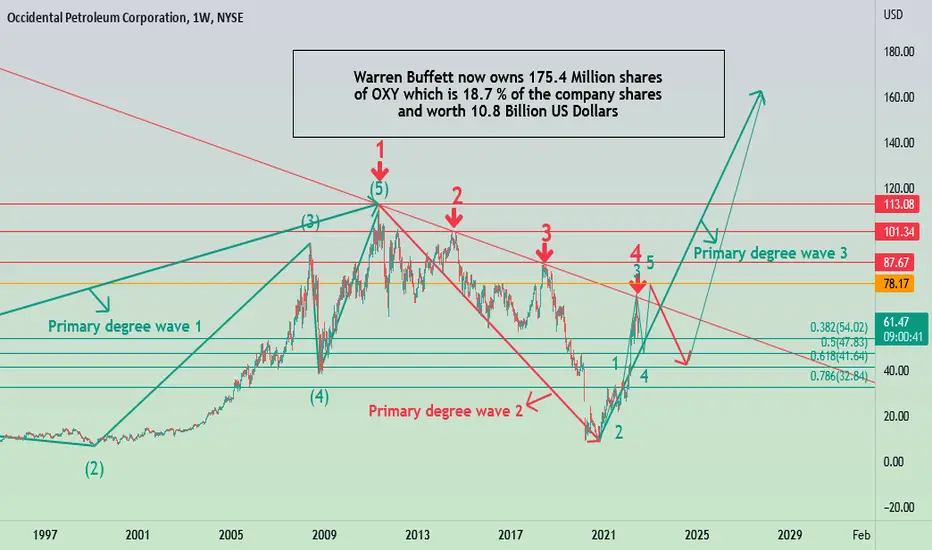
Although I believe Berkshire could have chosen better time and maybe lower price to start buying shares of OXY, I think it will see higher prices in long term in fact, It goes much higher than ATH and will reach to around 180 USD per share or even higher in up coming YEARS.
Now , lets look at what we have in technical point of view:
1. OXY was rejected strongly from valid down trend line in weekly time frame for 4th time . Break out of this heavy down trend line is very important for the stock to go higher.
2. In terms of Elliott waves, similar to many other energy stocks like XOM, COP, SLB and etc , OXY has completed and ascending complete wave cycle from IPO to latest major low (Primary degree waves 1 and 2 on the chart shown by green and red arrows respectively ). It means that impulsive section (Primay degree wave 3) of new wave cycle has been started at last major low around 9 USD. In closer look, currently we are in wave 4 of 1 of primary degree wave 3. Elliott wave labeling on the chart shows internal waves (12345) of wave 1 of primary degree wave 3. It means there is one more leg up ( wave 5 shown on the chart ) to complete wave 1 of primary degree wave 3. Then we will probably have a major correction (wave 2 of 3 ) down to 40-50 level and after completion of correction , wave 3 of 3 which is most profitable and most speedy wave will start. Please note this is most probable scenario and we are not talking about certainty.
3. Beside strong down trend line, there are many strong static resistances on OXY climb road. These Resistances are shown by red horizontal lines on the chart. Therefore, OXY will face difficulties on the way to reach it's target.
One more important note :
As Berkshire owns now around 20 % of company shares and they are long term holders, We can somehow be sure that 20 % of shares of company will be out of future sell pressure in up coming years which is very important note to be considered.
All in all, I believe OXY , like many other energy stocks , offers huge profit for long term investor and traders. However, Is it a right time to open a long position? It depends on personality and risk management and patience of investors/traders. I myself, keep OXY in my watch list and think it can be bought on lower prices as shown by green lines. To me, buying a stock when it is struggling with a strong down trend line is dangerous and as always, I am seeking for a safe trade set up.
I Hope this publication to be useful and wish you all the best.
XOM
USOIL - We've dressed in our best and are prepared to go down Update on previous charts, no difference, but this 3rd wave down should be a strong one to catch. USOIL should bottom after the markets do, probably after CPI on July 13. A=C gets you to the mid 80's

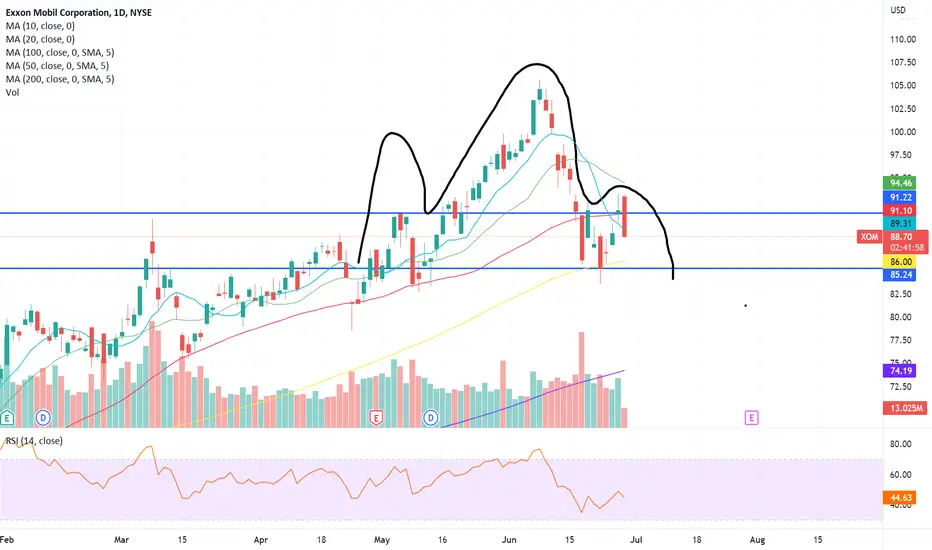
Are energies done? XOM$XOM seems to be creating head and shoulders pattern. Imo the move for energies has been done, at least for a while. The previous support now acts like a resistance, and it failed to hold above 91.20 yesterday. I would be careful as it might be a change of trend and also could be wave 3 out of 5 on the way down. Still LT trend is bullish. We shall see if the 100MA will keep the price from falling lower.
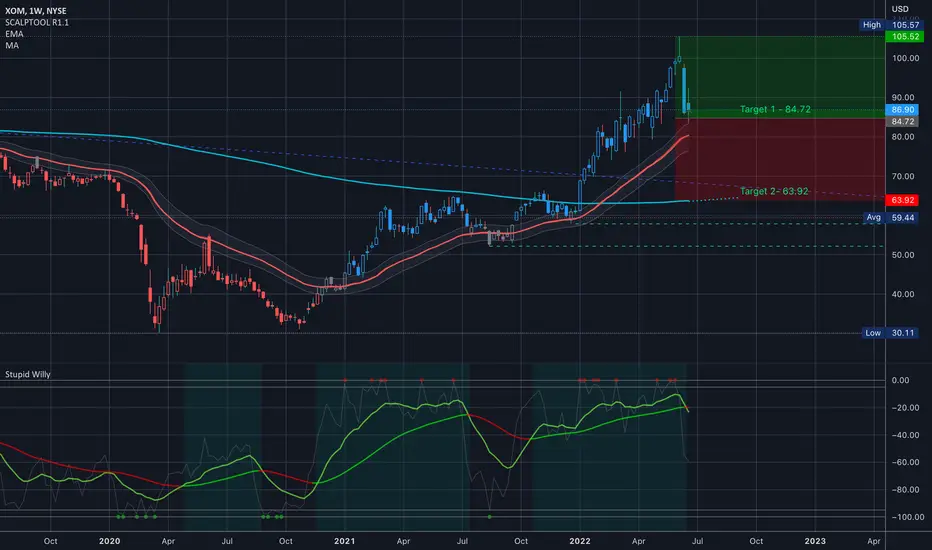
$XOM Analysis, Key levels & Targets$XOM Analysis, Key levels & Targets
By request… and thank you because I will play this one… Some of you know that I'm originally an energy sector trader... don't enter this trade unless you know the riskes... and have fun...
—-
I am not your financial advisor. Watch my setups first before you jump in… My trade set ups work very well and they are for my personal reference and if you decide to trade them you do so at your own risk. I will gladly answer questions to the best of my knowledge but ultimately the risk is on you. I will update targets as needed.
GL and happy trading.
IF you need anything analyzed Technically just comment with the Ticker and I’ll do it as soon as possible…
XOM - 50MA from support to resistance50 MA which acted as a previous strong support might now become a resistance. I'd be careful with energy stocks in the near term.

XOMGoing into next week we could see this push back to 100$. If this fails to break above 88 we will keep the downtrend to 70$

Usoil - C waves, Jim Cramer, and the the Big shortUsoil may have peaked for at least a few months. Any higher than 124 and I'm wrong, but very few people are thinking we are about to embark on a C wave down. If this is true Oil will start to underperform the SPX.

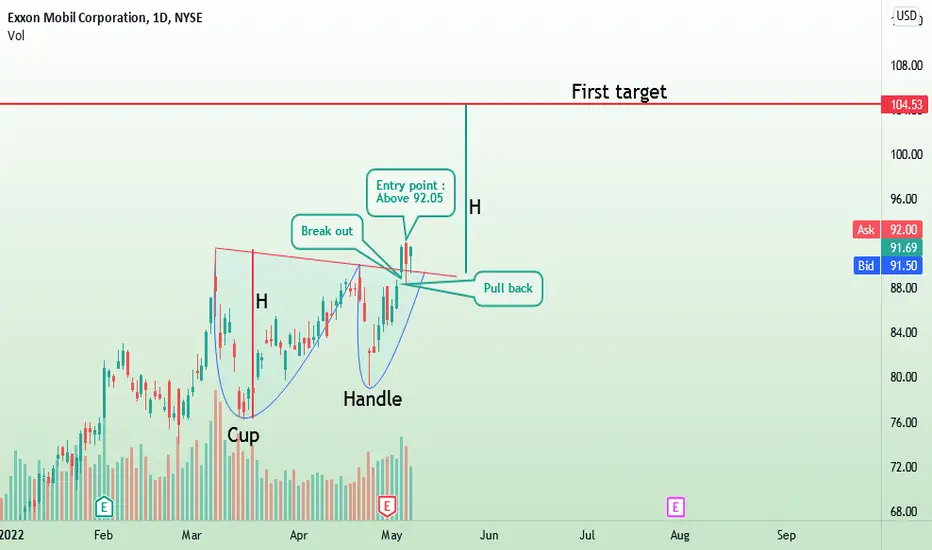
XOM, Cup and Handle Break out ! Long above 92.05 !XOM is beautifully formed a classic cup and handle pattern.
So far, we have break out , pull back and only remaining point to safe entry is a bullish candle above 92.05.
First target which was obtained by adding the depth of cup ( shown as H on the chart ) to the break out line is 104-105 USD.
Please note the crude oil trend is also up therefore , it is reasonable for energy stocks to go up.
In terms of Elliott waves, XOM may see much higher prices especially in long terms . I will publish my broader view for the stock later and propose my wave count and related long term targets ( s.th close to 200 USD !! ). For now, I just tried to keep it as simple as possible.
Wish you nice profits.
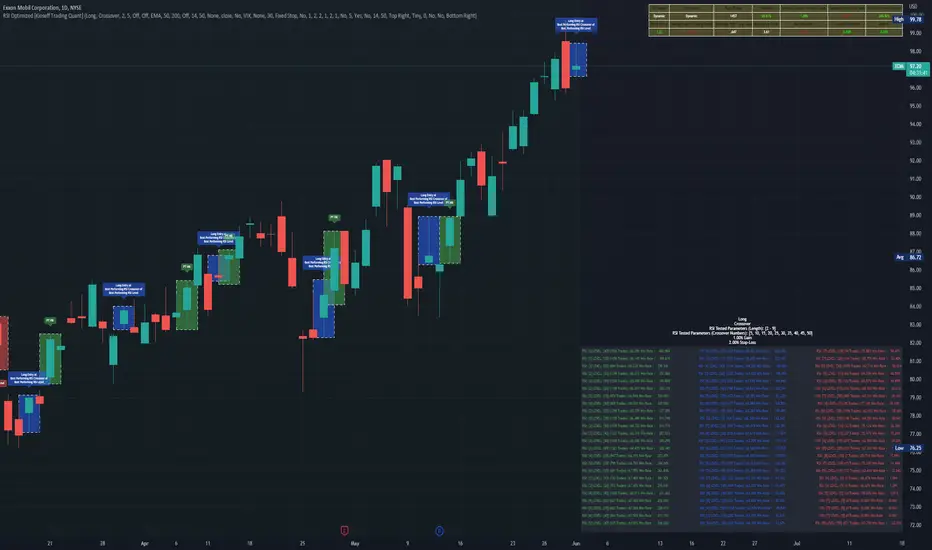
$XOM RSI Optimizer Signal @KioseffTrading RSI Optimizer being used & is showing a long entry signal at best performing RSI Crossover.
Energy is Breaking OutCrude Oil, Gasoline, and energy stocks are breaking out. These are the charts and trends we are watching most closely to confirm this breakout.

Xom is moving upXom in now in an up trend, let's make sure we don't break 91.64, with the oil prices going up the results will be amazing


How To Be ContrarianMy goal is to try to make traders and investor THINK DIFFERENTLY about markets. I believe as humans we seek validation, comfort in affirming our beliefs, and that manifests in the wild swings of the market when the narrative is proven wrong. Back in January 2021 I made an uncomfortable bet on Exxon NYSE:XOM . It was uncomfortable at the time because the narrative was that "dirty energy" was dead, oil was going down to $12/barrel, and EV was the future. These may very well all be true... but it was early. And in investing; being early and being wrong are often indistinguishable. At the time, Exxon was trading below book value (market cap < assets-liabilities on balance sheet), it offered a 7% dividend yield which they did not cut, and had just hit a double bottom. It was NOT obvious at the time... only in hindsight. But these are the types of contrarian trades that investors MUST look at to achieve outsized gains.

XOM to test the highsXOM has a high probability to test its recent highs. I feel the May 20, 2022 87.5 calls seem cheap, 20% and I'm booking half and letting the rest ride. I am no pro but typically summer months cause oil to rise anyways. We shall see!
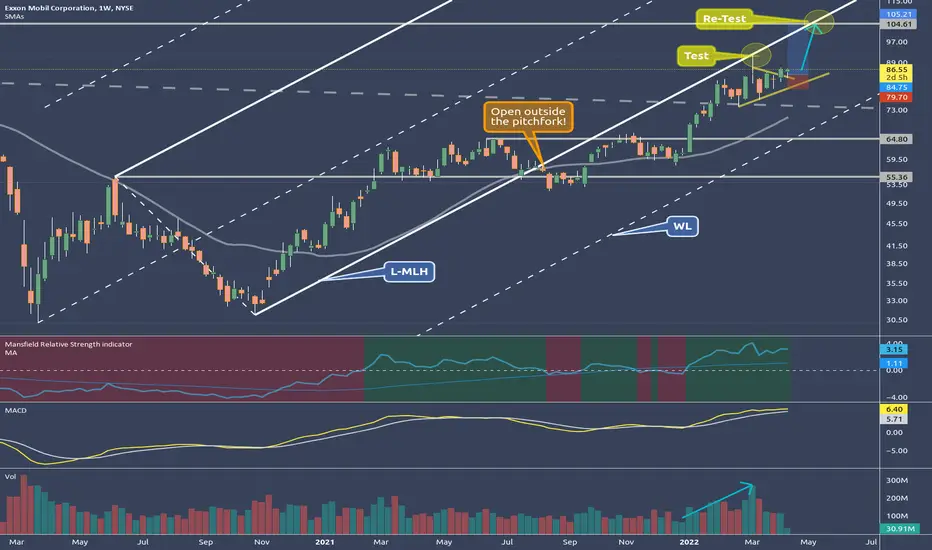
XOM - Re-Testing the L-MLHXOM is super strong.
I use my favorite tool, the pitchfork, to apply projections of price, filtering, find entries, exits etc.
What many pitchfork traders don't understand is, that they can't just apply this tool to the chart. I see many doing it wrong anyways, which has to do with identifying the correct pivot/swing/pendulum swing points, and not being aware of the rules.
However, using the rules is equally important. Because the rules define the framing around this tool. Otherwise it's worth nothing, or even harmful to the trader.
One of the rules says, that if price is trading outside the pitchfork, it often is going to test/re-test the line where it fell/zoomed out of.
In this case it's the L-MLH, the Lower-Medianline-Parallel. As we see, the first test was just a couple days ago. Now, it looks like XOM is re-testing the L-MLH again.
What happens after the re-test?
a) price is either strong enough to trade back into the projected pitchfork again, recapturing the previous slope/path of price.
or
b) price will trade to the next WL (Warning Line), going south or eating up time by trading sideways.
As a firm believer in the rules of the pitchfork, I'm long this stock, playing for a re-test at the L-MLH.
Ascending Triangle in the XLEThe Macro trends of 2022 are no secret to any of us. Sky rocketing inflation and the war in Ukraine have lead to soaring energy costs around the world. As a result, Oil has seen a period of extreme volatility, reaching a high of closing high price of 129.44 on March 8th. As a result, the XLE has followed suit and is up about +30% year to date. Exxon, the largest holding in the XLE, reports earnings on April 29th and has expressed that the anticipate setting record profits. Buy the rumor?
The XLE appears to be forming a nice Ascending Triangle, which could be suggesting a bullish continuation. The Ascending Triangle isn't a particularly strong pattern from a statistical perspective with only about a 60% chance of realizing the bullish continuation. Take it with a big grain of salt, but there is also a very slight Hidden Bullish Divergence on the MACD. Nevertheless, it warrants paying attention to as a potential swing trade.
A lot will depend on what Oil does, and the fact that XOM and CVX are reporting earnings on the 29th muddies the waters a bit. However, it could offer a nice opportunity for a shot in the dark trade to the upside looking for a pop the upside in advance of the earnings. Maybe something like an OTM Call spread around the .30 delta in XLE 30 days out or so...

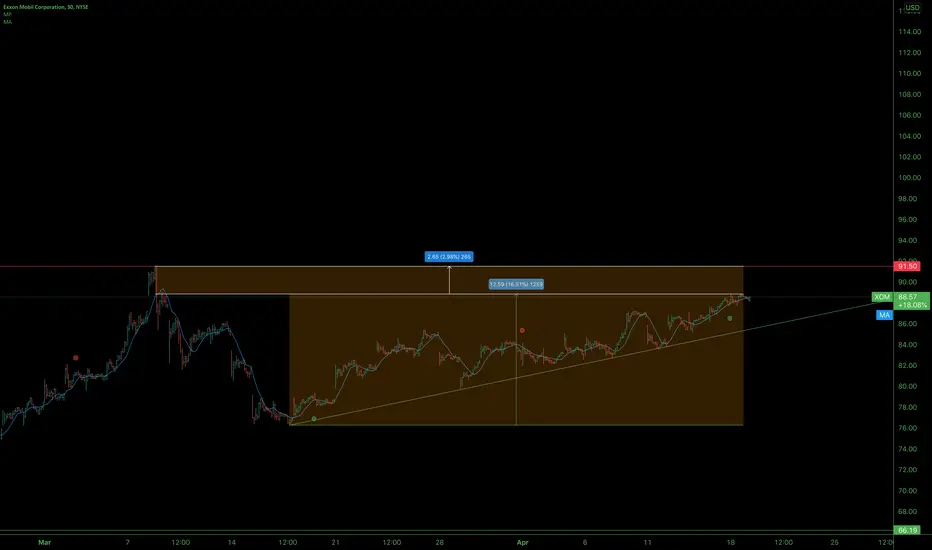
Long XOM - Retesting it's breakout level
Just an idea, but has sub 15 p/e and should be extra profitable this year..
XOM bear call vertical for 4/8XOM seems to be having a hard time getting going bullish, so I'd look for continued downside. Not hugely bearish but doesn't seem like it wasn't to go to the upside; for now. Snagging a bear call vertical for 4/8 at 82/85.

XOM bullishI have been showing many positions with bearish direction recently. This position is meant to be a hedge to many of those, and this is one of the very few I could find that look really good bullish. So going to do the Apr 1 84/86 bull call vert. I like the trade a lot but it is mostly to offset many of the shorts I have open, so I am making this position larger than normal.

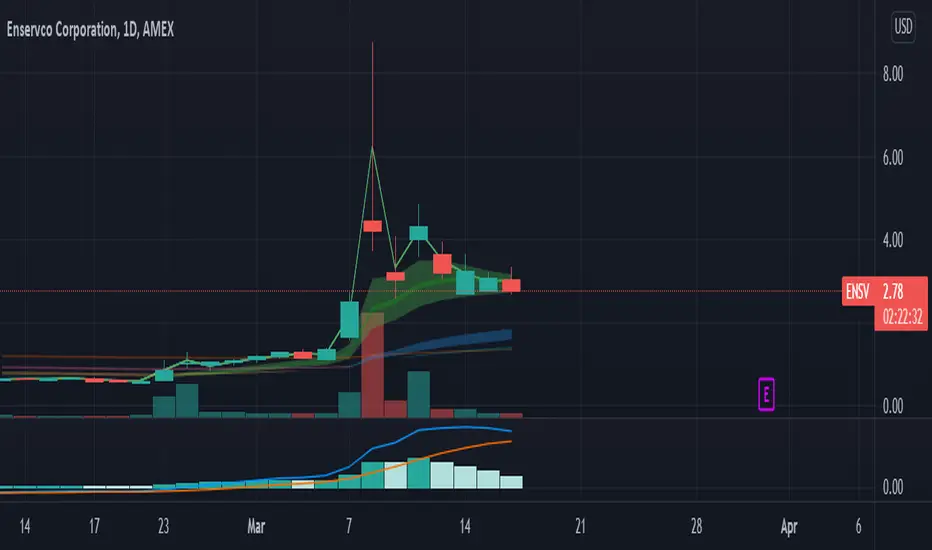
ENSV and Oil, Up Up and Away?I'm still researching, i.e. justifying my bag holding, XOM and NINE have both had good surprises for their earning reports. We'll keep an eye on the rest of the sector as they have earnings reported, but I suspect they are all going to be good surprises for a big win in the next week or two.
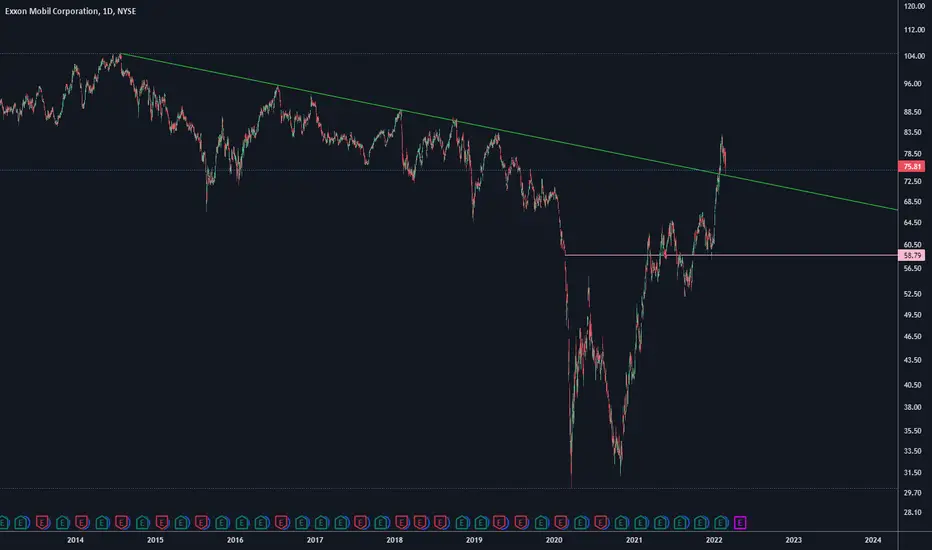
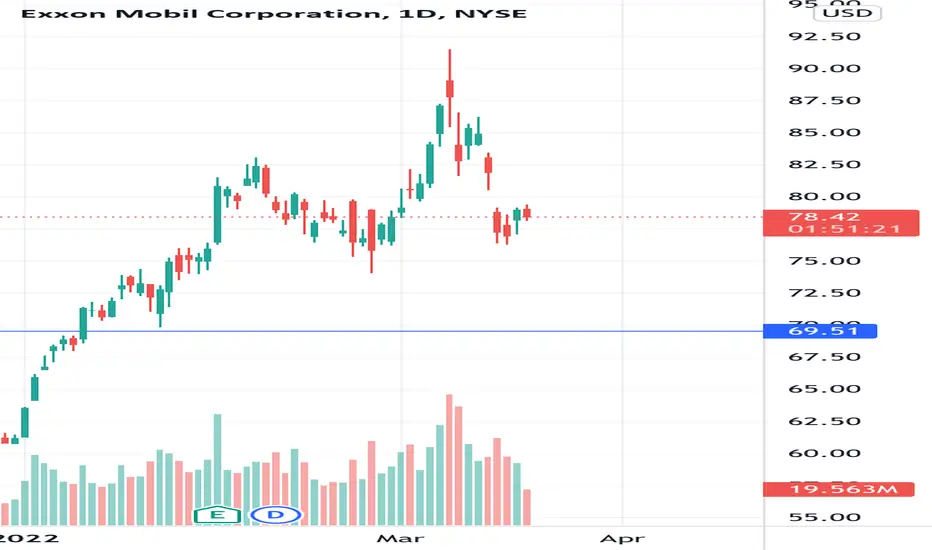
EXXON MOBIL CORPORATION show very good bullish signalEXXON MOBIL CORPORATION show very good bullish signal, if we break the resistance line, there is a high probability of the continuation of the trend.

3/13/22 XOMExxon Mobil Corporation ( NYSE:XOM )
Sector: Energy Minerals (Integrated Oil)
Market Capitalization: $359.517B
Current Price: $84.92
Breakout price: $83.00 (hold above)
Buy Zone (Top/Bottom Range): $82.90-$77.15
Price Target: $85.00-$86.20 (Reached), $98.00-$100.00 (2nd)
Estimated Duration to Target: 50-52d
Contract of Interest: $XOM 6/17/22 105c
Trade price as of publish date: $1.25/contract
