XPDUSD LONG - Buy Entry - D1 ChartXPDUSD LONG - Buy Entry - D1 Chart - Palladium
Buy @ Market
Symbol: XPDUSD - Palladium
Timeframe: D1
Type: BUY
Entry Price: Buy @ Market
TP - Resistance @ 3179.58
TP - BE - Resistance @ 2704.59
Support @ 2443.23
W1 Support @ 2300.05
PP Y1 - Pivot Point Yearly @ 2141.43
✅ If you liked this analysis, please consider Following and giving it a Thumbs Up 👍
✅ If you have any feedback or questions, please leave a comment below as I answer each comment 💬
✅ Wishing you enjoyable successful trading 🙏
Xpdusdanalysis

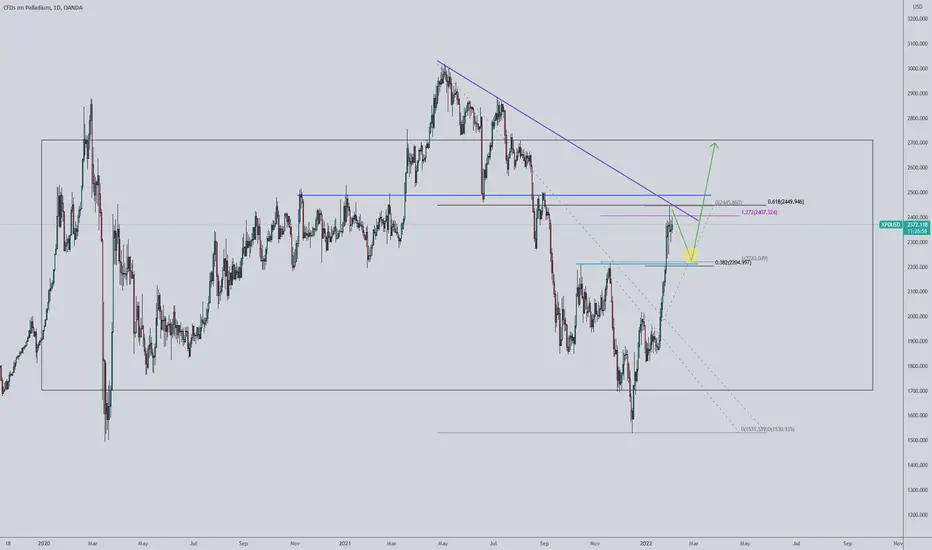
Palladium - a small short before the move higherPalladium has just provided three reasons why I will look for a retracement before looking for the long.
1. Market has reached a trend line connecting tops - 9 month span
2. Market has hit the 1.272 from high 18th Nov (double top) - low 31th Dec - the 1.272 is the pink line. Note: We need to take in to account the larger swing from Dec15 - present.
3. Market has hit the 618 of the last big swing from high May 21 - 31 Jan - the black line is the 618
From here we look for a pullback to the 382 that happens to be a strong support zone - light blue line
After the pull back we go LONG with an ABCD pattern and the top of our range box to reach our target.
XPDUSD LONG - Buy Entry - H4 ChartXPDUSD LONG - Buy Entry - H4 Chart
Symbol: XPDUSD - Palladium
Timeframe: H4
Type: BUY
Entry Price: Buy @ Market
Entry Price: Buy @ Limit 1747.61
Stop Loss: 1701.60
Take Profit: 1878.90
Take Profit: 1943.31
Major Resistance @ 1812.02
🔺 DISCLAIMER
🔺 For educational informational purposes only.
🔺 Analysis may change at any time without notice.
🔺 You must research and create your own trading plan.
