XPD/USD 4h analysis possible buy Hello everyone , as we all know the market action discounts everything :)
The XPD/USD seem to continue its movement in an upward channel, there are 3 different scenarios that am seeing the right now :
1_The price will drop down to the old resistance line which is the support line now at 2712.474 and then bounce back up and maybe breaking the new resistance line at 2747.800 which if that happen thats a great bullish mark , where we could use it to trade breakouts.
if you dont know what is a breakout then watch this
2_The price would continue the bullish movement and reaching the resistance line at 2747.800 and breaking out which could be a great buy opportunity
3_The price will reached the support line at 2712.474 and if the price breakout that support line it would be a confirmation that the price will drop down and it a possible sell signal
Using different indicators showing that the market is bullish so scenarios 1 or 2 is more possible then the 3 :
1_The market price is moving above the MA and EMA (bullish sign)
2_The RSI is at 64,99 showing strength is the market and could be reaching overbought zone at 70 (bullish sign)
3_The MACD seems to be gaining more momentum with the trend going through a positive crossover for now (bullish sign)
Support & Resistance points :
support Resistance
1_ 2719.46 1_2738.34
2_ 2710.04 2_2747.80
3_ 2700.58 3_2757.22
Fundamental point of view :
One-month risk reversal on Palladium (XPD/USD), a measure of the spread between call and put prices, not only snaps a two-day uptrend but also marks the heaviest fall since last Thursday, according to data source Reuters.
A call option gives the holder the right but not obligation to buy the underlying asset at a predetermined price on or before a specific date. A put option represents a right to sell. That said, the daily difference between them slumps to -0.012 by the end of Wednesday’s trading session, per Reuters.
The moves could be linked to the XPD/USD price performance that prints a three-day uptrend of around $2,650 by the press time of early Thursday.
As the options market signal favors the palladium bears, sluggish momentum amid the pre-ECB caution and a light calendar tests the commodity traders. according to fxstreet
_____________________________________________Make sure to Follow and Like for more content_____________________________________________
This is my personal opinion done with technical analysis of the market price and research online from fundamental analysts for The Fundamental point of view , not financial advice.
If you have any questions please ask and have a great day !!!
Thank you for reading.
Xpdusdsignals

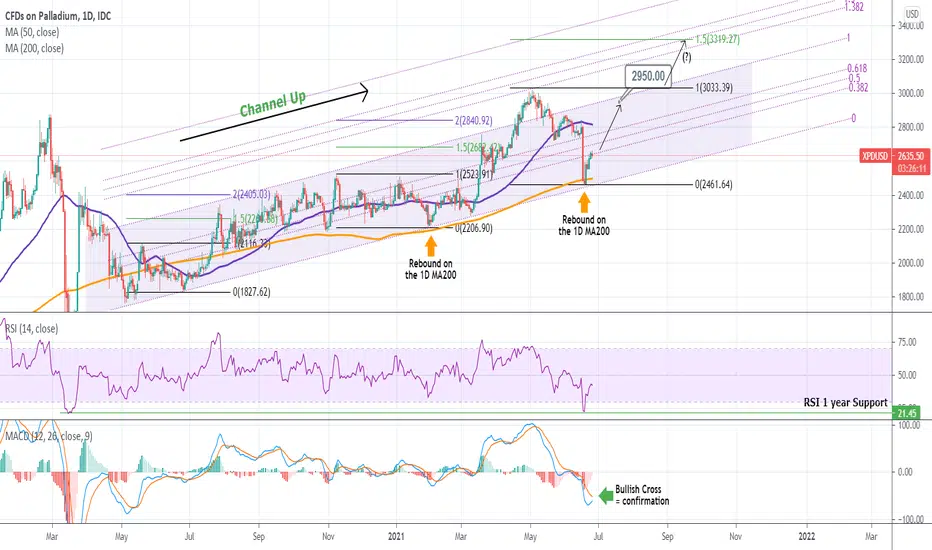
PALLADIUM Excellent long-term buy opportunityPattern: Channel Up on 1D.
Signal: Buy as the price is rebounding after hitting the 1D MA200 (orange trend-line) and the 1 year RSI Support. You can wait for the MACD Bullish Cross to confirm that.
Target: 2950 (top/ Higher High of the Channel Up) and 3300 in extension (1.5 Fibonacci extension as with previous Highs).
** Please support this idea with your likes and comments, it is the best way to keep it relevant and support me. **
--------------------------------------------------------------------------------------------------------
!! Donations via TradingView coins also help me a great deal at posting more free trading content and signals here !!
🎉 👍 Shout-out to TradingShot's 💰 top TradingView Coin donor 💰 this week ==> StockSwinger
--------------------------------------------------------------------------------------------------------
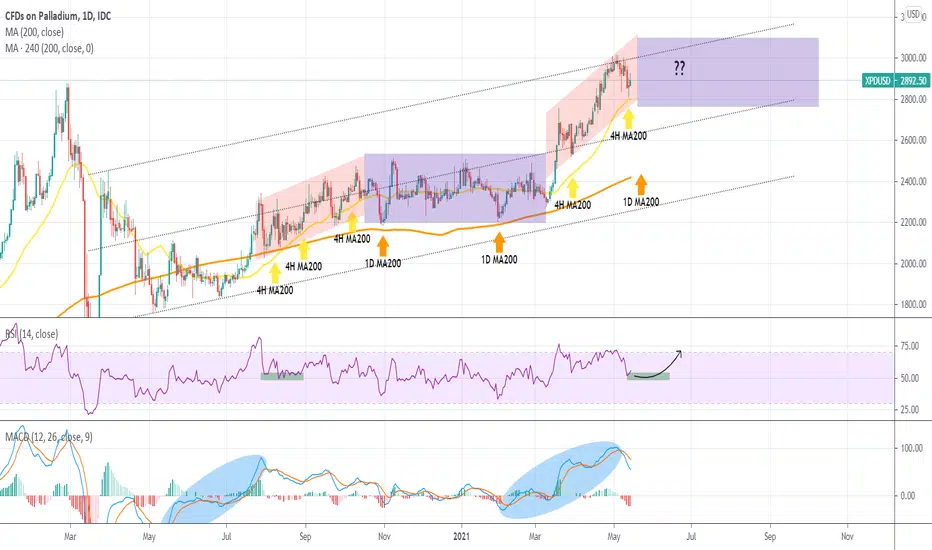
PALLADIUM Trade based on the 4H MA200 and the 1D MA200Pattern: Channel Up on 1D.
Signal: As long as the 4H MA200 (yellow trend-line) supports, buy the dips. If it breaks potential prolonged sideways action until the 1D MA200 (orange trend-line) approaches.
Target: Trade within the patterns that will be formed.
** Please support this idea with your likes and comments, it is the best way to keep it relevant and support me. **
--------------------------------------------------------------------------------------------------------
!! Donations via TradingView coins also help me a great deal at posting more free trading content and signals here !!
🎉 👍 Shout-out to TradingShot's 💰 top TradingView Coin donor 💰 this week ==> xBTala
--------------------------------------------------------------------------------------------------------
Great Hunting Opportunity In XPDUSDFriends, push the like button, write a comment, and share with your mates - that would be the best THANK YOU.
P.S. I personally will open entry if the price will show it according to my strategy.
Always make your analysis before a trade.

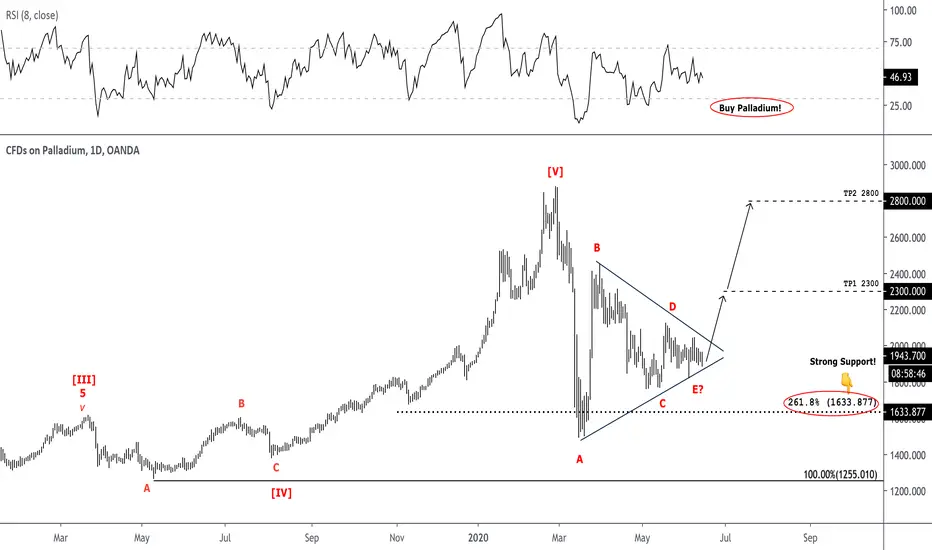
ridethepig | Palladium Market Commentary 2020.06.15Here the consolidation is condemned to break for the common good, as a diversionary sacrifice. Covid cases will act as the catalyst undoubtedly. The question is only and above all when?
For those tracking the breakout momentum is much more on the buyers side, clearly defined jurisdictions are on both sides of the map... As a quick cheatsheet: Strong Support (1635) <=> Soft Support (1750) <=> Soft Resistance (2300) <=> Strong Resistance (2800).
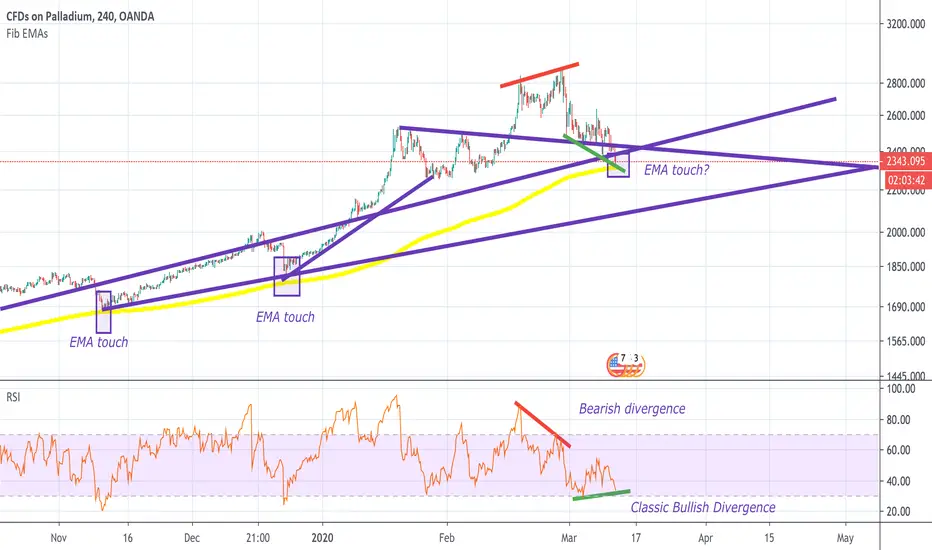
PALLADIUM maintaining bullish momentumPalladium has produced a bearish divergence, followed by a possible bullish divergence, yellow fib EMA has been a clear support for some time for this bull run, lets see if it holds again. Currently stuck in between a strong horizontal support.
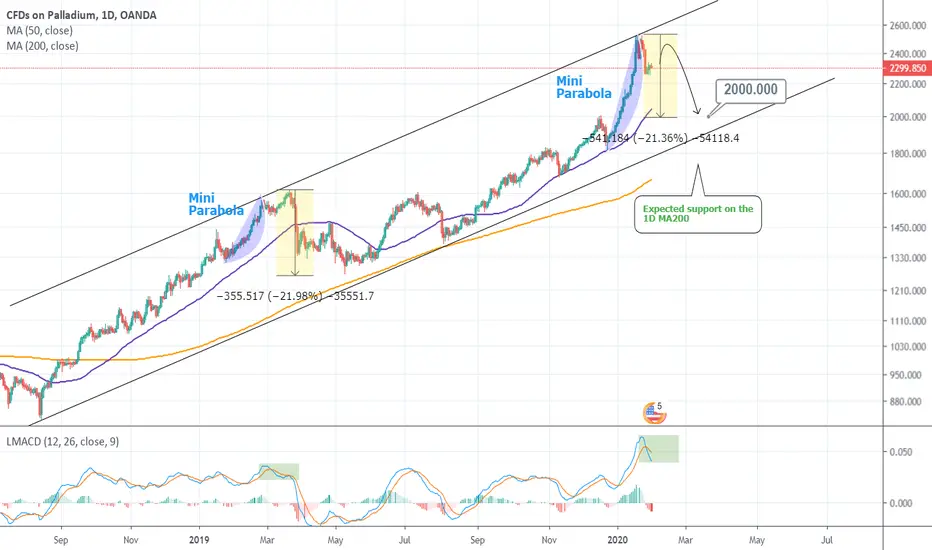
XPDUSD Sell SignalPattern: Channel Up on log 1M.
Signal: Bearish as tha parabolic rise within the Channel Up broke.
Target: $2000 (Higher Low of the Channel).
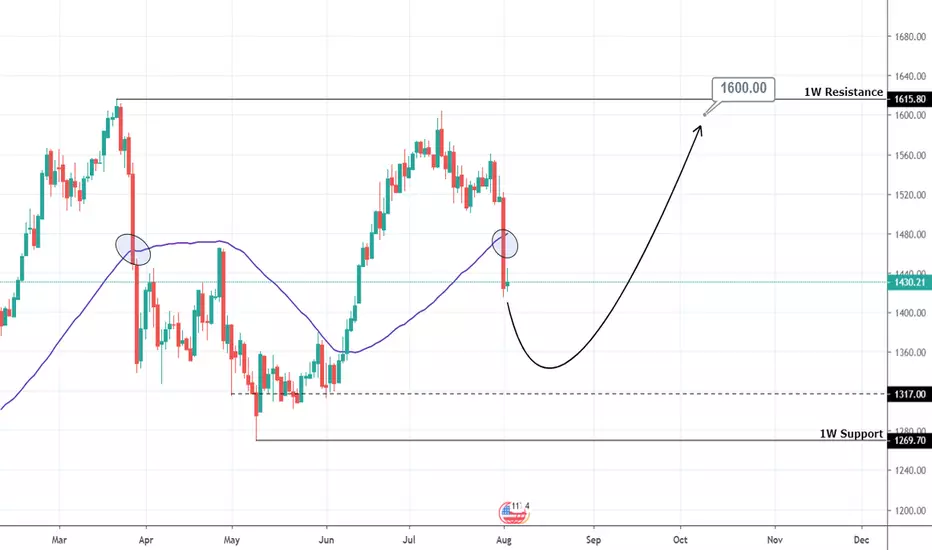
PALLADIUM Lower Buy SignalPattern: Rectangle on 1W.
Signal: Bullish once it approaches the 1W Support Zone.
Target: 1600 (right below the 1W Resistance Zone).
Palladium Ripe for A Fall..Once $1500 on the September futures breaks, I expect a quick and decisive fall to $1300. Additional things I see which makes this a high conviction trade:
1.) Seasonal pattern for XPDUSD is usually weak in mid-July until mid-August/early-September
2.) $1500 was a major breaking point in March as well. Once prices broke that level, the selling came in swiftly.
3.) The NYMEX futures CoT shows the commercials (smart money) is short around the same number of contracts just prior to the March crash as well.
4.) There was a marginal, new swing high in the futures but not in the cash market this month. Prices have since reversed back down off of the $1600 level quite rapidly. This tells me there are ready and willing commercial sellers at those higher levels thus capping prices further (for the time being).
5.) The contract margins for PA on NYMEX are over $12,000 for a 100oz. contract. This is reminiscent of Silver Futures in May 2011 just before the price peaked and promptly crashed..
There seems to be some intermediate support right around the $1300-$1275 level so I would look to cover there...
Thanks to @thunderpips for the 6H/4C chart idea..

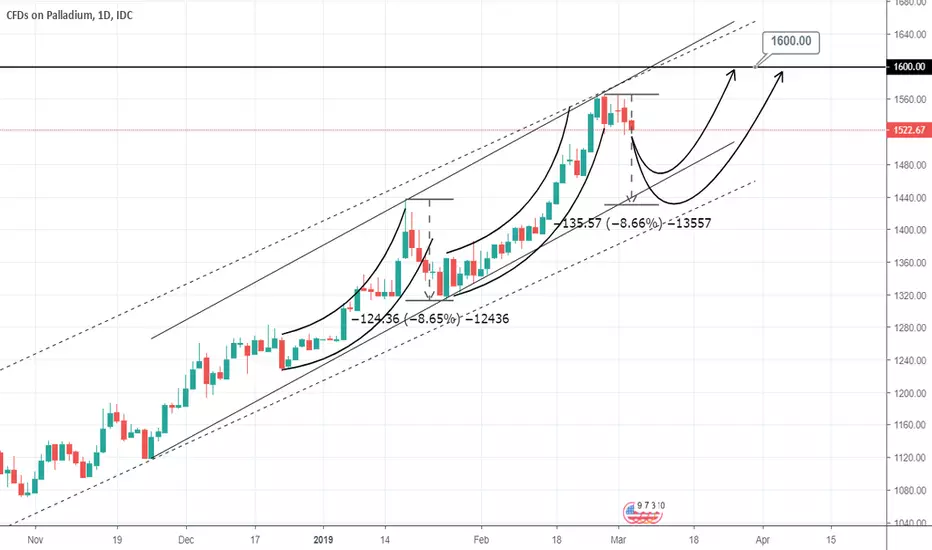
PALLADIUM Buy SignalPattern: Channel Up on 1D.
Signal: Bullish once 1) the price test the Higher Low and 2) completes a -8.65% pull back.
Target: 1600.