Xrp - It all comes down to this!🚀Xrp ( CRYPTO:XRPUSD ) has to break structure:
🔎Analysis summary:
After Xrp created the previous all time high in 2018, we have been seeing a consolidation ever since. With the recent all time high retest however, Xrp is clearly showing some considerable strength. It all comes down to bulls being able to push price higher, above the massive horizontal structure.
📝Levels to watch:
$3.0
SwingTraderPhil
SwingTrading.Simplified. | Investing.Simplified. | #LONGTERMVISION
Xrp

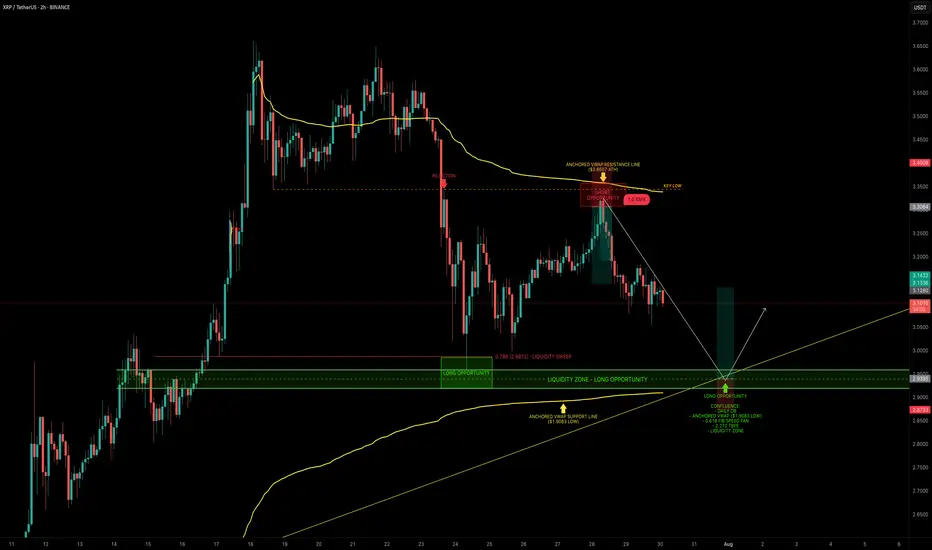
XRP — Mapping Out the Next High-Probability Long SetupXRP continues to respect key levels, delivering clean setups and strong technical reactions.
📉 Recent Price Action Recap
After the flush from $3.65 into the $3.00 support zone, XRP printed a solid bounce back toward the $3.30 resistance area, forming a clean short setup between $3.30–$3.35.
Price is now trading mid-range within the 6-day consolidation.
🟢 Next High-Probability Long Setup
A prime long opportunity lies between $2.96 and $2.9175 sitting within a key daily order block.
Confluence at this zone includes:
Liquidity pool just below the $2.9555 swing low
Anchored VWAP from the $1.9083 swing low resting just under the block
0.618 Fib Speed Fan lining up as dynamic support (July 30 – Aug 2)
2.272 Trend-Based Fib Extension at $2.9297
📈 Long Trade Setup
Entry Zone: $2.96 – $2.9175
Stop Loss: Below anchored VWAP (clear invalidation)
Target: $3.1/$3.13+
R:R: ~1:3+
💡 Educational Insight
This setup is a great example of how multiple tools layered together (like Fibonacci levels, VWAPs, order blocks and liquidity zones) can significantly increase the probability of a trade playing out.
When structure, volume-based tools and time alignment all point to the same area, it creates a high-confluence trade zone. These are the areas where risk is most defined and reward is most favourable, a principle every technical trader should anchor their strategy around.
_________________________________
💬 If you found this helpful, drop a like and comment!
Want breakdowns of other charts? Leave your requests below.
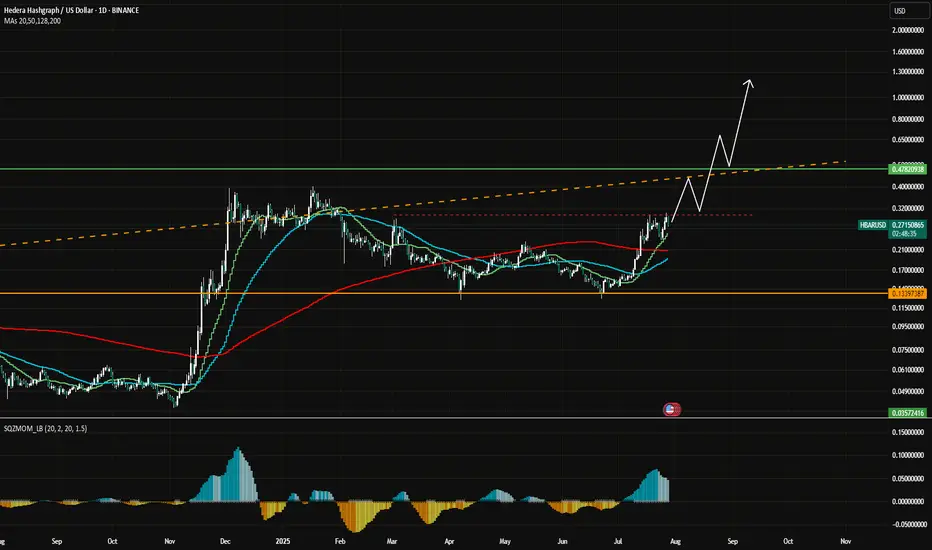
HBAR Momentum Hbar has gained some momentum lately. This is the ideal rally setup.
It has also yet to see real price discovery past .5
Large trade already opened.
DYOR, I believe this coin has a ton of potential.
Hederas' Council consists of entities like Google, IBM, Boeing Through VentureX, Standard bank.. Just to name a few.
But you all don't care about that.
Xrp - The final bullish breakout!💰Xrp ( CRYPTO:XRPUSD ) will create new all time highs:
🔎Analysis summary:
After a consolidation of an incredible seven years, Xrp is finally about to create new all time highs. With this monthly candle of +40%, bulls are totally taking over control, which means that an altcoin season is likely to happen. And the major winner will simply be our lovely coin of Xrp.
📝Levels to watch:
$3.0
🙏🏻#LONGTERMVISION
SwingTraderPhil

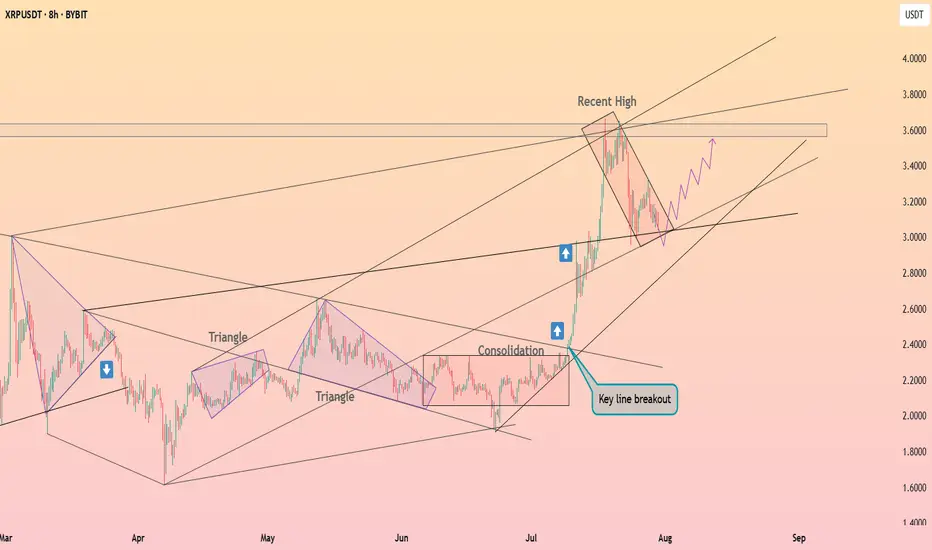
Xrp - This is the bullrun breakout!🔑Xrp ( CRYPTO:XRPUSD ) breaks the triangle now:
🔎Analysis summary:
After the recent bullish break and retest, Xrp managed to already rally another +100%. This is a clear indication that bulls are still totally in control of cryptos and especially Xrp. It all just comes down to the all time breakout, which will then lead to a final parabolic rally.
📝Levels to watch:
$3.0
SwingTraderPhil
SwingTrading.Simplified. | Investing.Simplified. | #LONGTERMVISION

SHORT ZONE-XRP structure shiftThere was an XRP structure shift last week.
📉 It’s been bleeding ever since.
Now, another bearish setup is forming.
If XRP nears that descending trendline and fails to break through — it enters the SHORT ZONE.
🚫 No breakout? No mercy.
This isn’t the end for CRYPTOCAP:XRP — but a purge may be necessary before liftoff.
A proper cleansing to prepare for the next ascension.
🫡 xrpArmy, forgive me…
But hey, feel free to earn your keep.
Stay Sharp. Regulate Yourself.
🚫 100% NOT financial advice.
🎭 Edutainment purpiz only.
XRP is testing a support ┆ HolderStatBYBIT:XRPUSDT recently broke out of a long consolidation and triangle setup, rallying into the 3.60 region. It is now forming a falling channel — a common bullish continuation pattern. Price must hold the 3.10–3.20 support area for a renewed move toward 3.80–4.00. The broader structure remains bullish until invalidated.
XRPUSDT → Range formation. Retest of resistanceBINANCE:XRPUSDT.P , after a false breakout of the daily resistance level of 3.352 and the elimination of traders, has entered a correction phase. The trading range shown below has been formed, with an emphasis on resistance...
XRP previously formed a false breakout of the daily resistance level of 3.352, as indicated in the idea above. After changing its market character, the price entered a correction phase. Focus on the range of 3.00 - 3.264. A retest of resistance (zone of interest and liquidity) is possible before falling to 3.161, 3.05 or to the liquidity zone of 3.00. There are no technical or fundamental reasons for exiting the consolidation; most likely, a retest of the zone of interest may end in manipulation and a pullback to support...
Resistance levels: 3.1609, 3.264, 3.352
Support levels: 3.05, 3.00
I do not rule out the fact that a retest of the 3.264 resistance level may have a breakout structure and the price will continue to rise, but based on the price behavior pattern on D1, the market structure, and market stagnation, I conclude that at the moment, the chances of seeing a correction from resistance are higher. Further developments will need to be considered after the retest of key zones on the chart...
Best regards, R. Linda!

Super bullish!! (I am not a XRP fan, but still) XRP is one of those cryptocurrencies that attract cult-like followers. I am not one of them.
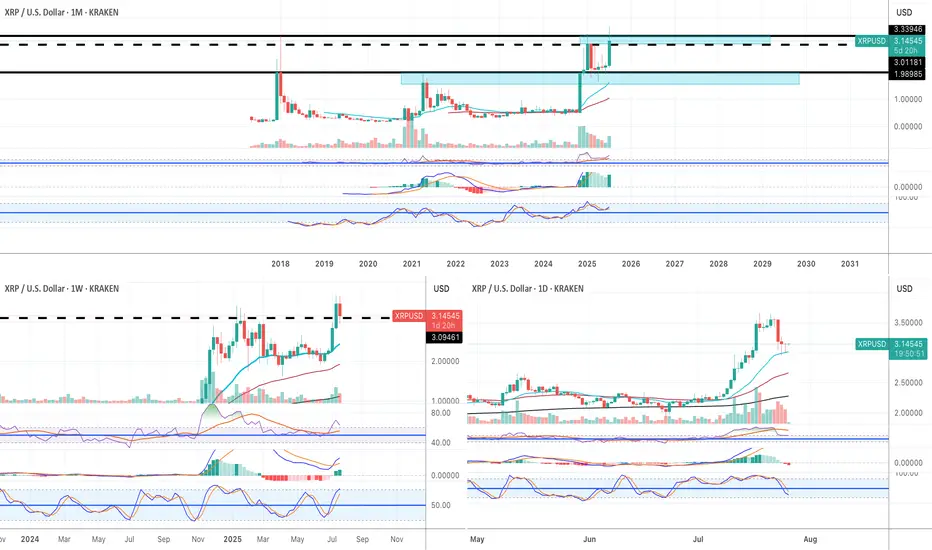
Fundamentally I have no idea about the long term potential of XRP. HOWEVER, purely based on technicaly analysis, it looks very bullish to me.
Monthly:
1) the price finally broke above the 2018 historical ATH.
2) All momentum indicators in the bull zone.
3) Both RSI and MACD are in the overbought territory but they can remain in the OB territory for weeks and weeks when the macro bull trend begins.
4) Stochastic lines have crossed to the upside in the bull zone.
Weekly:
1) all momentum indicators are in the bull zone.
2) The price broke above the historical ATH. It is going through pull back now, but, there is a strong buying pressure around $3.15.
Daily:
1) all momentum indicators have reached the overbought territory. The lines are now rolled to the downside, however, it is likely to be a corrective move.
2) the price is hovering above EMA21 where the recent price breakout happened on Thurs 17th July. I have been monitoring price action in lower time frames such as 5 and 15 minutes, and it looks like the price does not want to go below the previous historical high at this stage.
I am not very familiar with XRP, but purely based on the current price action, it looks very bullish. For the very first time as a trader/investor, I deployed my capital to buy XRP last Wed (just under $3.00).
I have already took some profit when it hit $3.60. But I am planning to sell 90% of my XRP when it reaches $4.50 and $5.00, and let the rest run just in case it goes to the moon😅.
Analytical Geometry Strategy Applied to the Market — XRP/USDTAnalytical Geometry Strategy Applied to the Market — XRP/USDT
Position Trader: Action Based on the Structural Geometry of the Metatron's Cube
Operational Introduction
In medium to long-term strategic positioning (position trading), market entry must not be random or emotional — it must be grounded in predictable zones of symmetry and imbalance.
For that, we apply Analytical Geometry to chart structure, using the Metatron’s Cube — a three-dimensional geometric figure composed of 13 spheres and 78 interlinked vector lines.
The cube is a projection from a six-dimensional hyperplane onto the 2D Cartesian plane. Its application on the chart allows us to:
Delimit areas of vector confluence (support/resistance)
Identify angular energy zones and technical pressure points
Anticipate critical price inflection points based on mathematical symmetry
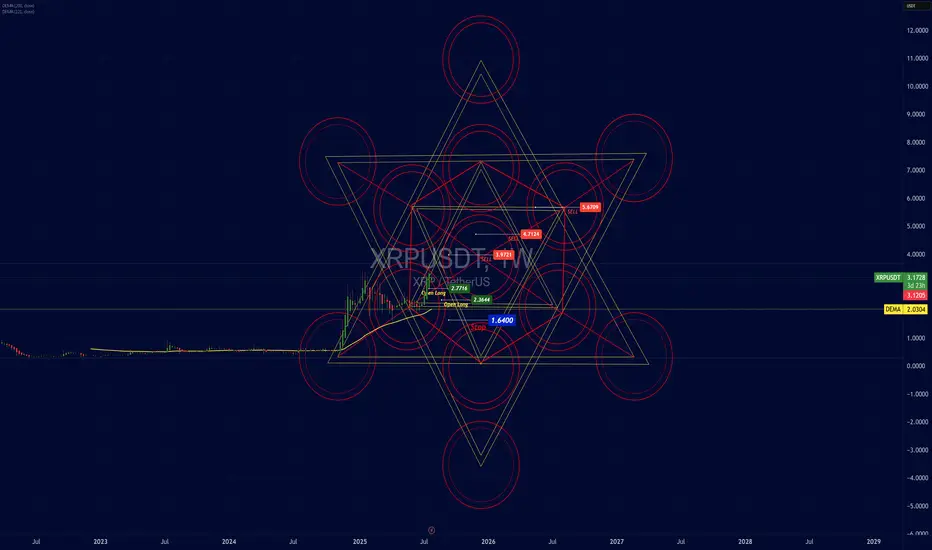
Structural Application on the XRP/USDT Chart
The projection of Metatron’s Cube onto the XRP/USDT chart reveals:
Entry points (Open Long) located at the lower inner vertices of the cube, where vectors converge toward the central axis — the liquidity attraction point
Supply zones (Sell) aligning with circular and angular intersections of the lines, where multiple vectors overlap — indicating movement saturation and possible redistribution
Stops placed below the angular base, representing a break in symmetry (the point where the vector loses cohesion with the model)
Structural Coordinates (Based on Vector Analysis)
Entry Points (Open Long):
Point A: (x = 2.6444, y = 0)
Point B: (x = 2.7176, y = 0)
Strategic Stop:
Point C: (x = 1.6400, y = -1), just below the lower angular base — a vector dispersion zone
Technical Targets (Supply Zones):
Level 1: x = 3.9721 (first circular layer)
Level 2: x = 4.7124 (72° expansion — common in golden ratio geometry)
Level 3: x = 5.6709 (structural exhaustion zone)
Technical Justification: Why Analytical Geometry Works
Analytical Geometry, developed by René Descartes, allows for the representation of curves, vectors, and spatial structures using numerical coordinates.
Metatron’s Cube functions as a vector mesh over the price chart — translating market behavior into a mathematical language of:
Proportions
Intersections
Angular projections
This approach enables us to:
Model price behavior as a multivariable function
Anticipate reaction zones based on angular and linear symmetry
Protect capital with stops anchored in vector-based rupture zones
Scientific Relevance
Metatron’s Cube is not merely symbolic — it remains actively used in modern physics and aerospace engineering.
At NASA, geometries derived from the Cube are applied to:
Orbital simulations
Spatial perimeter calculations on nonlinear geodesics
Angular mass distribution in interplanetary navigation systems
The same mathematical foundation used to understand celestial body dynamics is used here to identify repeatable behavior patterns in the market — with a high degree of precision.
Technical Conclusion
The market’s geometric structure is not random — it is vectorial, symmetrical, and proportional
Using Metatron’s Cube as a geometric projection allows for rational and coordinated alignment of entry, stop, and target points
The first target has already been validated, proving the structure’s effectiveness
The position remains active, with upper targets defined by vector intersections and angular saturation zones
Closing Insight
"The market’s geometry is the invisible code behind apparent movement. He who understands the vectors, masters the cycles."
This strategic model combines analytical geometry, energetic symmetry, and technical foundation in a unified framework — with precision, logic, and harmony.
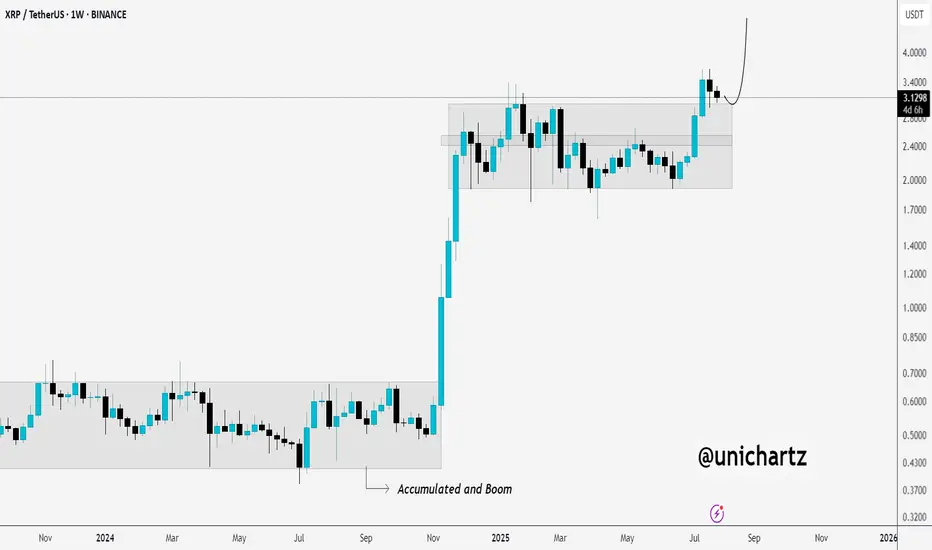
Healthy Retest After Explosive Move – XRP Eyes More UpsideCRYPTOCAP:XRP broke out of a long accumulation range and is now coming back to retest that breakout level, a classic and healthy move.
If this retest holds, we could see the next leg up kick off soon.
Accumulated. Broke out. Now confirming.
DYOR, NFA
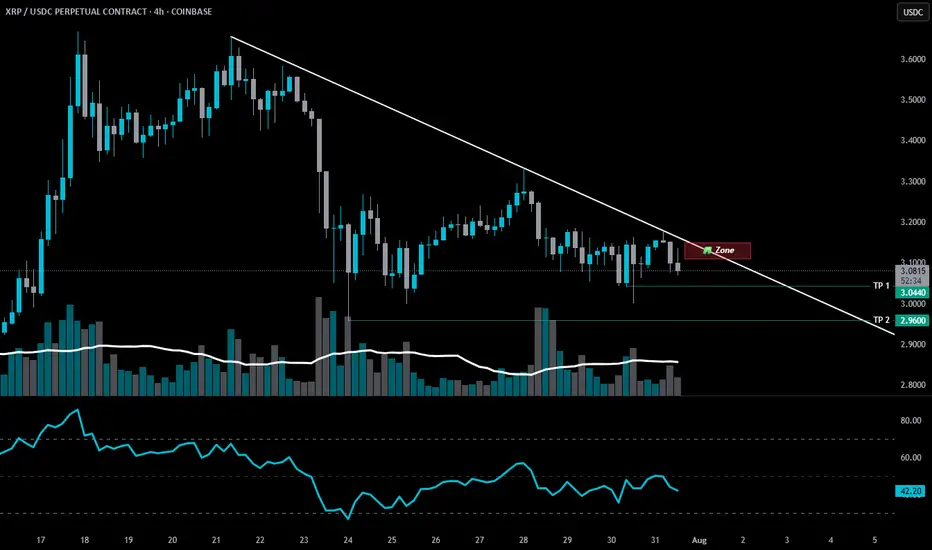
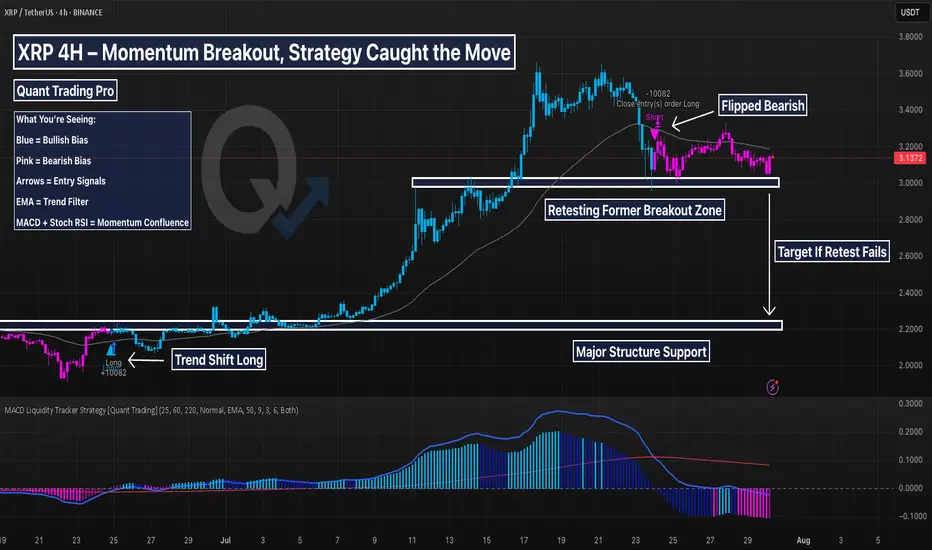
XRP 4H – This Strategy Nailed the Breakout & Tracking SupportThis XRP chart is a textbook example of the MACD Liquidity Tracker Strategy in action. After flipping bullish in late June, the system triggered a clean long and stayed in the move for over 100% before flipping bearish near the local top.
The system didn’t chase or guess — it followed clear logic:
MACD momentum confirmed
Trend aligned with EMA
State flipped blue → long triggered
Exit near top when momentum shifted
Now, XRP is in a bearish state, retesting its prior breakout zone. The MACD histogram remains below zero, and price is below the trend filter — indicating caution. But this is exactly where strategy traders prep for reversals or continuation.
🔍 Highlights:
Clean +100% trend catch
Momentum shift = smooth exit
Currently respecting support = decision zone
Still in “wait” mode — no guessing
This system shines when volatility expands. Perfect for trend traders who want clarity and control — and ideal to backtest.
ETF News Meets the Charts: ETH, BTC, XRP, and SolanaFirst you probably want to watch this video:
📊 ETF News Meets the Charts: ETH, BTC, XRP, and Solana 🔥🚀
The SEC’s new in-kind ETF ruling is a macro-level reset. But as always — we bring it back to the charts 📉🧠
Here's the visual breakdown of what I'm watching and why:
🏛️ ETF Approval = Real BTC/ETH Usage Starts Now
✔️ ETF issuers can now create/redeem with actual Bitcoin & Ethereum
✔️ Real spot demand, better arbitrage, and tighter price tracking
✔️ TradFi goes crypto-native — this changes how ETFs settle
But the market? Shrugged.
That’s why we watch price structure — not headlines alone.
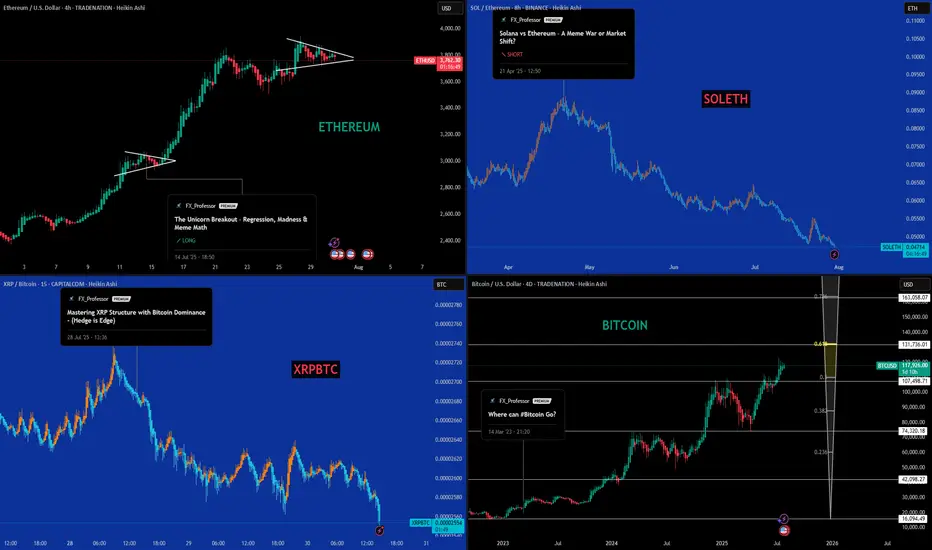
📈 What the Charts Are Telling Us:
🔷 Top Left – Ethereum (ETHUSD)
Breakout triangle forming after the unicorn setup at $2,912.
Momentum building for the third breakout attempt at $4,092
🔥 Fuse lit. Target: $6,036
🔷 Top Right – SOLETH
Solana bleeding against Ethereum — just as forecasted months ago.
Rust tech, but memecoin dilution is hurting its institutional appeal. Solana will keep paying for their mistakes and damage done to Crypto!
🔷 Bottom Left – XRPBTC
Wedge breakdown playing out. XRP continues underperforming.
This chart was paired with a BTC dominance hedge — and dominance rose right after. XRP and dark pools is something I will cover..No, i don't like XRP, sorry.
🔷 Bottom Right – Bitcoin (BTCUSD)
Fib extension points to next possible macro leg:
🚀 0.618 = $131,736,
🟡 Final cycle target zone near $163K (or more? or 130k max?..we will find out)
🇨🇳 China: Rumor or Tumor?
Unconfirmed sources say China may be prepping a Bitcoin move. But let’s stay grounded:
🧠 It’s a rumor. Or a tumor.
There’s a 40% chance we get bad news instead — so keep your expectations realistic.
Still, if true, it could mean:
BTC in reserves
Regulated mining zones
Digital Yuan–BTC integration
🧯 Nothing official yet. But timing near the BRICS summit makes it worth watching.
🧠 Key Altcoin Narratives:
🔹 Ethereum L2s (ARB, OP, BASE) – ETF gas pressure = L2 scalability play
🔹 DeFi (UNI, AAVE, LDO) – TradFi flows into real DeFi utility
🔹 Staking Derivatives (LDO, RPL) – Institutions love yield
🔹 Oracles (LINK) – Real-time price data needed for ETF tracking
🔹 BTC Bridges (ThorChain, tBTC) – Infrastructure plays if BTC moves on ETH rails
🚫 What I’m Not Touching:
❌ Memecoins
❌ GameFi
❌ Ghost Layer 1s
📽️ Full breakdown is in my latest video — check it out from the video ideas tab for full context.
Stay sharp. Stack smart. Structure > noise.
One 💙 Love,
The FX PROFESSOR
Disclosure: I am happy to be part of the Trade Nation's Influencer program and receive a monthly fee for using their TradingView charts in my analysis. Awesome broker, where the trader really comes first! 🌟🤝📈
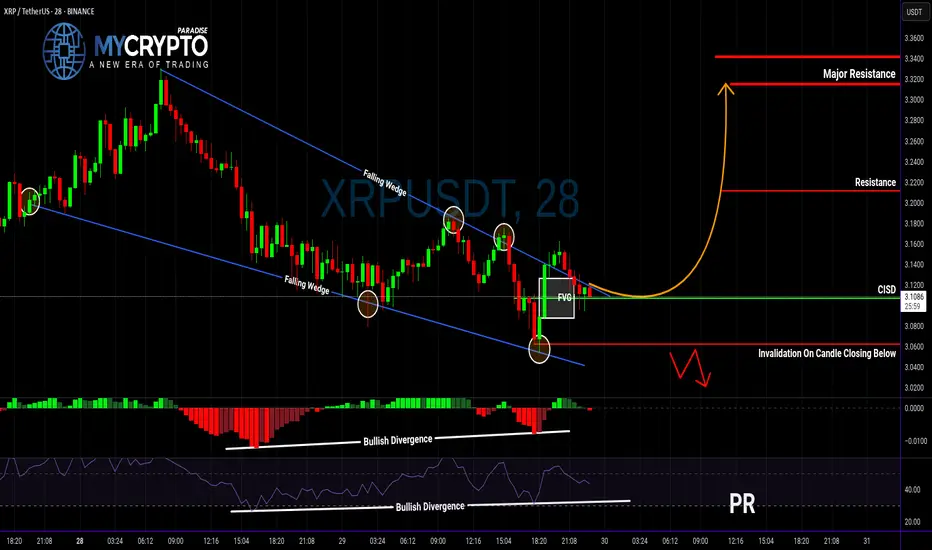
XRP Breakout Could Be a Trap… Or the Start of Something Big?Yello, Paradisers — are you about to buy into a fake breakout or position yourself right before a major move? Let’s break it down before emotions take over.
💎XRPUSDT has officially broken out of a falling wedge — a classic bullish reversal structure. What makes this breakout even more interesting is that it's supported by bullish divergence on both MACD and RSI, plus a Change In State of Delivery (CISD). All these technical signals combined significantly increase the probability of a bullish continuation.
💎Now, if you’re a disciplined trader looking for a safer entry with a higher risk-to-reward ratio, the smart move is to wait for a potential pullback to the CISD level. That would set up an opportunity offering a risk-to-reward of over 1:2.55 — not something you want to ignore.
💎But don’t get too comfortable…
💎If the price breaks down and closes below our invalidation level, the entire bullish idea is off the table. In that case, it’s wiser to stay patient and wait for clearer price action to develop. No emotional entries — only strategic moves.
🎖Strive for consistency, not quick profits. Treat the market as a businessman, not as a gambler. That’s how you’ll get inside the winner circle.
MyCryptoParadise
iFeel the success🌴
XRP held the support line ┆ HolderStatBINANCE:XRPUSDT is holding above $0.685 support after a correction from recent highs. Price is stabilizing inside a horizontal channel, with buyers defending the bottom of the range. A clean push above $0.70 would reopen the path toward $0.75. The market is at a decision point with strong reactions at both ends of the range.
XRP 4H — Resistance Flipped to Support, Will Bulls Step In?XRP is pulling back into a key structure zone — the same area that acted as breakout resistance during the July rally is now being retested as support. With momentum resetting and price consolidating on top of this level, the next move could set the tone for the rest of August.
📊 Technical Breakdown:
Structure Retest:
Price is holding between ~$3.00–$3.15 — a major former resistance zone now acting as support after July’s vertical move. Buyers previously stepped in hard above $3.00, and this is the first proper retest since the breakout.
Stochastic RSI:
Deep in oversold territory on the 4H timeframe. Any bullish crossover from this zone would align with a bounce scenario from support.
Volume Context:
Declining volume on the pullback suggests a lack of aggressive selling — a common characteristic before continuation if the level holds.
🔍 What to Watch:
✅ Bullish Setup:
Hold and bounce from this support zone
Break above local highs at ~$3.45 could trigger fresh upside
❌ Invalidation:
Clean close below $3.00 support would shift structure short-term and suggest a deeper retracement (e.g. $2.75–2.85 zone)
XRP often moves in bursts — and this chart has the same setup vibes as the last big leg. If support holds here, don’t be surprised if it’s the ignition point for another breakout.

Act Bust on My Radar: Long-Term Vision, Short-Term Target!Hey folks 👋
I’ve put together a solid analysis for a promising token: **Act Bust**.
Whether it hits my entry level or not, I’ll be holding this token long-term.
Right now, the target is set at **0.10146**—once we get there, I’ll update you all.
Stay tuned, and trade smart 💼🚀

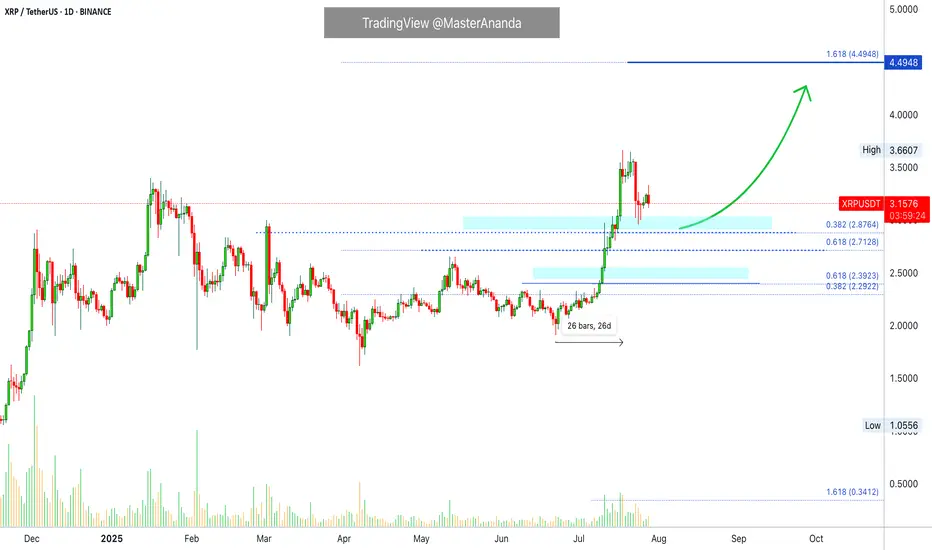
XRP Update · What To Expect Short-TermRetraces should be considered a buy opportunity. It is the only time when prices are not rising. Whenever there is a stop, a retrace, that is an opportunity to enter or buy more before the continuation of the bullish trend.
XRP started its latest major advance 22-June growing for 26 days straight peaking 18-July. there were only two red days in the entire move. This is certainly a strong advance and resulted in a new all-time high. More than 90% growth. After a strong move, there is always a pause, or correction or retrace.
A retrace can last a few days. Seeing this chart, here it can even last for weeks as I see no hurry on this chart. Prices can consolidate at support before the next advance. Some small swings are expected but nothing big and always knowing that the end result will be an advance going further toward $4.44. The bigger picture.
Do not try to SHORT within a retrace or even correction. It can lead to disaster. It is better to wait for support to show up and once confirmed buy LONG. The upside has no limitations while the downside is limited. It is harder and carries more risk, even more now that the market is bullish and people are starting to wake up. People can see the development of a major rise now, people are becoming aware and soon there will be a rush. This rush will fuel the next wave of growth.
XRP can consolidate for a little while after finding support before reaching higher. Market conditions remain strongly bullish for this pair. If support breaks, things can change.
Namaste.
XRP MACD Liquidity Tracker Strategy – Clean Trend Catch (4H)This backtest showcases how the MACD Liquidity Tracker Strategy handled a major trend shift on XRP’s 4H chart. The long was triggered once MACD momentum aligned with the 60/220 EMA trend filters — clean confirmation without noise.
The system stayed with the move through a multi-day rally and exited as momentum began to fade. Visual bias (blue = long, pink = short) made trend context easy to follow, and the settings ensured no premature signals during consolidation.
📊 Strategy Inputs:
MACD: 25 / 60 / 220
Trend Filter: 60 & 220 EMA
System Type: Normal
A great example of how combining momentum + trend confirmation filters can remove second-guessing. This is Backtest Idea #1 in a 10-post strategy series.

Mastering XRP Structure with Bitcoin Dominance - (Hedge is Edge)📉📊 Mastering XRP Structure with Bitcoin Dominance - Educational Breakdown 🧠💡
Hey traders! FXPROFESSOR here 👨🏫
From now on, my TradingView Crypto posts will be 100% educational only . I won’t be sharing target charts or trade setups here anymore. Why? Because even with the best chart, most traders still struggle to execute properly. So instead, I’ll teach you how to think, read, and act like a real trader.
👉Let’s jump into today’s educational case:
🔍 Chart 1: XRP/BTC
We're facing a clear resistance zone around 0.00002780, rejecting after several tests. There’s also a wedge pattern forming, suggesting a drop is likely — possibly toward 0.00002690 or even further to the unchecked support at 0.00002469. That’s a 9.4% move — but remember, this becomes invalidated if XRP breaks back above 0.00002780.
🔍 Chart 2: Bitcoin Dominance
Dominance is sitting right on support. If BTC dominance rises, it means Bitcoin could gain strength relative to altcoins. This typically leads to:
BTC holding steady or rising
Some major Alts (like XRP) might correct
Watch this carefully — a BTC dominance rebound strengthens the XRP short thesis.
🔍 Chart 3: XRP/USD
XRP/USD is moving inside a large wedge formation. The current rejection level is around $3.34, with price possibly aiming for $2.88 or lower if the wedge plays out. Until we break above that resistance, the bias remains bearish.
🎯 Strategy Insight – The Hedge
What’s a calculated way to play this setup?
→ Go long Bitcoin (dominance at support)
→ Go short XRP (at resistance)
This way, you hedge your exposure while staying aligned with market structure. This is not financial advice — but a great exercise in developing strategic thinking.
📌 Remember: Managing the position is a whole different skill — one that you must learn through real-time practice and proper mentorship. But the charts today give you valuable food for thought to sharpen your edge.
Let’s stop gambling and start thinking like traders. No hype. No signals. Just structure, context, and logic.
One Love,
The FX PROFESSOR 💙
Disclosure: I am happy to be part of the Trade Nation's Influencer program and receive a monthly fee for using their TradingView charts in my analysis. Awesome broker, where the trader really comes first! 🌟🤝📈

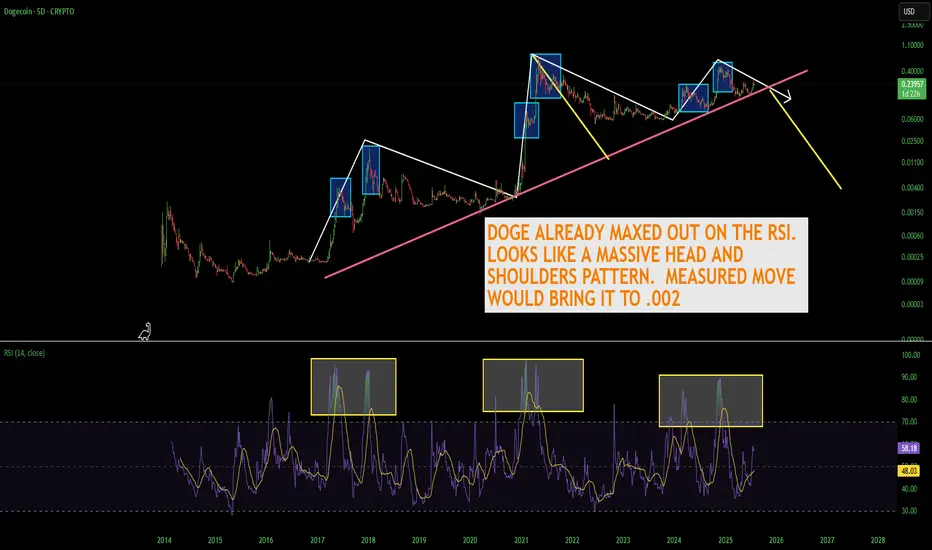
THE TRUTH ABOUT DOGECOINDogecoin is looking really toppy. As you can see the RSI has peaked out early before a new high which is alarming. I think Doge is in serious trouble here as the meme craze starts to shift into newer memes. If the head and shoulders pattern plays out you're looking at a catastrophic drop down to 2 tenths of a penny. Doge is EXTREMELY overvalued and needs to come back down to earth. Don't forget there is close to 15 million Doge mined per day forever. It appears with the way the RSI peaked and price didn't break the high that Doge has reached a plateau in price even if the market cap continues to go up.
Not financial advice just my opinion.
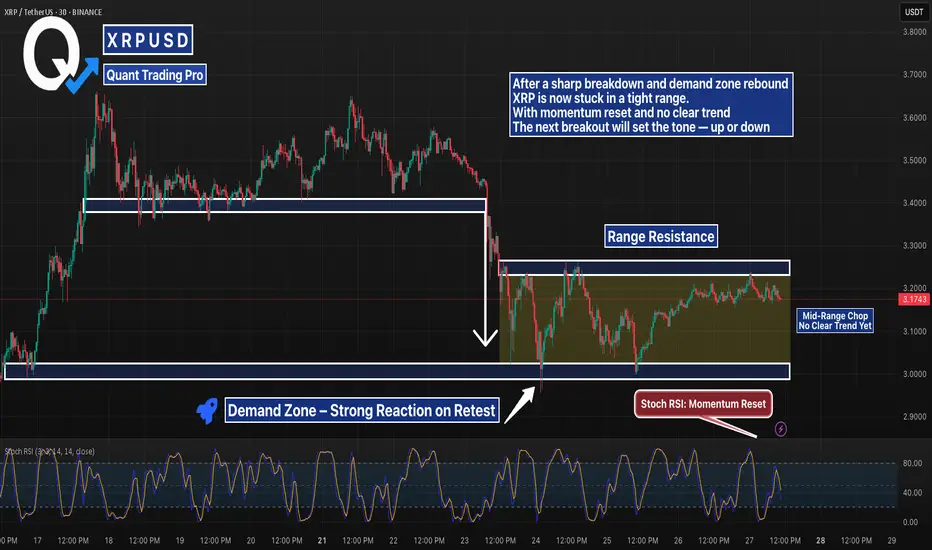
XRP Range-Bound After Breakdown — Compression Before Expansion?XRPUSDT 30m chart paints a neutral picture after a strong rejection from mid-range support last week. Price flushed into the $3.03 demand zone and bounced hard — but has since stalled and formed a tight sideways range between $3.03 and $3.25.
Momentum has reset (Stoch RSI near midline), and the market is clearly undecided. Structure currently favors neither bulls nor bears — and volume is thinning. Traders watching for a breakout from this compression box may catch the next directional move.
Key zones:
$3.25 = Range resistance
$3.03 = Demand zone
Mid-range chop = No-man’s land — best to wait for confirmation
Neutral bias until range breaks.
#XRP Update #3 – July 27, 2025#XRP Update #3 – July 27, 2025
XRP once again found support from the previously tested K-Level zone, completing its correction and beginning a new upward move for a healthier rally. However, the recent candles show a very low-volume market. With such low volume, it may be difficult for XRP to continue rising. If this upward move takes too long, it could lead to a pullback in XRP.
XRP must not break below its last low at the $2.85 zone. If this level is broken, the next potential support is around $2.60. However, there isn't strong support at that level.
Since XRP has completed its correction, if it wants to continue its move, the target is $3.93. From the current price, this represents a potential rise of around 22 percent. But it must be noted that there is strong resistance at $3.67. This level should be broken with a strong candle.
At this stage, those who prefer to wait can consider opening a position in XRP. Personally, I will not be using a stop-loss and will instead aim to reduce my average cost by accumulating from lower levels. As seen in the chart, an entry can be made at this stage. But remember, proper capital management is key. Since I have funds to buy lower and average down, I won't be using a stop. You should define a stop level suitable to your own budget.
