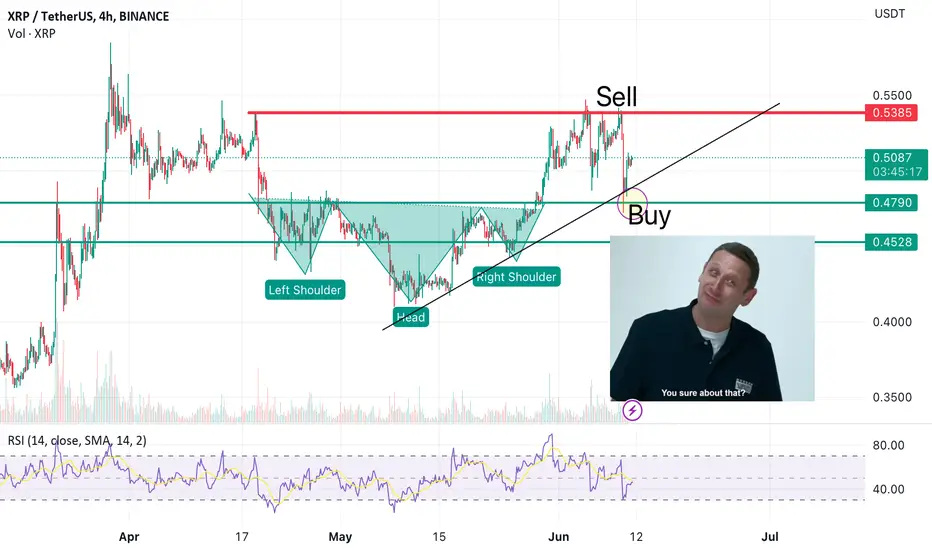
You sure about that?I was pretty sure on this retrace as we see it hit the target areas like clockwork.
I’m pretty sure the buy is a good entry point with a continue slow and steady increase back to the sell point.
Once we hit $0.53 again we may see one more retrace back to the black support line. Followed by support and an exponential increase in price to $0.58 will have a little resistance but hodl through it for the push past $0.60 all the way to $0.68 and potentially push to $0.76 before some selloffs occur.
Good luck and have fun with it
XRP-USDT
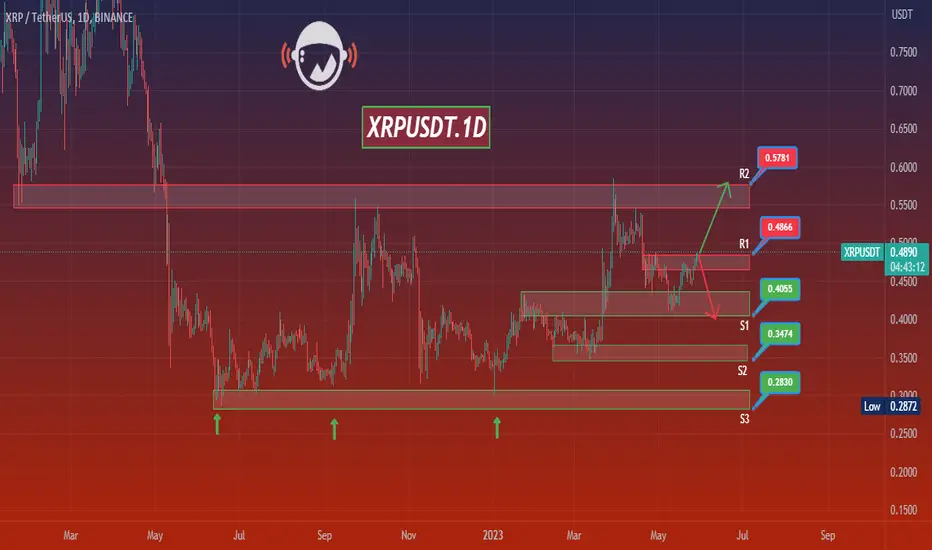
XRPUSDT.1DHello dear friends,
*Mars Signals Team wishes you high profits*
This is a daily time frame analysis for XRPUSDT.1D
We are in the daily time frame. According to the previous analysis, the price was able to move towards our first resistance zone. But currently, we have two scenarios in mind, which we have shown you with guide arrows. There is a possibility of an increase in the price, but it is better to retest the price to the desired area and if it stabilizes, then enter into the transaction.
Warning: This is just a suggestion and we do not guarantee profits. We advise you to analyze the chart before opening any positions.
Take care
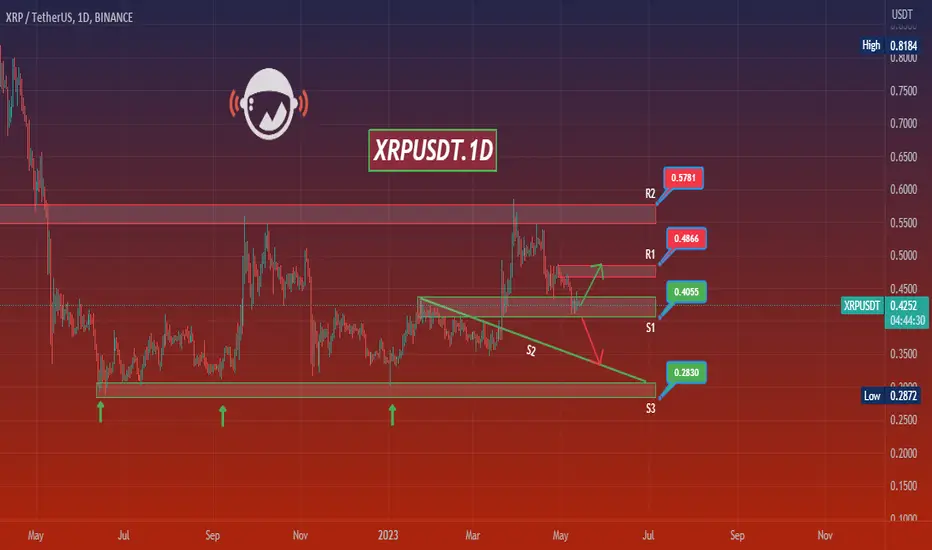
XRPUSDT.1DHello dear friends,
*Mars Signals Team wishes you high profits*
This is a one-day-time frame analysis for XRPUSDT
After hitting our second resistance line, the price entered the correction phase. Currently, the price is testing its first support zone and we expect the price to be supported and move towards its next resistance zone. But if the price is not supported, it can move towards its second support line. We have to wait for price reversal patterns.
Warning: This is just a suggestion and we do not guarantee profits. We advise you to analyze the chart before opening any positions.
Take care
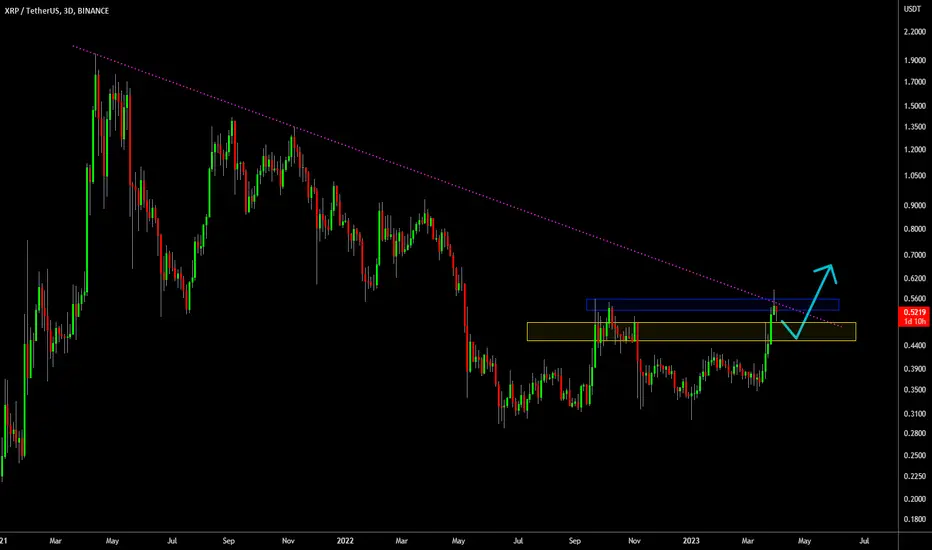
🔥 XRP Reversing From Bear-Market Resistance: End Of Trend?Recently I've mad a couple of analyses on XRP and the huge trend it was in, see below. Congratulations if you followed my last two analyses, all targets have been hit!
As expected in my previous analysis, XRP is encountering heavy resistance around the Summer-2022 top and the dotted purple resistance line.
In case we stay bearish, I'm looking at the yellow area for a potential reversal to take place. On the other hand, we can very well break out bullish in the coming week. This could be the start of a further run-up towards $0.70 or so.
🔥 XRP Triangle Break Out: Will It Go Up?After an initial massive bull move, XRP's price action has dies down a little, until it shot up again this morning.
That break out is exactly what the bulls want to see; bullish continuation after a time of consolidation.
However, BTC's chart does not look great at all at the moment. So, I'm going to wait until XRP can break out of the yellow box on the topside before considering a bullish entry. Patience is key.

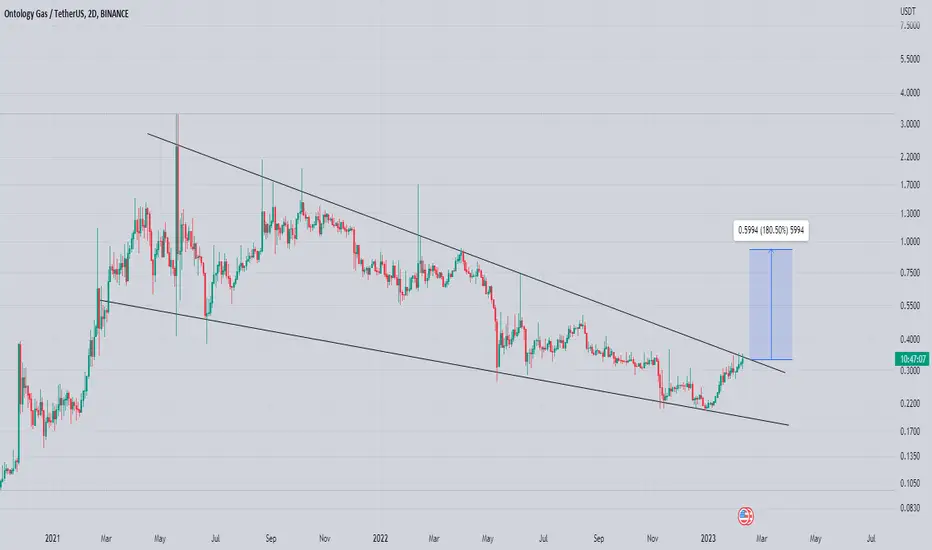
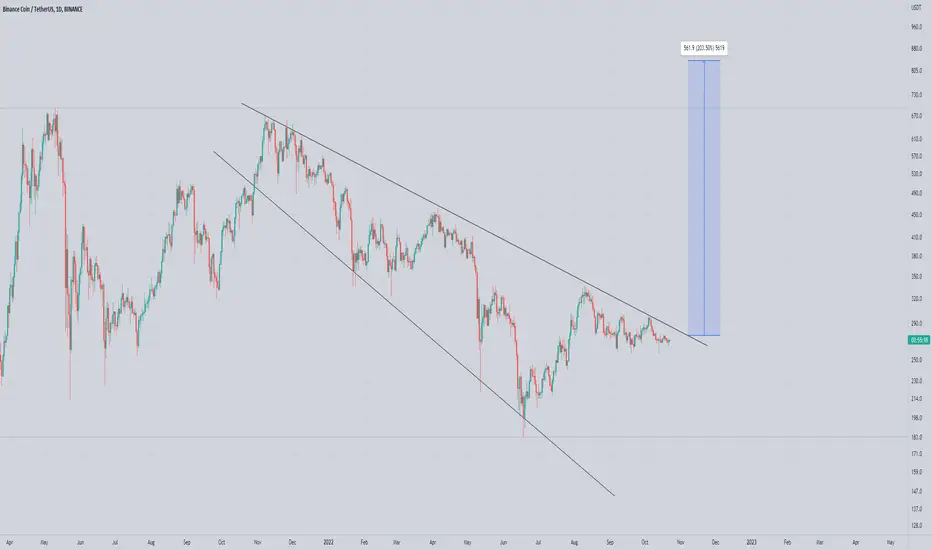
Ong Looking Good For Midterm Seems Like Ong Bottomed Out & formed Falling Wedge In 2Day Timeframe
Incase Of breakout Expecting 170 to 180% bulish move
Atausdt Breaks Falling Wedge In daily Timeframe Breakout Has Already Done
For Perfect Entry I Would Love To Enter On Retest
Expecting 200% bulish Wave In Midterm

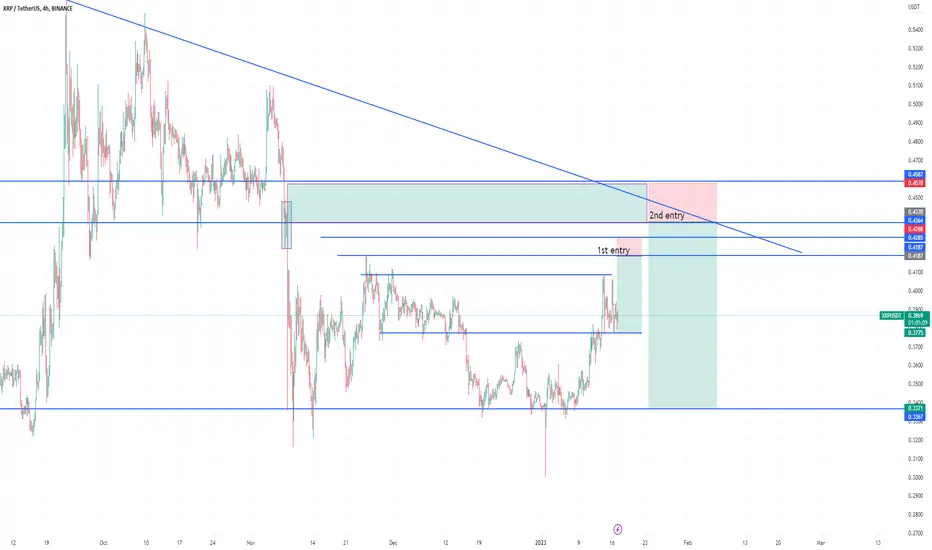
xrpusdt for short entrytrade at your own risk with your proper money management. bla bla bla blaaaaaaaaaaa
1sr entry sell
2nd entry sell
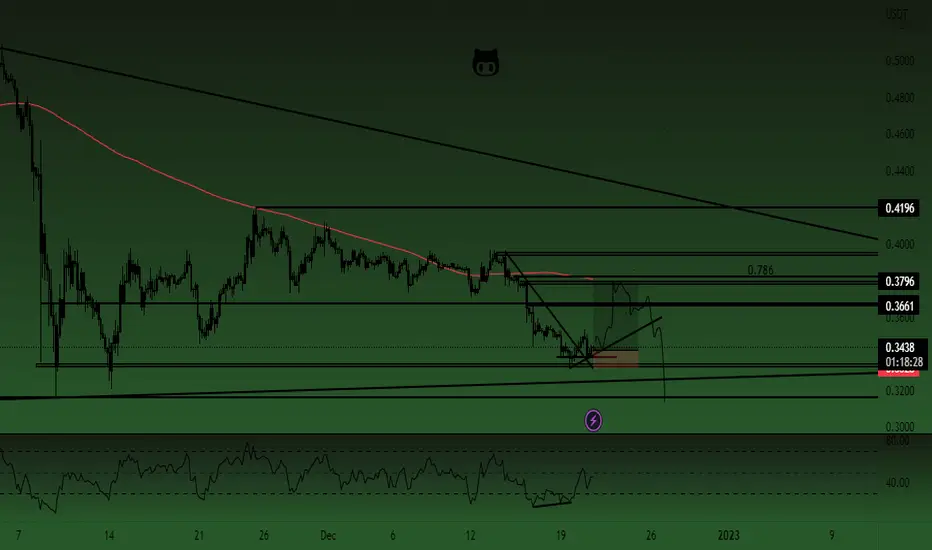
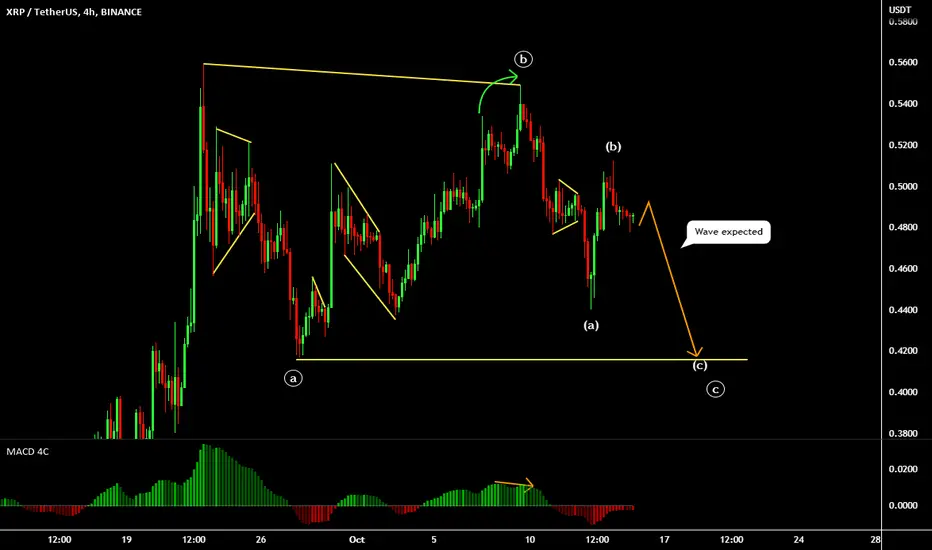
#xrp $xrp four hourly long play divergence on the four hour and lower is good enough for a long play here before lower lows.
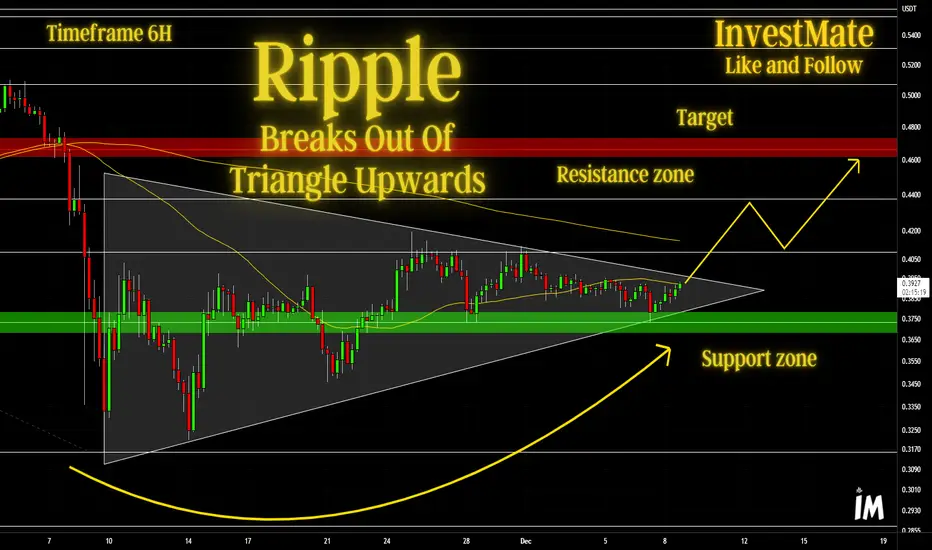
InvestMate|Ripple Breaks Out Of Triangle Upwards💲💲Ripple Breaks Out Of Triangle Upwards
💲Looking at the general situation on most cryptocurrencies, it's not hard not to feel an upward wave coming.
💲That will also be the case on one of the more important cryptocurrencies that is Ripple.
💲Looking at the formation it has formed over the last month, it is not hard to guess what this accumulation process could lead to in the future.
💲Many times we have defended the support zone determined by the 0.236 level of the downward wave from the peak on 22.09.2022 to the bottom on 09.11.2022.
💲The nearest significant resistance zone is the level 0.618 of the whole downward wave of the same as the support zone.
💲This is where I expect the price to reach.
💲The scenario I'm playing is a breakout from the triangle formation upwards and a continuation of the uptrend with reaching the resistance zone marked on the chart. I'm aware of the possibility of a correction at any time, this should be taken into account, If the outlook changes I will publish a post with an update, so I encourage you to actively follow the profile and read the description carefully.
💲*Please do not suggest the path I have outlined with lines it is only a hypothetical scenario.
🚀If you appreciate my work and effort put into this post then I encourage you to leave a like and give a follow on my profile.🚀
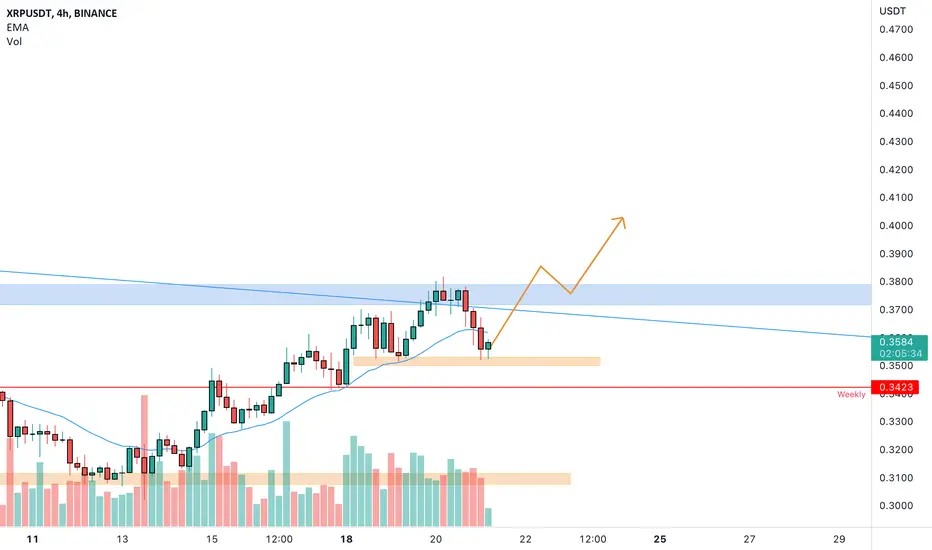
XRP/USDT possible move up If the current support holds, we could see price move back to previous resistance in the coming days. Profit zone market on chart.
Not financial advise, do your own research before entering a trade!

XRP USDT SELL (RIPPLE - TETHER US)Hi there.
Price is moving to the downside. Wait for the price to form a continuation pattern and watch strong price action for sell.
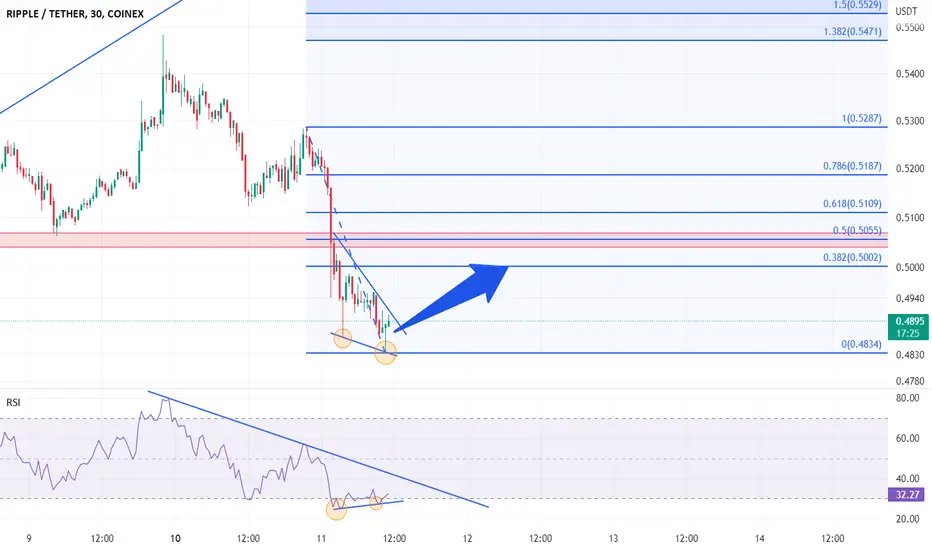
XRP analysis in 30 minutes frameBased on the analysis of USDT's negative divergence and XRP's positive divergence, a good situation for long trading
CRYPTO MARKET UPDATE! HAS THE CRYPTO SHIP SUNK?Hi Snipers,
Please refer to the recording for the next price levels and scenarios.
Thanks
MS

XRP can break the confluence? 🦐XRPUSDT on the 4h chart has tested a confluence resistance zone between.a daily resistance and a descending trendline.
How can i approach this scenario?
I will wait fora potential break above and in that case i will look for a nice long order according to the Plancton's strategy rules.
–––––
Keep in mind.
🟣 Purple structure -> Monthly structure.
🔴 Red structure -> Weekly structure.
🔵 Blue structure -> Daily structure.
🟡 Yellow structure -> 4h structure.
–––––
Follow the Shrimp 🦐
EMC2 EINSTEINIUM USD : UPDATE IS SHOWING MASSIVE MOVE IMMINENT!FOLLOW AND LIKE IF YOU APPRECIATE THIS CONTENT. COMMENT BELOW AND LET ME KNOW WHAT YOU THINK. THANK YOU
EMC2 EINSTEINIUM USD Is looking good still. There is massive macro bullish divergence on the MACD. After such a fast run up EMC2 had to take a nice breather and thats what it did. The breather is over or at least extremely close. This is a discount price for EMC2 in my opinion. I have been loading up for the past couple of months and I believe that EMC2 will be showcasing what they have been working on these last few years while correcting and consolidating. They haven't stopped working just cause it corrected. I see a nice run for EMC2 in the next bull run among many other 2016-2017 superstars. This is not financial advice this is just my opinion. Thank you

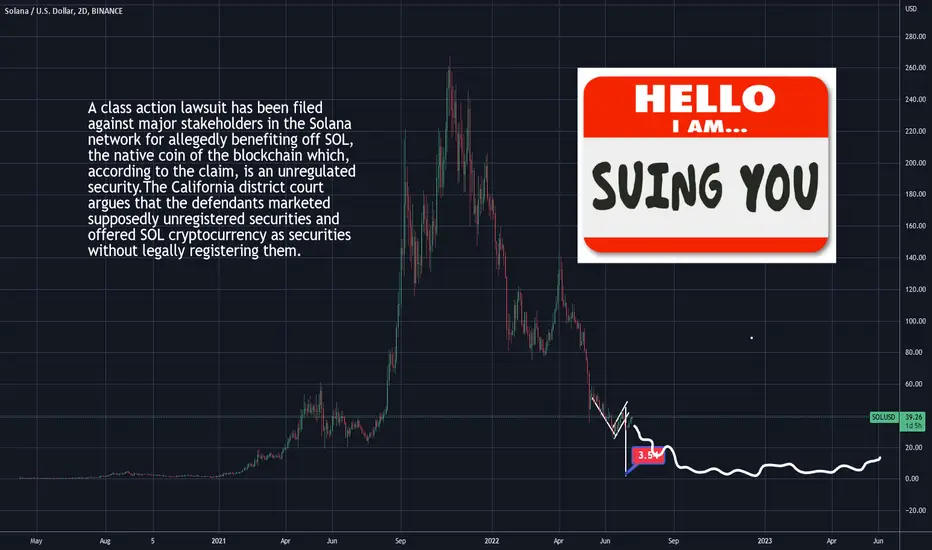
SOLANA SOL USD : SOLANA IS DYING, TAKE PROFITS NOW $3 TARGETFOLLOW, LIKE AND COMMENT IF YOU APPRECIATE THIS CONTENT. THANK YOU
SOLANA Has had a horrible looking chart for a while now. Solana's hype is pretty much over and now, they are getting sued kinda like Ripple did. This stuff could go on for years. I think SOL is overvalued and is about to tank especially if they are found guilty. This is not trading or financial advice this is just my opinion. Thank you.
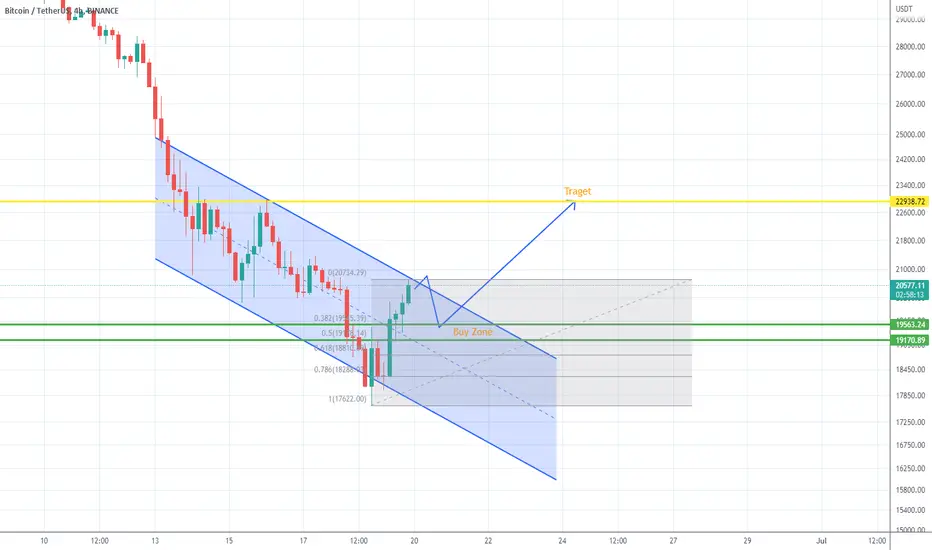
Bitcoin Next Week Price PredictionI Would Like to Share My First Analysis Dated 19-June-2022 for the bitcoin price prediction in the next couple of days.
We predict the Bitcoin price may decline on Monday 20-June-2022 to 19200-19500 . which consider a good opportunity to buy it with a target of 22800-23200.
We don't advise you to short now but hold on to your cash whether it reaches the above-mentioned price which is a good opportunity for a long trade.
Keep in mind that prices may go straight forward from the current level directly to 23000 Usdt without any correction, based on that never go short position in the next week.
Regards
BTCUSDAccording to past news
Now the market is not good
See the news
Static and dynamic support and resistance specified
Do not forget the stop loss
Preferences do not take a long position
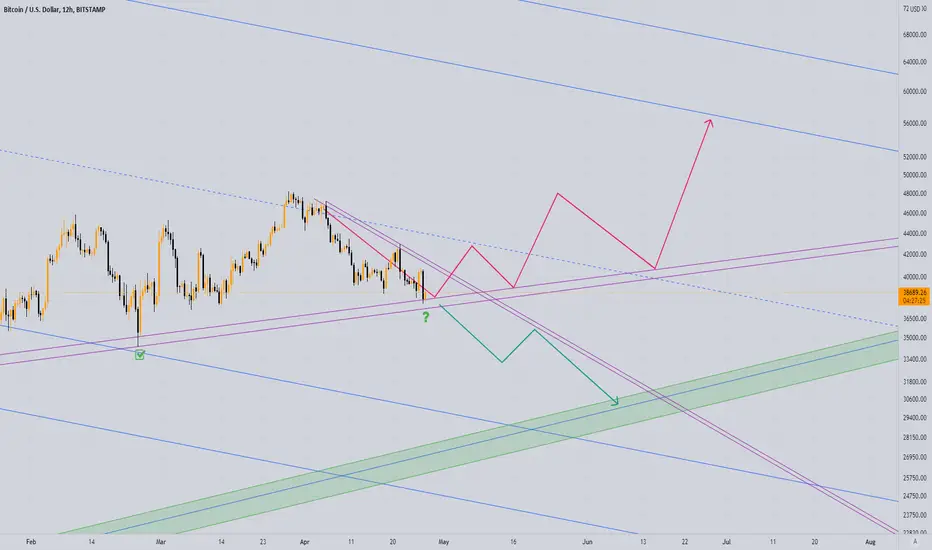
I guess there is a lot of troubles in front of #bitcoinI always mark everything you need to know about the chart with a #check mark and #quistion mark!
try not to use this as a #trading #setup!
#stay #safe
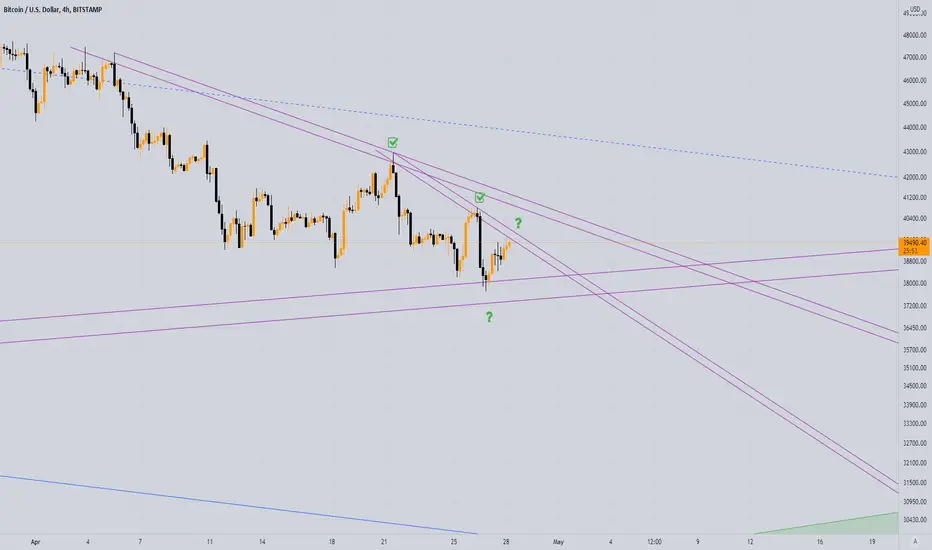
let's have a perfect update on #bitcoinalright, what do we have here about #bitcoin is more similar to the previous #ethereum #TA we had, so just like we talked about #ethereum, #bitcoin shell has the same plan I guess, I marked the best possibilities on the chart for you!
stay safe
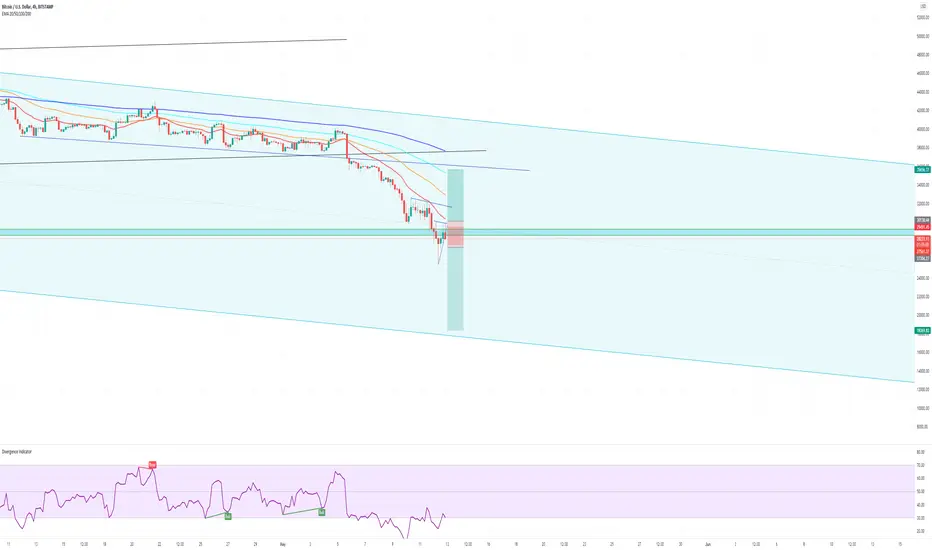
FEAR, TIME TO ADD LONG POSITION.Weekly Time-frame
We are still bullish, and inside the Ichimoku Cloud Tenken Sen Support Area is in $40,467. Relative Strength Index (RSI) is still bullish. We got rejected in the final strand of EMA Ribbon so we went inside the could, and we will still retest the resistance area soon.
1D Time-frame
EMA 144 and 233 was a strong resistance level, we got rejected and even broke the Ichimoku Cloud Senkou A. Bouncing area is $40,594. If we still break the support of $40,010. if it doesn't hold, next support is at $39,056.
Greed and fear Index is 33 back to fear.
alternative.me
Liquidation is $222M mostly long position. That would be a potential bullish in the coming days as all long position gets closed so it will pump again. We are still expecting it to form higher low to continue the up-trend.
4H Time-frame
We have broken Tenken Sen and Kijun Sen support of Ichimoku Cloud. Next support is 144EMA and 200MA are both located at $40,745. EMA 233 support is in $40,961. 4H TF still in the Retracement period in our Awesome Oscillator.
We will discuss more on the possibility on our Live. Stay tune and check with us!
Want more insights before US market open? Hit Like, Share, and Subscribe for more daily trading tutorial & cryptocurrency news
Trade Scholar, the best cryptocurrency educational community online!
Find the content above difficult to understand?
Feeling lost about how to trade?
Want to learn how to do your Own Price Prediction?
We endeavour to share you our investment knowledge & experience in order to help you starting your path to financial freedom. Follow, Subscribe & Join our Community to trade together!
Disclaimer: Above Technical Analysis is pure educational information, not Investment Advice. The information provided on this post does not constitute investment advice, financial advice, trading advice, or any other sort of advice and you should not treat any of the website's content as such. Do conduct your own due diligence and consult your financial advisor before making any investment decisions.
