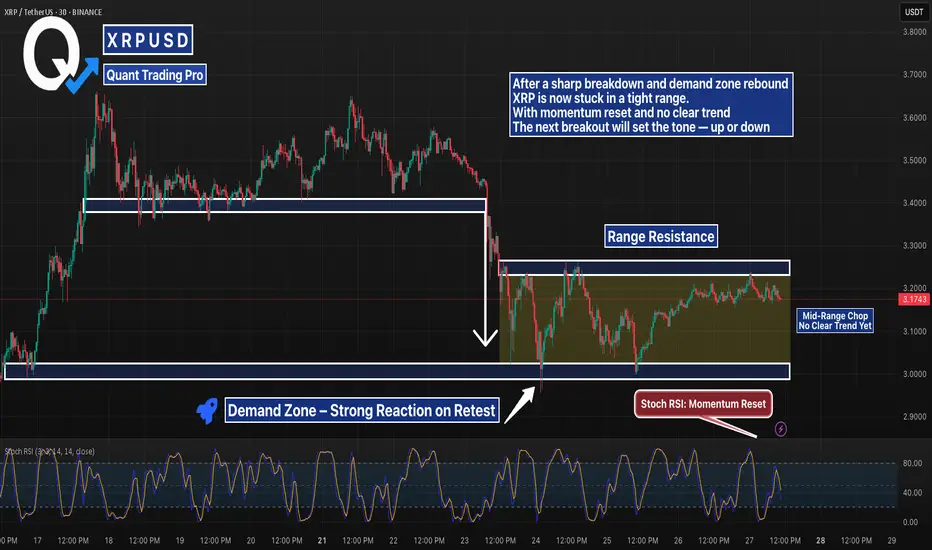
XRP Range-Bound After Breakdown — Compression Before Expansion?XRPUSDT 30m chart paints a neutral picture after a strong rejection from mid-range support last week. Price flushed into the $3.03 demand zone and bounced hard — but has since stalled and formed a tight sideways range between $3.03 and $3.25.
Momentum has reset (Stoch RSI near midline), and the market is clearly undecided. Structure currently favors neither bulls nor bears — and volume is thinning. Traders watching for a breakout from this compression box may catch the next directional move.
Key zones:
$3.25 = Range resistance
$3.03 = Demand zone
Mid-range chop = No-man’s land — best to wait for confirmation
Neutral bias until range breaks.
Xrp
#XRP Update #3 – July 27, 2025#XRP Update #3 – July 27, 2025
XRP once again found support from the previously tested K-Level zone, completing its correction and beginning a new upward move for a healthier rally. However, the recent candles show a very low-volume market. With such low volume, it may be difficult for XRP to continue rising. If this upward move takes too long, it could lead to a pullback in XRP.
XRP must not break below its last low at the $2.85 zone. If this level is broken, the next potential support is around $2.60. However, there isn't strong support at that level.
Since XRP has completed its correction, if it wants to continue its move, the target is $3.93. From the current price, this represents a potential rise of around 22 percent. But it must be noted that there is strong resistance at $3.67. This level should be broken with a strong candle.
At this stage, those who prefer to wait can consider opening a position in XRP. Personally, I will not be using a stop-loss and will instead aim to reduce my average cost by accumulating from lower levels. As seen in the chart, an entry can be made at this stage. But remember, proper capital management is key. Since I have funds to buy lower and average down, I won't be using a stop. You should define a stop level suitable to your own budget.

#XRP Update #3 – July 18, 2025#XRP Update #3 – July 18, 2025
XRP has surged roughly 28% in its latest impulsive move. Naturally, we now expect a correction phase. Potential retracement levels are:
Level 1: $3.30
Level 2: $3.20
Level 3: $3.10
Pullbacks to any of these levels should not be alarming — they are typical and healthy corrections.
I plan to go Long if XRP bounces from the first correction zone. However, at the moment, I’m just observing, as the current signals are not strong enough to justify entry.
It’s also important to note that there are heavy whale sell orders between XRP’s current price and the $4.00 zone. Breaking through this resistance will likely require strong buy-side volume from large players. Caution is advised.

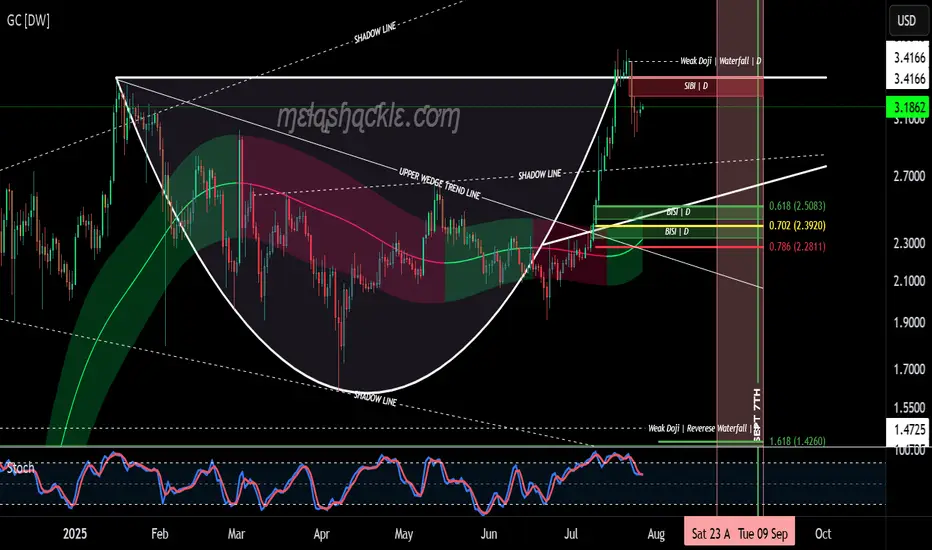
XRP Cup & Handle Pattern on the Daily Chart.XRP is now forming the handle on a very nice cup-and-handle pattern on the daily chart, starting at the previous all-time high set on January 16th, 2025.
But this pattern isn’t all sunshine and rainbows. The price of XRP could drop down into the $2.50 range—toward the bullish fair value gaps I’ve outlined at the bottom of the handle—before making any credible gains or a major breakout to higher levels.
I do believe we’ll see much higher prices in XRP in the coming years as we continue moving into the new global digital financial system. However, for this pattern to fully play out, there will likely be some pain before the pleasure.
I’d keep a close eye on the pink area marked on the charts—spanning from August 23rd through September 8th—as a potential zone for bearish price action.
Luckily for me, my XRP bags have been filled since before the Trump election pump, so I don’t personally need to buy more—unless I see a clear buying opportunity.
Good luck, everyone!
XRP 4H – Golden Pocket Bounce, But Will Bulls Reclaim $3.60?XRP pulled back cleanly into the golden pocket (0.618 Fib) after a strong rally — and buyers stepped in with force. Momentum flipped quickly, and Stochastic RSI is curling up with bullish intent.
Now price is holding above short-term support, but faces a key challenge:
→ $3.60 marks the prior high
→ Reclaiming that level would confirm bullish continuation
→ A rejection here would set up a lower high and shift structure bearish
This is a make-or-break moment for XRP in the short term. The golden pocket held — now the top of the range needs to flip.
#XRP #GoldenPocket #Fibonacci #CryptoAnalysis #StochasticRSI #LowerHighRisk #PriceAction #QuantTradingPro

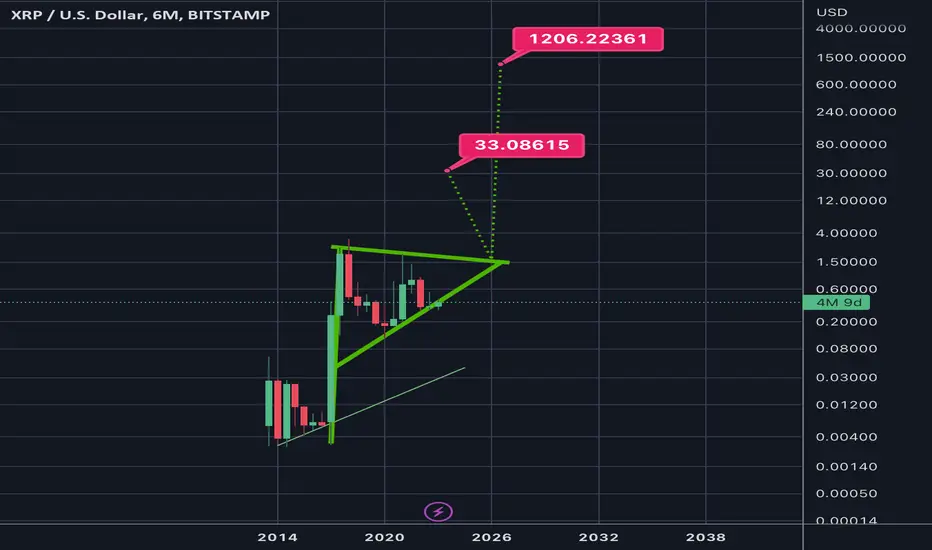
6month log chart on xrpusd suggests crazy potential targetsThe bull pennant we are in shown here on the 6month time frame seems to have a symmetrical triangle for its flag. The breakout target for just the symmetrical triangle is in the $33 range. Factor in the pole of the flag and the potential target skyrockets to 1.2k. Definitely not financial advice and certainly no guarantee it will hit either target as it’s still up in the air if log chart targets reach their full target as reliably as linear chart patterns do. Even if it does hit these targets you can see the apex of the pennant in its current trendline trajectories doesn’t occur until 2026. The only way I see price remaining inside this triangle for that long is indeed if the SEC ripple case is extended through appeal and taken to the Supreme Court. Hopefully not but it isnt impossible. If this were to occur I would simply keep dollar cost average accumulating until it was to break out from the triangle which would give me more opportunity to take some profit at the first target but then also hold onto some of the asset in case it does indeed reach the full bullflag breakout somehow all the way up at 1.2k. Simply posting this hear so I can see how well price action chooses to follow this pattern over the next year or few. Once again *not financial advice*
REI/USDT CYCLE UPDATE $0,90 by 2025 - Price prediction📈 REI/USDT CYCLE UPDATE – $0.90 by 2025
REI could break above its old ATH, targeting $0.90 in the upcoming cycle. Why?
Upcoming
✅ Ultra-fast blockchain (⏱️ 1.5s block time)
✅ Gas-free or near-zero fees – perfect for DeFi, NFTs & gaming
✅ EVM-compatible – easy migration for Ethereum dApps
✅ Low market cap → high upside potential
✅ Clean tokenomics with staking + resource model
✅ Built for speed, scale & adoption
DATA
Data shows that there is a structural trend going on, where this coin can break soon.
If the altcoin market heats up, REI has the fundamentals & tech edge to explode past previous highs. 🚀
🧠 Watch this one closely.
#REINetwork #Crypto #Altseason #EVM #PricePrediction #Web3
This is not trading advice, but a view from a side of study.

XRP to 2.80So, conjugate waveform or Elliot wave retracement is 5 steps. With 3 being the longest. 5 obviously the lowest. Once a demand or supply zone is tapped/broken into, they want the extreme of that zone. That's why I think 2.80 low.
With, 1234 break on Z out of the bearish Pennant into the demand. Forming the bottom of the, now larger C&H.
And aAaAway we go!

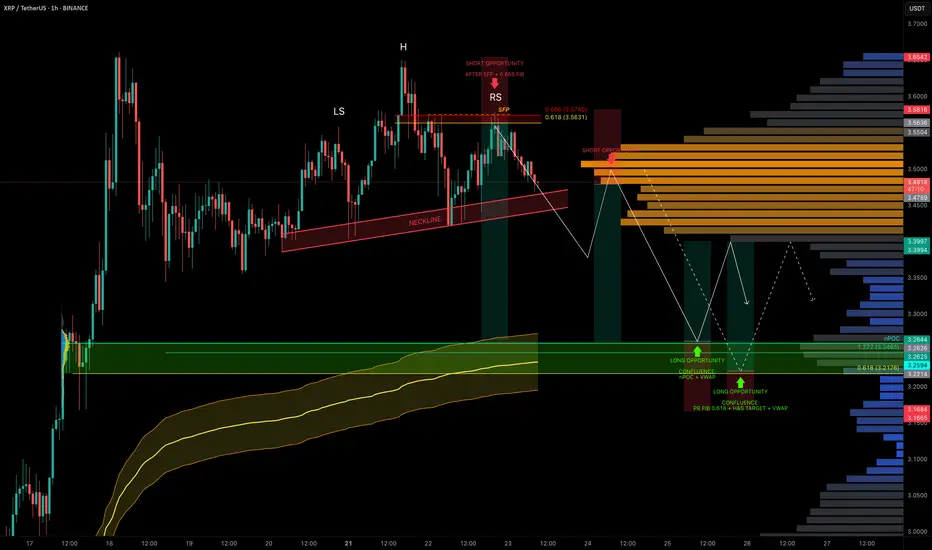
XRP Coiled in Range — Liquidity Below, Trade Setups AheadXRP has been stuck in a trading range around $3.50 for the past 5 days, offering multiple trade opportunities within the chop.
A notable short was triggered after a swing failure pattern (SFP) at the 0.666 fib retracement level near $3.563.
Now, with liquidity building to the downside, we’re watching closely for the next high-conviction setups.
🧩 Current Structure & Short Setup
🔴 Short Opportunity (Triggered):
SFP + 0.666 fib retracement at $3.563 led to rejection.
Market now shows a head & shoulders pattern forming.
Target: $3.2176 (0.618 fib retracement).
Trigger: Watch for a neckline break + retest for short confirmation.
Stop-loss: Above the right shoulder.
🟢 Long Setup:
Watching for a high-probability long around:
$3.26 → nPOC + 1.272 TBFE
$3.23 → anchored VWAP bands
This zone offers strong confluence and could act as the next launchpad.
Long Trade Plan:
Entry Zone: potential entries between $3.26–$3.22, price action needed for confirmation
Stop-loss: Below swing low at $3.1675
Target (TP): ~$3.40
✍️ Plan: Set alerts near the lows and react to price action at the zone — don’t front-run, let structure confirm.
💡 Pro Tip: Trade the Confluence, Not the Emotion
High-probability trades come from confluence, not guessing.
This setup combines nPOC, TBFE, VWAP, fib levels, and classical market structure (H&S) to map precise zones for both longs and shorts.
Let price come to you and wait for confirmation — especially in a rangebound environment where liquidity hunts are frequent.
Final Thoughts
We’re still rangebound, but liquidity is building below.
Keep an eye on the $3.26–$3.22 support zone for long entries and the H&S neckline for short breakdown confirmation.
_________________________________
💬 If you found this helpful, drop a like and comment!
Want breakdowns of other charts? Leave your requests below.
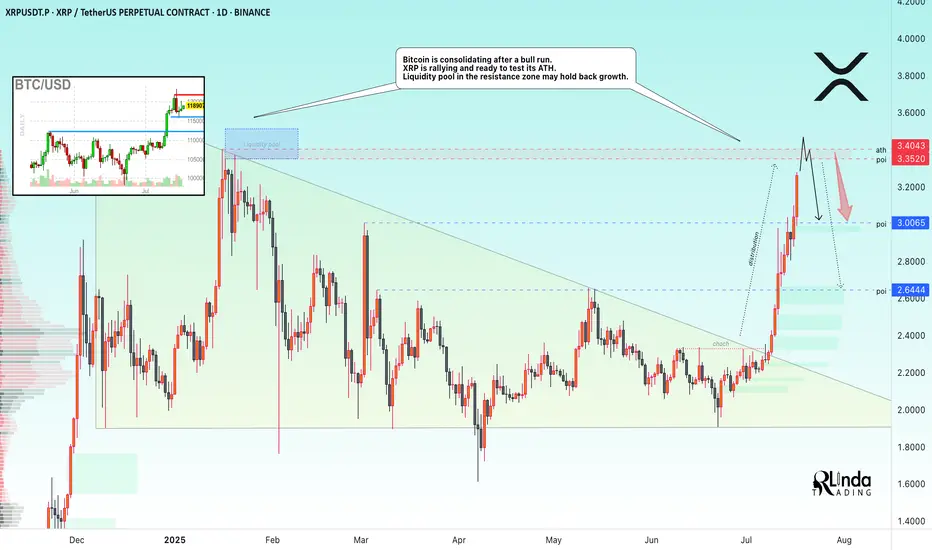
XRP → ATH retest. Reversal or continued growth?BINANCE:XRPUSDT.P is rallying and ready to test the resistance zone - ATH. Against this backdrop, Bitcoin is consolidating after a bull run. The liquidity pool may hold back growth.
Fundamentally, there is excitement across the entire cryptocurrency market. Altcoins are rallying after Bitcoin hit a new high and entered consolidation. The BTC.D index is declining, which generally provides a good opportunity for altcoins to grow. However, the index is approaching technical support, which may affect market sentiment overall...
As for XRP, there is a fairly strong liquidity pool ahead — the ATH resistance zone. The price is in a distribution phase after a change in character and a breakout of the downtrend resistance in the 2.33 zone. The momentum may exhaust its potential to break through the 3.35-3.34 zone, and growth may be halted for correction or reversal (in correlation with Bitcoin's dominance in the market).
Resistance levels: 3.35-3.40
Support levels: 3.0, 2.64
A breakout of resistance without the possibility of further growth, a return of the price below the level (i.e., inside the global flat) will confirm the fact of a false breakout of resistance, which may trigger a correction or even a reversal.
Best regards, R. Linda!
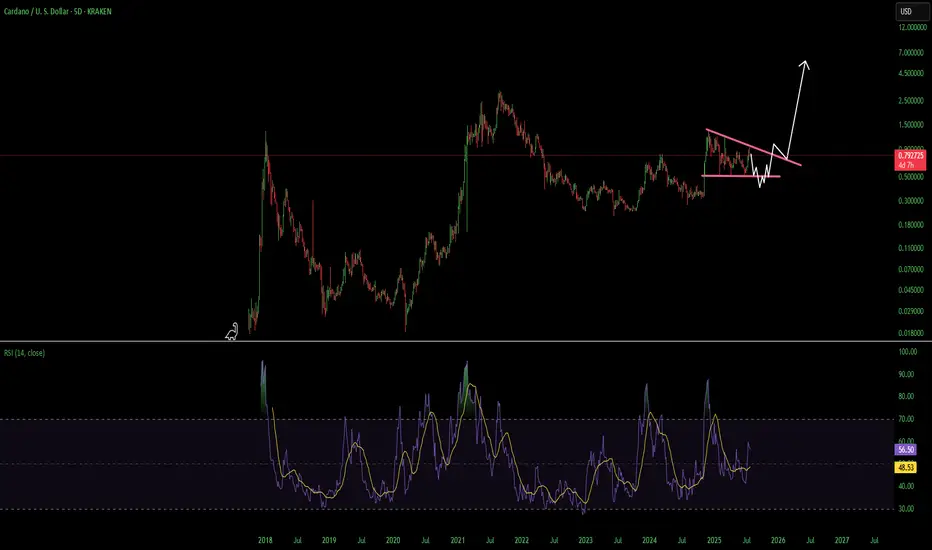
ADA Cardano Decsending Triangle Use Caution HereCardano had a heck of a move but i think its going to erase most if not all of it before it goes on its next leg up. A break over the overhead resistance line and finding support above would invalidate this. Not financial advice just my opinion. Thank you
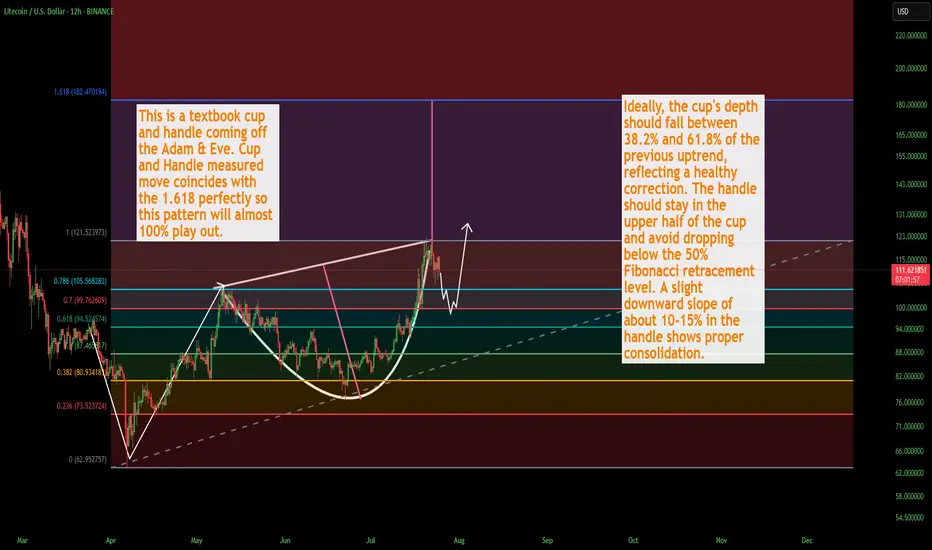
LTC Litecoin USD Textbook Cup & HandleLitecoin should finish its correction over the weekend and as we get into August the momentum will shift back to the upside. This is a washout of over-leveraged positionsbefore the next massive leg up. I still see a correction down to about 100 dollars. Could be a wick lower but not too confident. There is quite a bit of strength in Litecoin, and for good damn reason.
Not financial advice just my opinion. Thank you
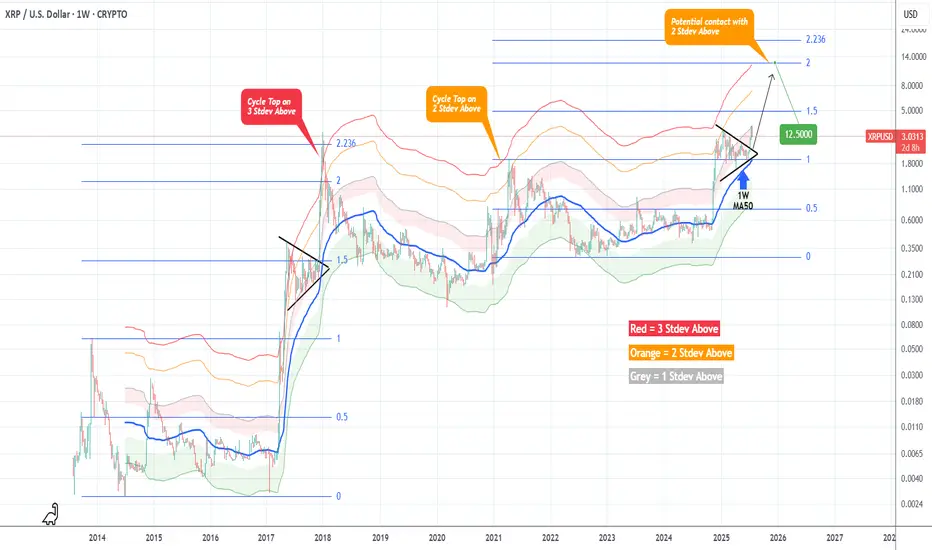
XRPUSD Massive break-out that can Top at $12.500XRP (XRPUSD) got out of its Accumulation Triangle (December 2024 - June 2025) making an aggressive break-out similar to the December 2017 one, which was after an identical Triangle pattern.
The fractals are so comparable that both mostly traded within the 1W MA50 (blue trend-line) and the Mayer Multiple (MM) 2 Stdev Above (orang trend-line).
As you can see, that MM trend-line was where the Top of the previous Cycle (April 2021) was priced and the one before was above the 3 Stdev Above (red trend-line).
Assuming that this Cycle will also go for the 'minimum' 2 Stdev Above test, it can make that contact by the end of the year on the 2.0 Fibonacci extension (Cycle Top-to-bottom) at $12.500.
-------------------------------------------------------------------------------
** Please LIKE 👍, FOLLOW ✅, SHARE 🙌 and COMMENT ✍ if you enjoy this idea! Also share your ideas and charts in the comments section below! This is best way to keep it relevant, support us, keep the content here free and allow the idea to reach as many people as possible. **
-------------------------------------------------------------------------------
💸💸💸💸💸💸
👇 👇 👇 👇 👇 👇
XRPUSD - Target reached. Reversal on the plateSo, that was a nice long trade.
Now price is stretched at the Upper Medianline Parallel (U-MLH).
As of the time of writing, I already see price pulling back into the Fork. A open and close within the Fork would indicate a potential push to the south.
Target would be the Centerline, as it is the level where natural Meanreversion is.
Observation Hat ON! §8-)

XRP stays above $3 ┆ HolderStatBYBIT:XRPUSDT is printing higher lows into the $3.44 resistance. Breakout could activate $3.60 target. Watch $3.30–$3.28 for possible pullbacks. Bullish pressure mounting.
XRP ~ Is this a best trade to take?XRP ~ This beauty is best to be buys at the red nd aim for the greeens!

XRP Temporary Pull Back Followed Bu Move Up To $4.00XRP Created a new high. Looking for a pull back to the 50% retracement level. Followed by a move up to the 141 fib level of around $4.00

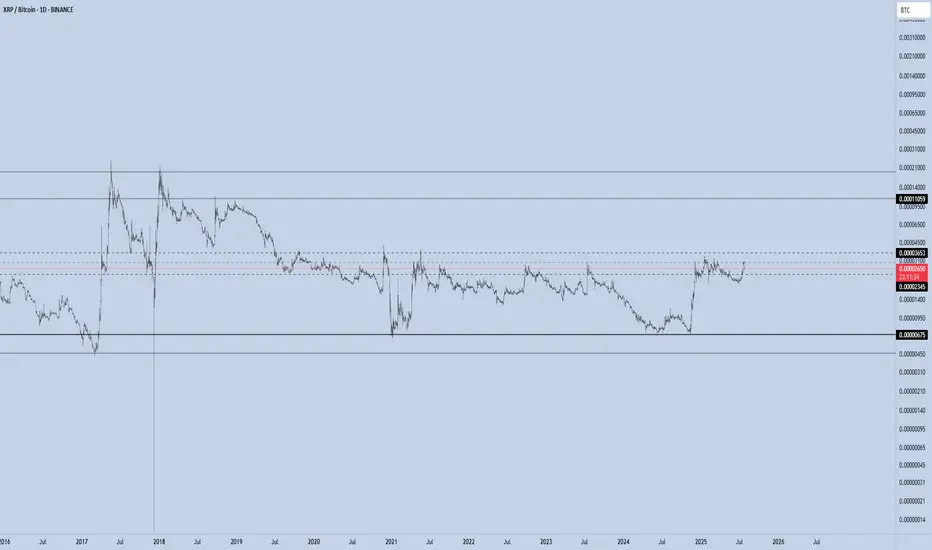
XRP/BTC – Channel Midline in Play The XRP/BTC pair trade inside a multi-year channel, with price currently testing the midline of this structure — a pivotal level that could define the next macro leg.
If bulls manage to break the midline to the upside and successfully retest it as support, the upper boundary of the channel becomes the next major target.
🔼 Upside Scenario:
A confirmed breakout above the midline would signal structural strength and likely lead to a rally toward the upper channel resistance.
If this move aligns with BTC dominance dropping below the 60% threshold, we could see a full-blown altseason emerge.
Under such conditions, historical XRP/BTC behavior suggests that XRP/USD could reach $12–$24.
🔽 Downside Risk:
Losing the mid-channel from here would weaken the structure and invalidate the breakout thesis.
In that case, XRP/BTC would likely rotate back toward range lows, and a defensive strategy is warranted.
Macro Implication:
The 60% BTC Dominance level remains critical. A clean breakdown below it historically marks the beginning of altseason, where high-beta plays like XRP against BTC have outperformed. XRP’s current posture within the channel reflects this high-stakes moment.
XRP is heading toward $4 ┆ HolderStatBYBIT:XRPUSDT is testing $3.40 for the third time. A breakout targets $3.60, but rejection risks $3.10 fallback.
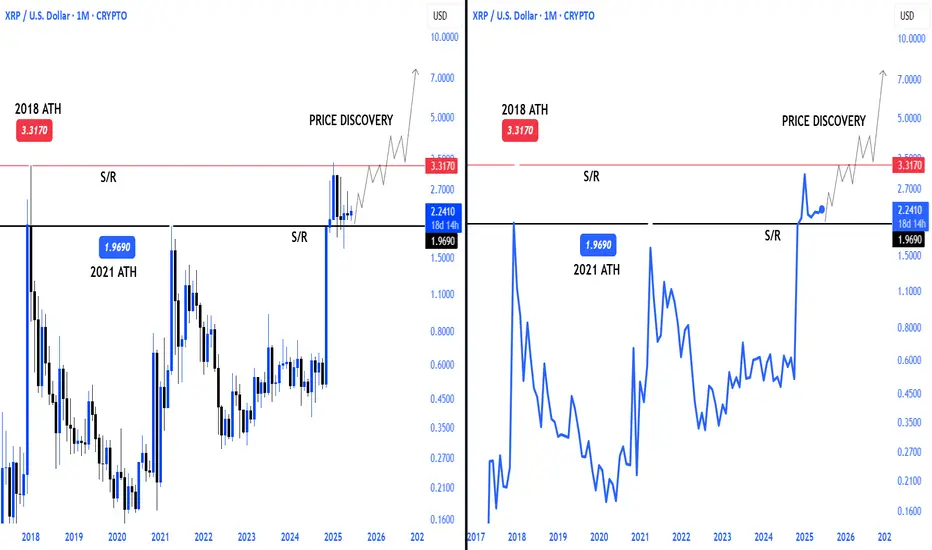
XRP CRYPTOCAP:XRP price discovery will be there sooner or later
2021 I think the current accumulation process on the ath price will be the trigger for an upward movement
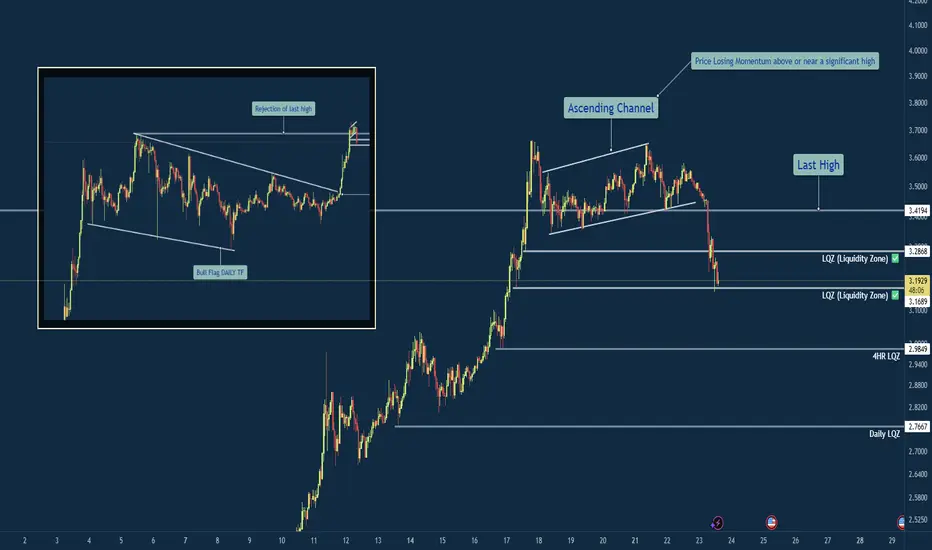
XRP/USD – Bearish Shift After Momentum Exhaustion🧠 Summary:
XRP/USD has shown clear signs of exhaustion after sweeping the previous high. Following a breakout from a daily bull flag, price struggled to hold momentum near the key level of 3.4194, forming an ascending channel that eventually broke down. Liquidity zones below current price are now in focus.
🔍 Technical Breakdown:
✅ Daily Bull Flag → Broke out with strength
⚠️ Rejection near Previous High (3.4194) → No follow-through
🔼 Ascending Channel → Formed post-impulse, now broken
📉 Momentum Shift → Structure flipped bearish
💧 Liquidity Zones (LQZ) below price acting as magnets
📌 Key Levels:
🔹 Last High: 3.4194 (Rejection Point)
🔹 Broken LQZ: 3.2868
🔹 Current Support: 3.1689 (LQZ - being tested)
🔹 Target 1: 2.9849 (4HR Liquidity Zone)
🔹 Target 2: 2.7667 (Daily Liquidity Zone)
🧩 Confluences:
Liquidity sweep of prior high
Momentum loss near key resistance
Break of ascending structure
Retesting broken zones with room below
⚠️ Final Thoughts:
This trade is playing out just as we described in the post before this on XRP. We discussed watching how price would react to this area before making any type of "Late Entries". XRP is still a huge and vital part of the Crypto Eco System so long term i am holding my Long position. The areas on the chart are still great areas to buy in at "Dollar Cost Average". This will be one of those positions that though it may be bearish on the lower time frame you need to zoom out and always keep an eye on the weekly and daily chart before making any drastic moves.
XRP Breakdown – Trend Break & Liquidity Zone Retest In ProgressXRP just gave us a clean breakdown below a well-formed ascending structure, violating both its dynamic trendline and horizontal support.
Let’s break down the setup:
🔹 Trend Context: Price was holding cleanly above the MA and respecting a dotted trendline, bouncing off prior breakout zones multiple times. This uptrend was sustained for days, with momentum supported by both MACD histogram expansion and Stoch RSI resets.
🔹 Structure Shift: After a minor consolidation, price rejected from the upper range and aggressively broke below support. The last long was closed during this transition — confirming the momentum was fading.
🔹 Liquidity Zones: The prior resistance-turned-support zone failed, with price wicking below and potentially sweeping stop orders before stabilizing.
🔹 Momentum Flip: MACD histogram has flipped red, and Stoch RSI is deeply oversold. This signals possible short-term exhaustion, but trend structure is clearly damaged.
Traders now face two scenarios:
1️⃣ Bearish case → Breakdown holds, and price trends lower into deeper liquidity (~3.00 or even 2.71).
2️⃣ Bullish case → Price reclaims structure with strength, invalidating the breakdown and trapping early shorts.
Key levels are in play. Wait for confirmation — especially on the retest.
#XRP #Breakdown #CryptoAnalysis #MACDStrategy #SupportResistance #LiquidityZones #TrendBreak #TechnicalAnalysis #AlgoTrading #QuantStrategy

People don't like the truth! Let's be honest, people don't like honesty. They prefer ideas that affirm their own beliefs.
When I read articles and posts from newer traders, it's often from a place of "all in" diamond hands and the notion that things go up forever.
I've been a trader for over 25 years now, and the game isn't about making a quick buck, it's about making money over and over again. This got me thinking, the issue is when you deal with a small account you require leverage, small timeframes and of course the "shit" or bust mindset. If you lose a thousand dollars, $10,000 even $100,000 - what does it matter? That's no different than a game of poker in Vegas.
The idea of being 80% in drawdown, is alien to me. The idea of one trade and one win is also a crazy notion.
Instead of playing with the future, there is an easier way to work. This isn't about slow and boring, it's about psychology and discipline. 10% returns on a million-dollar account isn't all that difficult. Instead of aiming for 300x returns on an alt coin (due to the account size being tiny) You can make less of a percentage gain with a larger account size.
In terms of psychology - the word " HOPE " is used, way too often, it's used when you hope a stock or the price of Bitcoin goes up, it's used when you hope the position comes back in your favour, it's used when you want your 10,000 bucks to double.
This isn't trading, it's gambling.
The truth is, it's not the winners that make you a good trader. It's the way you deal with the losses.
Once you learn proper risk management, a downtrend in a market move is a 1-2% loss coupled with a new opportunity to reverse the bias.
As a disciplined trader, the game is played differently.
Let's assume you don't have $100k spare - prop firms are a great option, OPM = other people's money.
Remove the risk and increase the leverage, all whilst trading with discipline.
The market goes through many phases, cycles and crashes.
You don't always need something as catastrophic to take place, but if you are all in on a position. You need to understand that losses can be severe and long-lasting.
When everyone sees an oasis in the desert, it's often a mirage.
You only have to look at the Japanese lesson in 1989, when the Nikkei was unstoppable-until it wasn't. For that short space in time, everyone was a day trader, housewives to taxi drivers.
Everyone's a genius in a Bull market.
Then comes the crash. The recovery time on that crash?
34-years!!!
I have covered several aspects of psychology here on TradingView;
When it comes to trading, if you are able to keep playing. It's a worthwhile game. If you are gambling, it's a game whereby the house often wins.
Right now, stocks are worth more than their earnings. Gold is up near all-time highs, crypto, indices the same.
All I am saying is if you are all in. Be careful!
Disclaimer
This idea does not constitute as financial advice. It is for educational purposes only, our principal trader has over 25 years' experience in stocks, ETF's, and Forex. Hence each trade setup might have different hold times, entry or exit conditions, and will vary from the post/idea shared here. You can use the information from this post to make your own trading plan for the instrument discussed. Trading carries a risk; a high percentage of retail traders lose money. Please keep this in mind when entering any trade. Stay safe.