XRP - take LONG after range SL huntXRP - take LONG after range SL hunt
trend is up
price is above previous HIGH
big chance for trend to go on
Xrp

HolderStat┆XRPUSD seeks to the $4BYBIT:XRPUSDT remains steady above $3.10 after the recent breakout. Resistance at $3.40 is being tested. A move above it may unlock $3.55+.

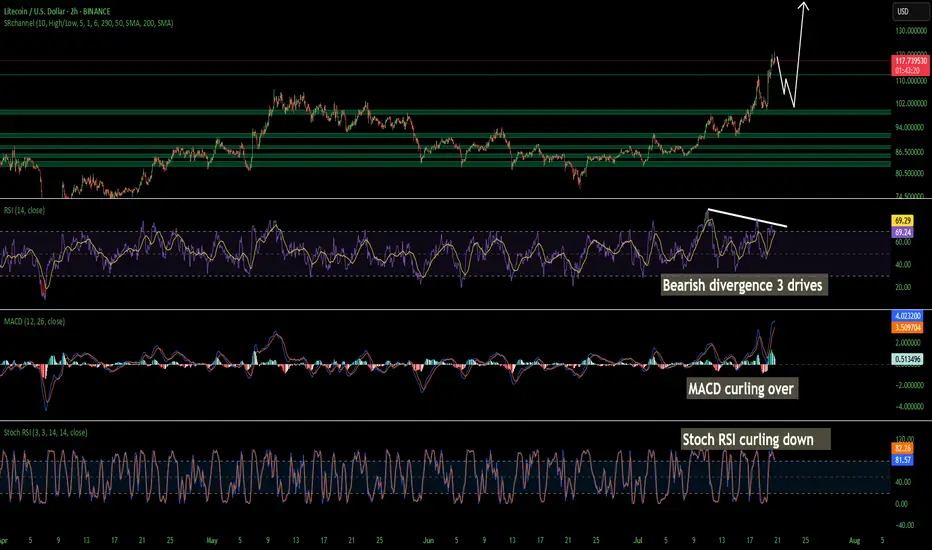
LTC Litecoin Short Term Pull Back Quick and SharpI believe Litecoin Is topping out on the 2 hour. Looks like we may come back down and tap support at around 104 but I wouldn't be surprised a wick hits 100. I have buy orders around 103-106. I am not super confident on a deeper pullback so thats why my buys are there is so i don't miss the dip. Id rather make a little less money than miss a buy in trying to nail the bottom. Litecoin is starting its breakout from a 7 year consolidation and accumulation phase. This should be pretty massive. Litecoin is going to benefit considerably from these new bills that are being signed and many of the favorites in the top 100 will soon disappear!
The time for Litecoin to shine as I have been talking about for years is now. I am almost certain that this is that time. My predictions all still hold if you would like to go read them. I was just off on timing. Timing is the hardest thing to predict especially with how wild this planet has been lately. None of this is financial advice its just my opinion.
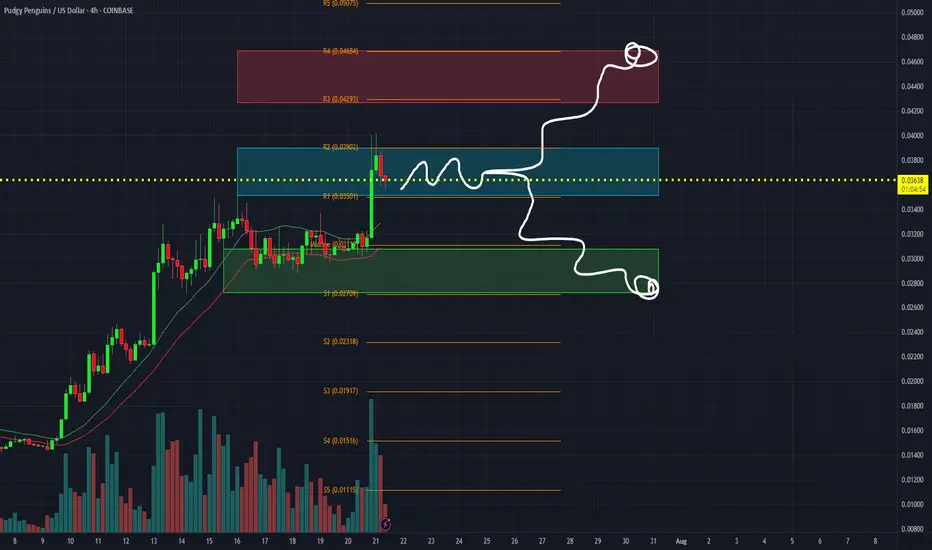
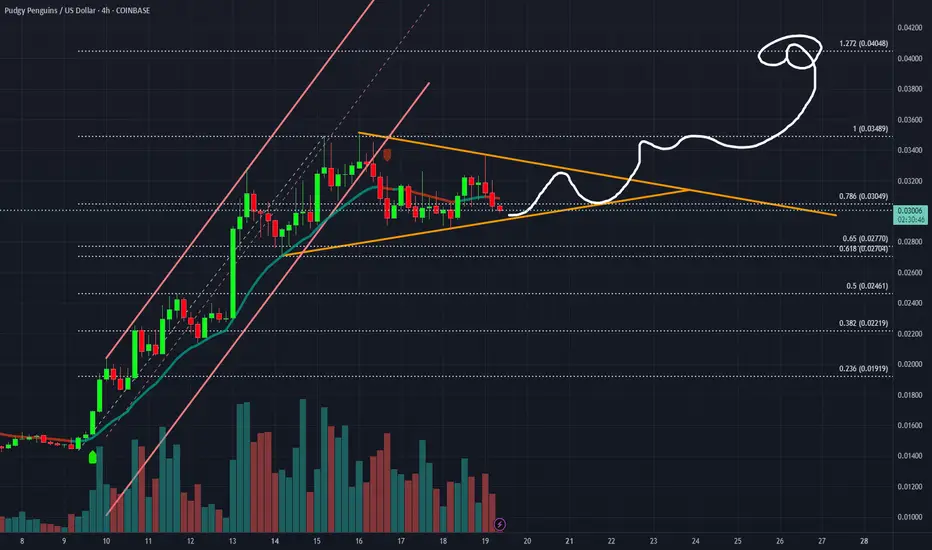
$PENGU Penguin consolidation at the moment.As long as CSECY:PENGU remains between .039 and .035 I consider it in consolidation. Breaks above or below these levels should see the targets posted.
XRP - Probable Trade!!! Very Yet!This trade is very probable and very to your extend beyond your imagination! Wait and watch!

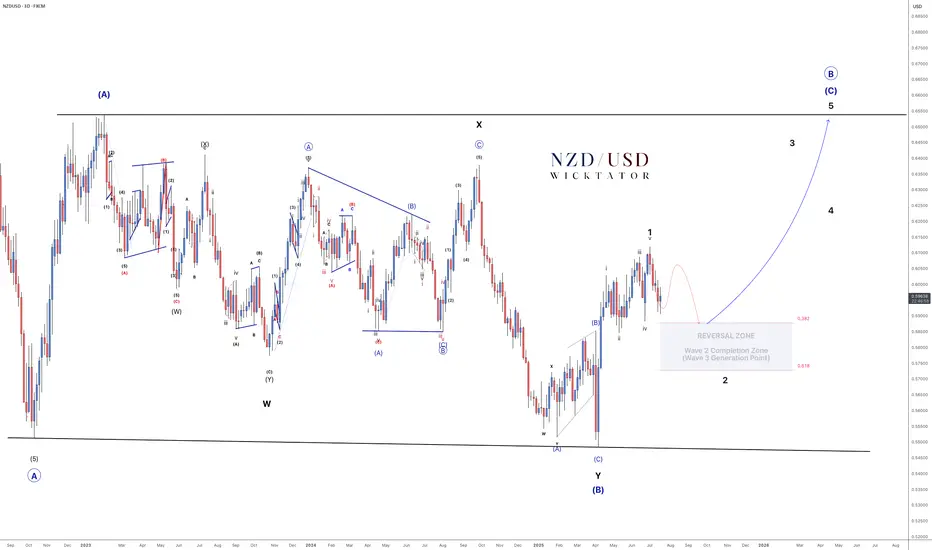
NZDUSD - Elliott Wave: High-Probability Reversal Zone Ahead!NZDUSD – Elliott Wave Roadmap
3Day Chart
Every move has been unfolding with precision — true to Elliott Wave Theory.
We're in the final leg of a massive A-B-C correction:
- Wave A and the complex Wave B (WXY) are complete.
- Wave C is now in play, targeting the highs of Wave A.
We’ve just seen a clean 5-wave advance (wave 1 leading diagonal).
Now expecting a classic ABC correction for wave 2, into our reversal zone (38.2–61.8% Fib).
🔍 Once price enters this zone, we’ll drop to lower timeframes and:
- Look for bullish confirmations (BOS, trendline break)
- Set entries with stops below corrective lows
- Targets: 0.63 (500 pips) and 0.65 (700 pips)
📌 Why is the buy zone so big?
It’s a higher timeframe zone. Once price enters, we zoom into lower timeframes for precise entries. The zone simply tells us when to focus, not where to blindly buy.
This is the Wave 3 generation point — and that’s where the real move begins.
Plan your trade. Watch for the setup. Execute with confidence.
Goodluck and as always, Trade Safe!
NZDUSD 12H Chart - Looking for this ABC correction for wave 2
XRP- Caught The Move. Then Got Chopped. How Backtesting Fixed ItXRP printed a strong trend — and the strategy caught it early. But partway through the move, price stalled in a tight range and the position was exited early.
That’s where backtesting and tuning come in.
In the first test, the strategy used default settings with Signal MA = 220. It entered cleanly, but exited mid-chop.
After adjusting the Signal MA to over 800, the strategy started holding through the noise and stayed in the move — with higher PNL and a slightly increased drawdown. Ended on 900.
This is the power of understanding how your system behaves in different conditions.
By adjusting signal sensitivity, you can reduce premature exits without chasing every move. The goal isn’t perfection — it’s better retention of valid trends without overfitting.
This example shows how simple tweaks, backed by clear test results, can make a measurable difference.
—
#XRPUSD #Backtesting #MACDStrategy #LiquidityTracker #CryptoTrading #TradingView #QuantTradingPro #StrategyOptimization #TradingSystems

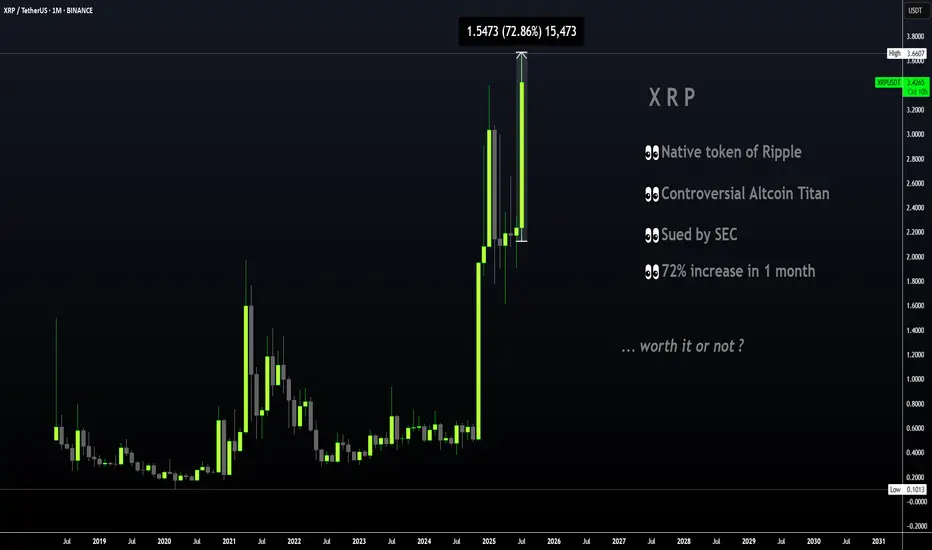
XRP | Great TP Zone is HERE for HODLERSXRP has seen a 62% increase since breaking out above the moving averages in the daily timeframe.
The previous time XRP broke out above the moving averages in the daily, the price increased around 440%:
However, with XRP being the ultimate pumper and dumper, I'll take my chances at 62%! Because this bull run has been anything but ordinary and it's best to avoid being too greedy. The price of XRP falls extremely quick, just as quick as it rises.. ( Maybe not overnight but you know, it has happened before ).
If you're one of few who bought around $1, or heck even later at $2, this is a solid increase and it should not be taken for granted. XRP has gone LONG periods without increases and often stayed behind making new ATH's when other cycles have come and gone (twice), as other alts make new ATH's. Over the years, I've made extensive posts on XRP; documented its use case, followed the SEC case closely and yet, XRP still remains one of the strangest and most unpredictable alts I have ever tried to analyze. Long term followers will remember that a I was bullish in 2018/2019 and then slowly became uninterested up until the point of negative towards XRP for probably the past 3-4 years.
This is not only because of the lagging price compared to other older alts that soared like ETH and even Litecoin. Sure we did not see the growth and the taco stand ( who remembers ) just kept dumping on the market... But the entire "scandal" of the actors marketing/pimping, the dumping behind the scenes by executives to fund Ripple in early days, the lawsuit etc. was just such a colossal mess that I even wonder how XRP is still alive and kicking today.
All I'm saying is that this is truly a spectacular moment - it's hard to even imagine cripple crossed $3 after years and years of waiting on XRP when other alts x1000% and beyond. Point being - Don't miss it! Trading only works when you take profits.
________________________
BINANCE:XRPUSDT
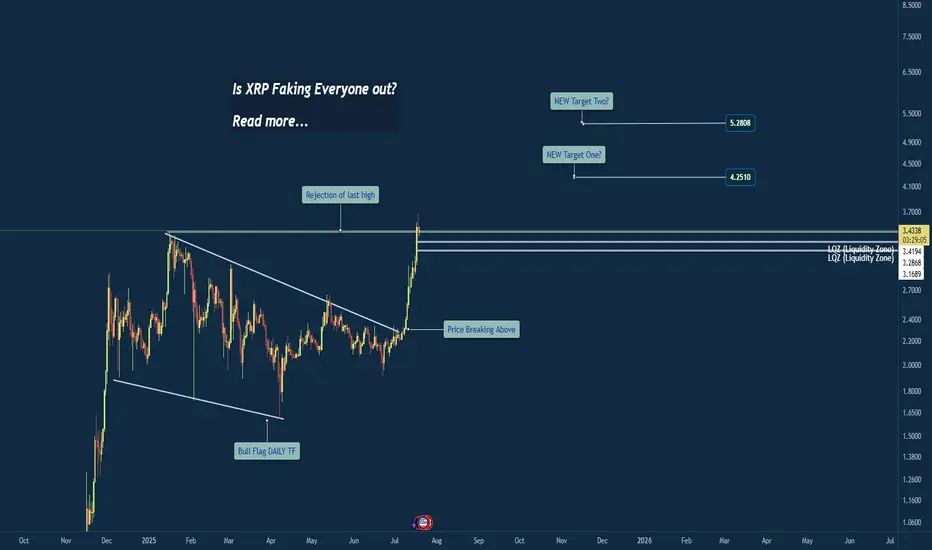
Breakout or Bull Trap? XRP at Critical Weekly LevelWeekly Chart Insight: XRP Closing Above Previous High
XRP has just closed above its previous weekly high—a significant development that could signal a shift in market sentiment. Historically, when price closes above such a critical level on the weekly timeframe, it often leads to continuation, unless a sharp rejection quickly follows.
At this stage, the focus shifts to the 4-hour timeframe for confirmation. An impulsive move above the current consolidation zone could indicate that this breakout is legitimate, potentially leading to another bullish weekly candle.
However, caution is warranted. If the next two daily candles close weakly or fail to maintain structure above the breakout level, it could hint at a fakeout or liquidity grab before a deeper correction.
My Current Bias:
I remain neutral-to-bullish, contingent on:
An impulsive continuation on the 4HR
Strong daily closes above the key range
Price not falling back and closing below the weekly breakout level
If price begins to consolidate and hold this level, that would reinforce the bullish case. But if we see immediate selling pressure and a re-entrance below the breakout, I’ll reconsider the bias based on developing structure.
$PENGU Pudgy PenguinsWithout a breakout to the DOWNside, CSECY:PENGU is still looking bullish for at least a hit to .04.
Ripple Update: Is XRP Ready for Another 500% Growth?Hey friends, it’s Skeptic 🩵 . In this video, I’m giving an update on Ripple’s conditions , reviewing past triggers, and what to do with your long positions in futures if you’re still holding. For spot, what’s the move? I dove into XRP/BTC analysis and, at the end, broke down BTC.D , which just had a major event you need to pay close attention to. Don’t forget money management, and stay clear of FOMO. Drop your thoughts on XRP in the comments so we can chat about it!

18$ XRP Mapped Out Projection – HOLD🚀 Just sharing some insights to help you explore what XRP might be capable of.
The chart you see here is a projection inspired by the path of XRP’s first major bull run. Surprisingly, I was able to map out around 95% of the key support and resistance levels using the Fibonacci extension tool.
📚 A little history lesson — while history doesn’t repeat itself exactly, it often rhymes in patterns.
Let’s see if XRP has another surprise in store for us this cycle. 🔄✨
#XRP #Crypto #FibLevels #Bullrun #ChartAnalysis

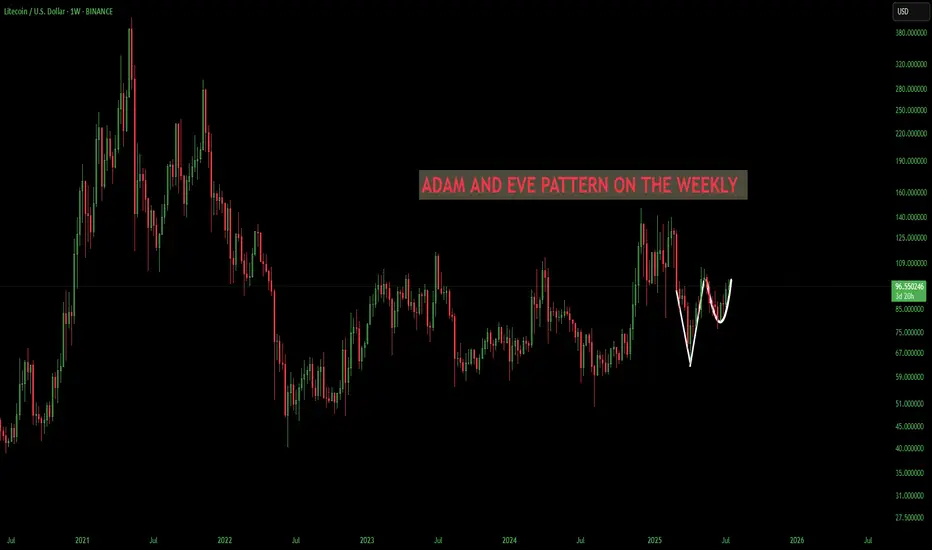
LTC/USD LITECOIN Adam & Eve Pattern On WeeklyThe Adam and Eve pattern is quite effective and usually signals a trend change to bullish. Once this pattern breaks the neckline I think its straight to $200 before any sort of pullback.
Haven't done a chart in a while cause its been the same old stuff, sideways. We are starting to ignite now. Silver is running which means something is breaking in the background financial system. I see the biggest blow off top you've ever seen coming, its the only way out of this, print print print until it doesn't work anymore.
Also I was reading that Bitcoin is removing its cap for spam in each block in October? This could spell disaster for fees and congestion. Litecoin will skyrocket during that time I believe because the fees will be so high it will price out the little guy trying to send a grand or two. I see an influx of people coming to Litecoin. Good luck , none of this is financial advice just my opinion
Bitcoin Interesting Fractal And Timing! GOING STRAIGHT UP!I noticed that the timing and pattern of how this is playing out in 2025 in Bitcoin is very similar to that of 2017. This fractal is not identical but its damn close. In 2017 there were approximately 15 million people in crypto, very few leverage exchanges, and trading was no where near what it is today. Now we have exchanges everywhere, hundreds of them most with leverage which we didn't really have before. Also not to mention that now we have big players getting in and they aren't buying and selling on the daily, they are buying it all and holding it, hence why we aren't seeing the typical "Alt season". The sloshing effect we had in the early days when traders would rotate out of Bitcoin into alts is not happening as it used to.
In 2017 Trump took office and in the end of March the bull run started in full swing. Something very similar is also happening now that we are in March and these fractals are lining up. Let see how this plays out. I think we are on the cusp of a giant mega bull run like you've seen before.
Crypto traders last year made mega profits cashing out multiple billions in capital gains. Once the selling stops around the end of March and beginning of April from people selling to pay taxes I think its on. This is not financial advice this is just my opinion. Lets see how this chart ages. Thank you for reading.

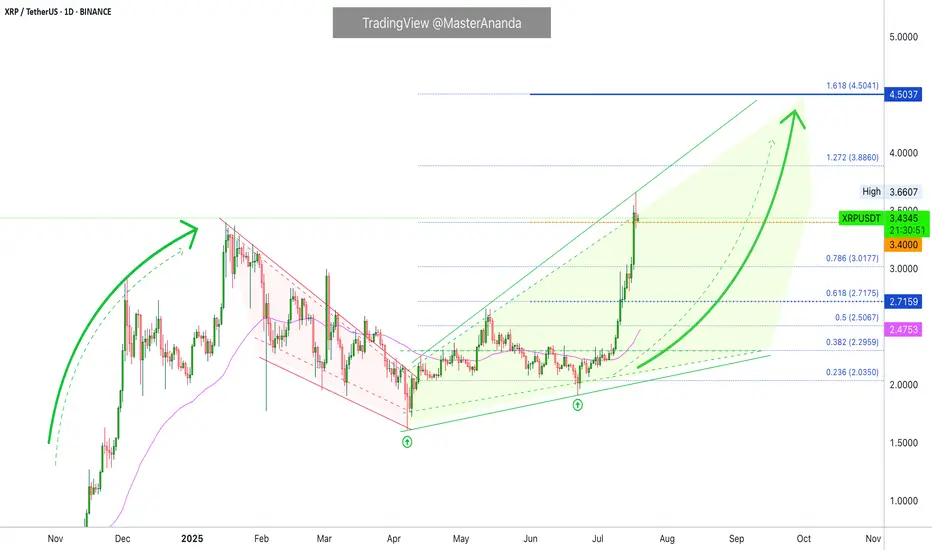
XRP Update · What To Expect Short-Term (Now!)XRP just hit a new all-time high and this is truly awesome if you hold this pair, if you were bullish before the breakout, if you bought LONG, etc. It is also good if you are an analyst looking for clues that will tell you what will happen to the Cryptocurrency market in the near future.
Remember that XRP moved early to start this cycle and it moved strongly. Right now, it is moving early and strongly again in comparison to many other pairs. This tells us that the rest of the market will follow.
I saw very strong bullish action across many pairs but I also saw many pairs staying behind; below their April's high. Now, what happens next?
XRPUSDT made a stop after moving beyond its 16-January 2025 high. This is pretty normal behavior. After a strong rise, there is always a stop, retrace or correction. We do not expect a correction to develop now because the consolidation period was very long, strong and prolonged. So we don't have to worry about that one.
A retrace is possible but having one would be small and short-lived. Finally, a pause is the most likely scenario. A pause can range between 3-9 days. That is, that amount of time before additional growth.
The final possibility is the market moving straight up. Since we have a 126% rise since the 7-April low, we don't give much credit to this scenario. The top choice is a small pause before additional growth. The important part is "additional growth." This is what will happen. This is what comes next. XRP will continue growing. Boost if you agree.
Namaste.
Is Your Altcoin on the Chopping Block?-Update: Originally posted on July 8, 2025… but swiftly vanished into the void by a moderator (rookie mistake—I neglected the sacred posting rules). Turns out, publishing has rules… that I did not interpret accurately?
To my loyal circle of 5 followers: if this feels like déjà vu, my sincerest apologies for the rerun. But with the winds shifting and the drums beating for alts season, I figured it was worth a resurrection.
Let the thrills—and the calls—begin. 🎭📈
Whenever you see “-Update:” that’s the latest as of today — 07/18/25.
Is Your Altcoin on the Chopping Block? 🪓
Brace yourself—this might sting.
Odds are, your favorite altcoin is walking a tightrope. And while I’m not here to spread doom, I am here to give you a wake-up call. Don’t shoot the messenger.
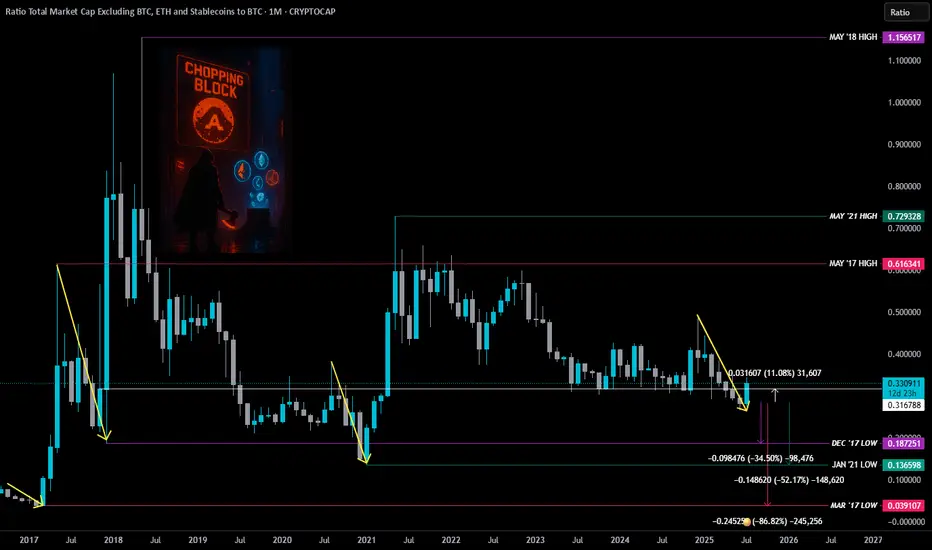
TradingView recently dropped a chart that cuts through the noise: Total3ESBTC.
It’s a ratio of the Total Crypto Market Cap (minus BTC, ETH, and stablecoins) to Bitcoin.
Translation?
👉 A clear, undistorted look at how the altcoin market is actually doing—without ETH clouding the view or stablecoins muddying the waters.
Think of it like night-vision goggles for spotting altcoin strength—or weakness—in the shadows of BTC dominance.
Perfect tool to sniff out market rotation—that sweet spot where Bitcoin hands the baton to alts or rips it back.
So why should you care?
Because the writing's on the wall... and most altcoins might not survive what's coming.
Let’s break it down:
ZOOMED OUT – MONTHLY VIEW 🔭
Before every major altcoin run, there’s always a major low.
You’ll notice three big ones:
🔴 March 2017 (Pink Line)
🟣 Dec 2017 (Purple Line)
🟢 Jan 2021 (Green Line)
Yes, some individual alts have pumped. A few even went full parabolic.
But if altcoins as a whole were ready to fly? They would've taken off already.
-Update: Yes, they finally did it this week… but hold that excitement—there’s more to the story.
Instead, the altcoin ratio broke a critical support (White Line) back in May... and even closed below it. That’s not bullish—it’s a red flag flapping in the wind.
– Update: We just sliced through that white line, but for most alt’s to stay strong, we need a monthly close above it.
Strangely enough (or coincidental, if you believe in coincidences) ...
🗓️ All the major altcoin market highs happened in MAY.
Not once. Not twice. Every. Single. Time.
🔴 May 2017
🟣 May 2018
🟢 May 2021
Call it coincidence. Call it cycle magic.
Maybe it’s a message from the crypto gods—and they don’t whisper for no reason.
So if we just had another May, and the ratio is still sliding with no reversal in sight… ask yourself:
Was that the high?
Or are we still heading toward the low that resets the board?
Here’s the hard pill 💊
If altcoins are ever going to go up again, odds are they’ll need to hit one of these historical lows first.
That’s not a prediction. It’s just how the markets have moved before major alt run.
📉 That means more pain ahead.
We’re talking potential drops of:
🔻 -32% to revisit Dec '17 levels
🔻 -51% to retest Jan '21 lows
🔻 -85% if we go full wipeout to March '17
Harsh? Yeah.
But better you hear it now than wonder “what happened?” when the floor caves in.
The worst part?
Most won’t believe this until it’s already too late.
-Update: Those lows haven’t been tested yet—might be wise to hold off on loading your bags to the brim. Patience pays.
Now here’s the uncomfortable twist:
There’s a legit case to be made that we may never see another “real” alt season again.
Why?
🪙 Liquidity is being siphoned by stablecoins
📈 Speculation is migrating to AI stocks
⚠️ Risk appetite is narrowing
Altcoins used to be the Wild West. Now? They’re the illiquid backyard of a global casino.
BUT… Let’s put on our degen-tinted glasses for a second.
Suppose the Fed hits the panic button:
🛩️ Rates cut
💸 QE returns
🚁 Helicopter money rains from the sky (not that they’d ever do that… right?)
– Update: Crypto Week is announced and broadcasted to the herd.
What happens then?
That’s when this chart—this ugly, broken, bleeding chart—might finally spring back to life.
– Update: Clearing those lows would’ve made this week feel a lot more convincing. But if you’re looking for signs of life—ETH/BTC chart might just be lighting the way. 🚀
Stay Sharp! 🐋R hUNTING!
THIS IS NOT FINANCIAL ADVICE. FOR EDUTAINMENT PUPOSES ONLY.
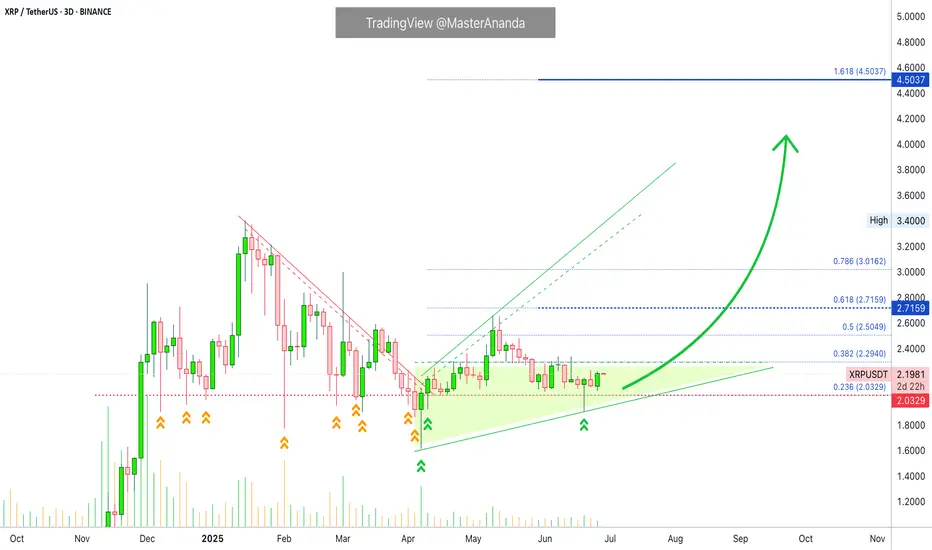
XRP Support Holds After Being Tested 12 Times...Everything below $2 is quickly bought. No crash is good news. Not having bearish action and bearish follow up on sellers pressure is bullish. XRP is bullish and has been consolidating for months. The longer XRP trades above $2, the stronger will be the bullish wave that follows. We are getting very close.
Good evening (morning) my fellow Cryptocurrency trader, I hope you are having a nice day.
The same level has been tested over and over and over since December 2024 and it continues to hold. XRP managed to wick below $2 more than twelve times, this support continues to hold. When prices move lower, buyers quickly show up.
Look at this, before 7-April XRP was moving below $2 very often. After 7-April, only twice. Big difference. This reveals a bullish bias. When the market was bearish, this support was tested more often than not. As soon as XRP turned bullish, it was tested only once recently and once after the 7-April bottom.
This little dynamic here shows that the bulls have the upper-hand and this is all we need to know. Knowing that the bulls have the advantage, when the market breaks it is going to break up. A bullish continuation. It is confirmed and it is only a matter of time.
How long? Only the market knows but it is not far away. The longer it takes, the stronger the bullish wave that follows. Strong growth is likely to develop within days.
Namaste.
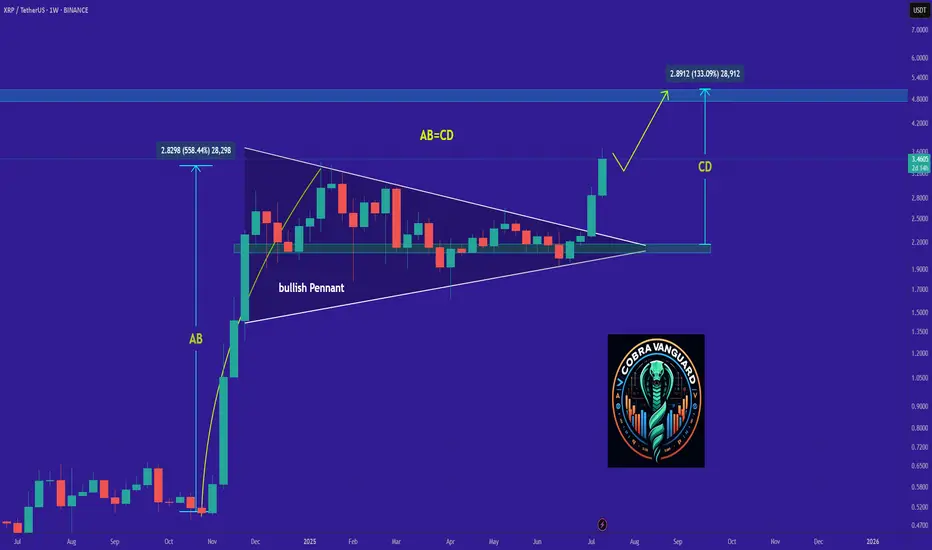
Be careful with RIPPLE !!!The pennant pattern has been broken, and the price follows an AB=CD pattern, targeting a rise above the 5 dollar.
Best regards CobraVanguard.💚
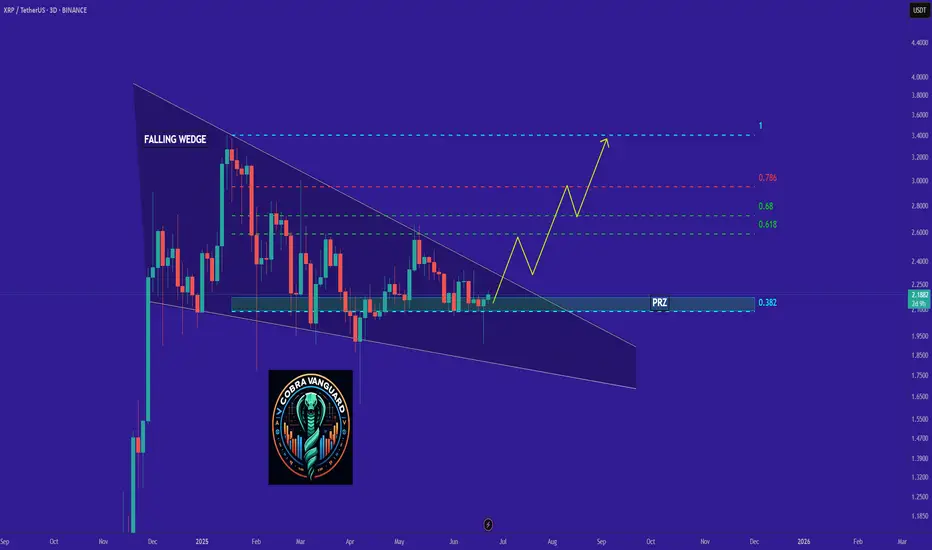
XRP's situation+ Target PredictionThe XRP is in a Bullish phase by a Falling Wedge Pattern.
A falling wedge indicates the potential for price to reach to $3.
Note if the PRZ ZONE is broken downwards with the strength of Bearish candles , this analysis of ours will be failed.
Best regards CobraVanguard.💚
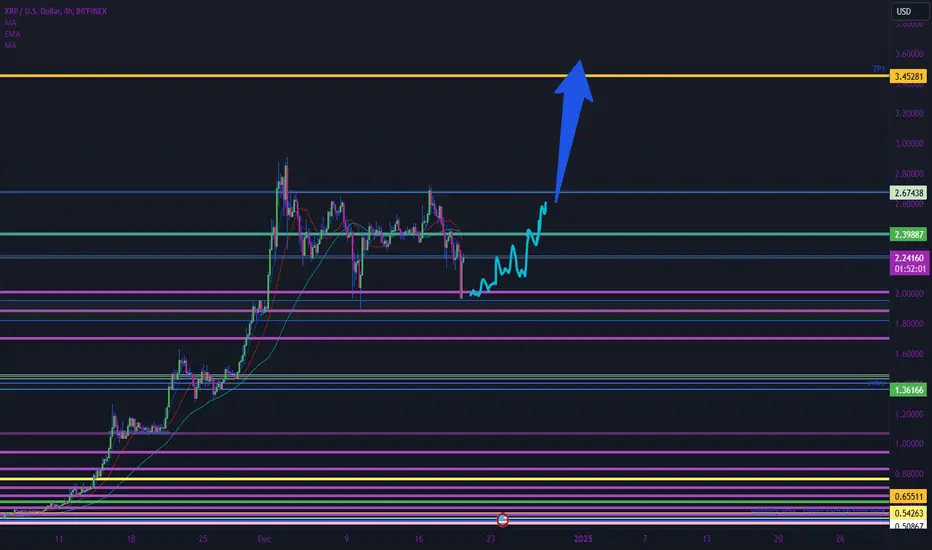
XRP rally to $8.50After XRP broke above the resistance at $1.80 now that became the major support for the past few months and XRP is taking off again.
According to this huge monthly triangle and calculate from the breakout, so the next target for XRP is $8.50 for the coming months.

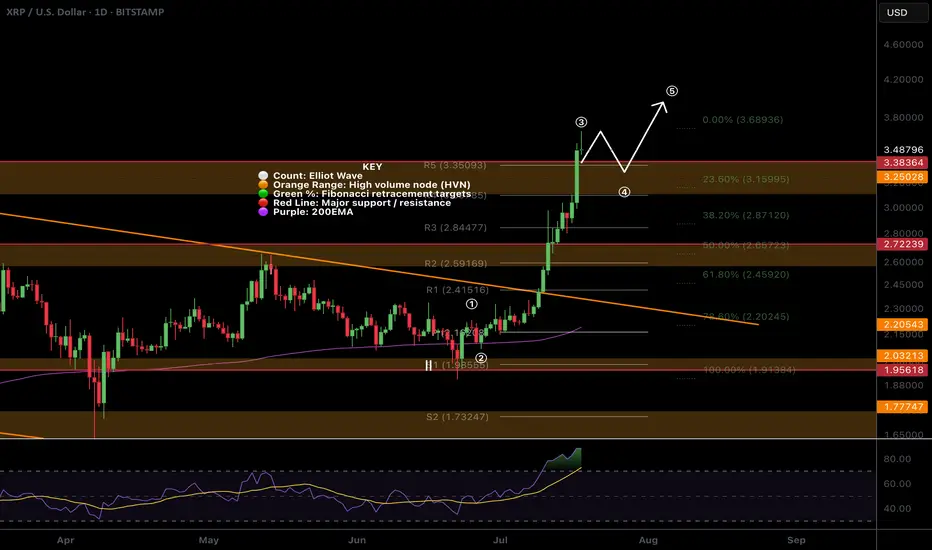
$XRP All time high! Time to sell or...?CRYPTOCAP:XRP appear to have completed wave 3 with a poke above all time high, typically this os behaviour of a wave 5.
The daily R5 pivot point has been breached so there is a significant chance of a decent pullback now but I wouldn't bet against the trend!
Wave 4 could be shallow, targeting the previous all time high, High Volume Node with waver 5 completing near $4.
Daily RSI is overbought but no bearish divergence yet which will likely emerge during wave 5.
Safe trading
XRP LONG TO ATHs! Ripple XRPUSD RLUSD XRP is Bullish to $4 at the very minimum. We successfully completed our retrace down to $1.95 to the dot. Expecting that to be our final support area and to start seeing consolidation, and upwards momentum. Media hype hasn't started yet, BTC is losing market dominance similar to 2017 2018. We are on the verge of another Diamond Hands bull run. Make sure to take some profits when emotions are hitting super dopamine levels of euphoria. The final pump happens fast and retraces even faster. The volatility will be insane.
Well keep tabs on this as the weeks go by. Good luck you beauties!
XRP - One More Wave Soon!Hello TradingView Family / Fellow Traders. This is Richard, also known as theSignalyst.
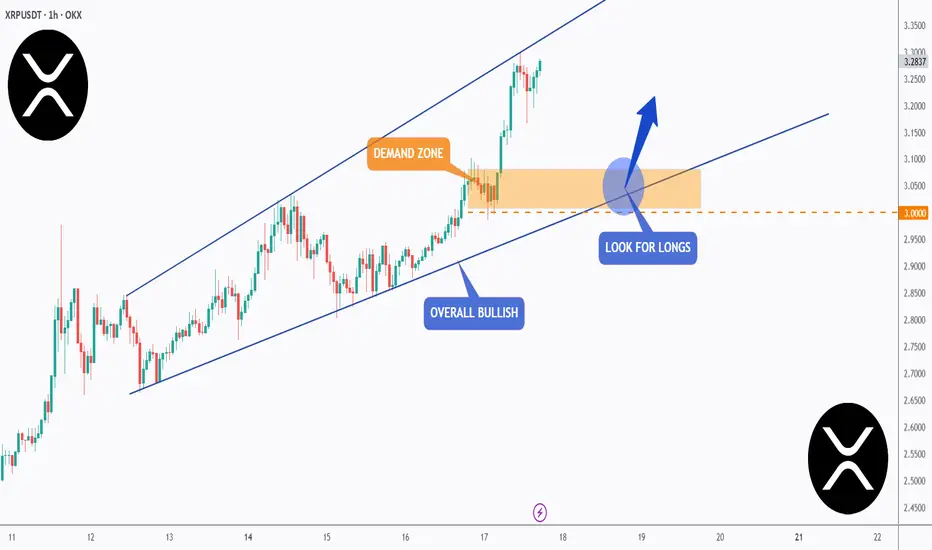
📈XRP has been overall bullish trading within the rising wedge pattern in blue.
However, it is approaching its all-time high at $3.4.
🏹 The highlighted blue circle is a strong area to look for buy setups as it is the intersection of the orange demand zone and lower blue trendline acting as a non-horizontal support.
📚 As per my trading style:
As #XRP retests the blue circle zone, I will be looking for bullish reversal setups (like a double bottom pattern, trendline break , and so on...)
📚 Always follow your trading plan regarding entry, risk management, and trade management.
Good luck!
All Strategies Are Good; If Managed Properly!
~Rich