XRP - Wait For It!Hello TradingView Family / Fellow Traders. This is Richard, also known as theSignalyst.
📈 Is history repeating itself? 🤔
XRP is now back at the $1.75–$2 support zone and forming a fresh inverse head and shoulders pattern.
As long as this support holds, we’ll be on the lookout for new long opportunities. 🟢
For the bulls to take over in the short term, a break above the green neckline is needed.
And for long-term control, a break above the red structure is essential. 🔺
For now, we wait patiently! ⏳
📚 Always follow your trading plan regarding entry, risk management, and trade management.
Good luck!
All Strategies Are Good; If Managed Properly!
~Rich
Xrp
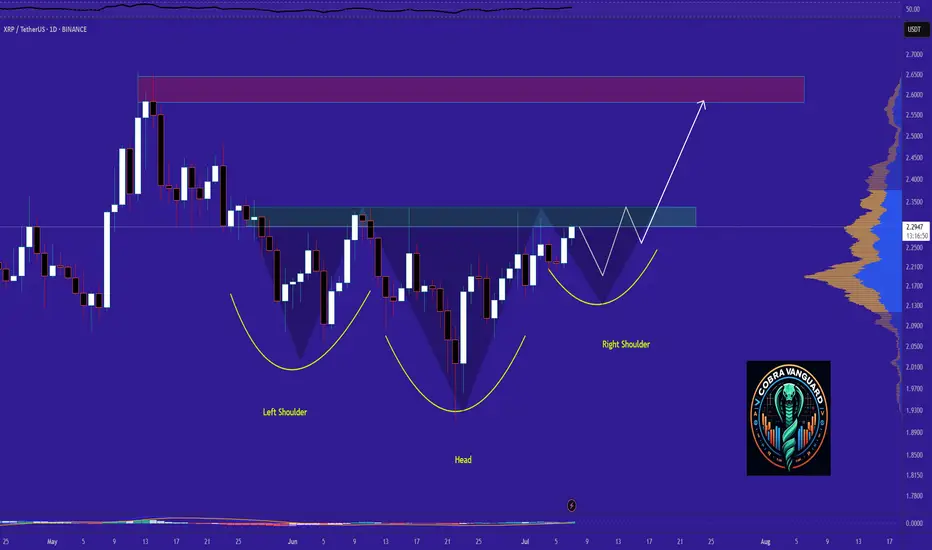
XRP - Time to buy again! (Update)It seems the price is forming a head and shoulders pattern, which, if correct, suggests a good price increase in the coming days. However, we should wait for the pattern to fully complete.
Best regards CobraVanguard.💚
XRP $1.95DISCLAIMER:
This analysis is for educational and informational purposes only and does not constitute financial advice. I am not a licensed financial advisor or professional trader. Always do your own research and consult with a qualified financial professional before making any trading decisions.
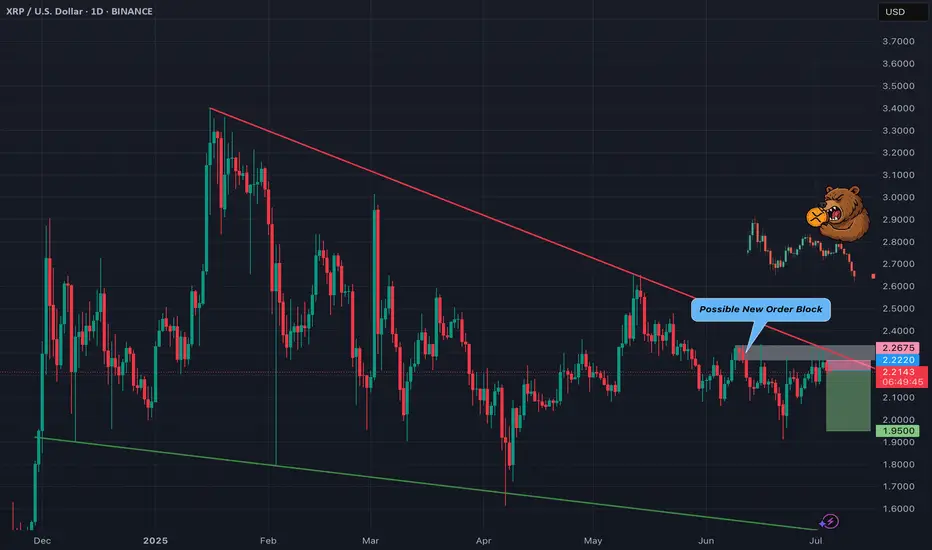
XRP is showing clear signs of weakness as price approaches the long-term descending trendline. Back on May 14th, we saw a strong bearish reaction — a thick-bodied candle rejecting directly off the trendline. Since then, price has struggled to revisit the trendline, failing to even tap it again.
Most recently, XRP has been leaving repeated upside wicks, suggesting aggressive sell orders are filling around the 1.27 extension, which I believe is being defended by a hidden bearish order block. Price action confirms that buyers are being absorbed before a full retest of the trendline.
This reinforces the short bias with a setup targeting a break below $1.95.
• Entry: Below $2.22
• Stop Loss: $2.2675
• Take Profit: $1.95
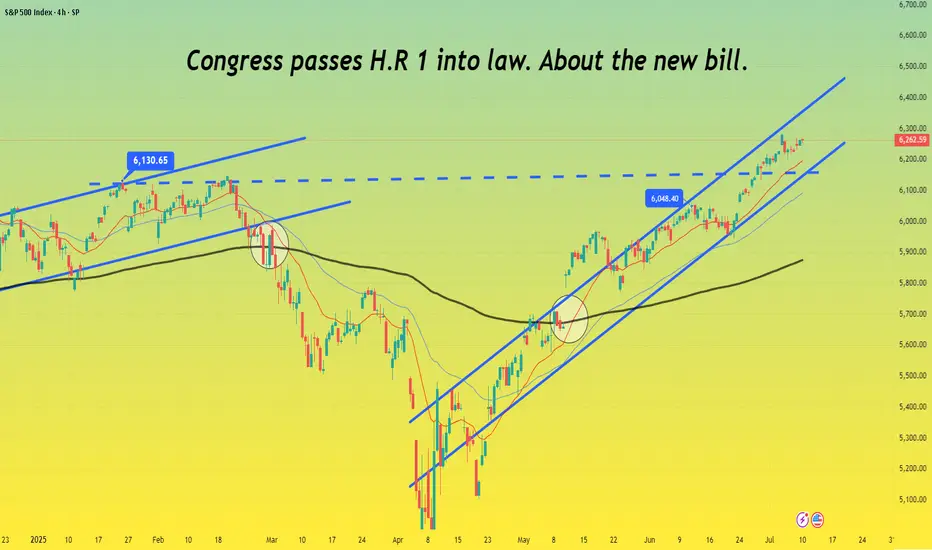
Congress passes H.R 1 into law. About the new bill.🔵 In what's been an eventful last few weeks congress passed H.R 1 which is essentially Trump's 900 page mega bill Act. Both Democrats and Republicans ultimately united against each other over the bill with Vice President Vance casing the tiebreaking vote giving Senate Republican's the large legislative victory.
🔵 To note is that independent-minded Republican Lisa Murkowski, senator of Alaska had some concerns with the bill before GOP negotiators we're able to acquire her vote for the 50-50 votes. Murkowski's primary issue was with the legislation's changes to Medicaid and federal food assistance funding which she was concerned would hurt her home state understandably. Republican's originally tried to sway her vote by adding language to shield Alaska from the full effect of the legislation's Medicaid and SNAP cuts.
🔵 Parliament opposed that as it violated the Byrd Rule which is there to determine the legislation that can go into a budget reconciliation package as well as passing with only GOP votes. Least to say the amendment was reworked many times in order for the waivers for the SNAP funding cuts to apply more broadly than just Alaska and Hawaii. Parliament rejected the prior amendment and language which targeted just the two states understandably.
🔵 With the rework the new SNAP provisions are planned to reduce food assistance funding more slowly in about 10 states with the number ultimately being decided by a formula and based on the error rate in delivering food assistance benefits in a year. After an arduous process the amendment was passed and Republican's secured the vote with Murkowski saying it was an agonizing process.
🔵 When speaking with reporters afterwards Murkowski noted that the process was stressful with them operating under an artificial timeline in reference to the pressure Trump put on the Senate to pass the bill.
🔵 Her concern was as follows: “Rather than taking the deliberative approach to good legislating, we rushed to get a product out. This is important. I want to make sure that we’re able to keep in place the tax cuts from the 2017 Jobs Act,” said Murkowski when asked about her support for the bill and why it was hard for her to come around to giving her vote.
🔵 “I struggled mightily with the impact on the most vulnerable in this country when you look to the Medicaid and the SNAP provisions,” said Murkowski. This point highlights just how the effort to push the bill through was met with haste and pressure notably.
🔵 The bill itself is projected to add $2.8 trillion to the federal deficit by 2034. Main reason for that would be thanks to a reduction in revenues as well as interest cost which could have the deficit rise by a potential $5 trillion if some temporary provisions become permanent. Interest payments on the national debt are also expected to increase significantly by 2034.
🔵It should be noted that these numbers and estimates are based on a "current law" baseline and are largely thanks to tax cuts in the bill with Economist having differing opinions on the economic impact of the bill. Time will tell us how estimates go but least to say this is a large turnaround from what many we're expecting with even DOGE's Elon Musk opposing the Bill and forming a new party in strong opposition.
🔵 The tax and spending bill will see spending increase and phase in a cut to Medicaid of an estimated $1 trillion over the next decade with the CBO projecting roughly 11.8 million more American's t hat would become uninsured within the next 10 years compared to the current law. This could lead to many losing healthcare services due to medical cost with states as well likely needing to adjust their own programs and having to take on a larger share of the cost whether that means reducing services or even closing some facilities.
🔵 The bill has many key changes but in summary it solidifies many tax breaks from Trump's first term with an estimated $4.5 trillion in tax cuts alongside tax deductions on tips, overtime and auto loans with deductions for adults that make under $75,000 and a boost to the child tax credit from $2,000 to $2,200 though millions of families at lower income levels would still not receive the full credit as one of the credit's, requirements is a minimum earned income of $2,500. In 2022 alone an estimated 18 million children under age 17 (26 of all children) were ineligible for the full child Tax credit because the family income was not high enough as reported by Columbia University's Center on Poverty and Social Policy.
🔵 To say in the least the new bill has many implications for the country and the next few months and years will definitely represent those changes and how the country shifts and adjusts to this with many having differing opinions understandably. I'll definitely keep you guys posted through it all but definitely a lot to see so much happen so quick and only time will tell and show us just how things play out simply put. The market itself is still continuing within this ascending channel, especially since we got that convergence with the 200 EMA and broke that $6,130 resistance. $6,300 is what I'm expecting resistance to hit the strongest so definitely gonna keep an eye there as traders process the news and changes.
🔵 Have to go but grateful as always for the support, definitely a long idea here but wanted to focus on some important points though the bill itself has so many changes it's hard to go over every one but you get the point. This is a big changes and we'll definitely see things shift a lot over the next few months and years and as always we'll keep posted with things. Thanks as always and all the best.
Best regards,
~ Rock'
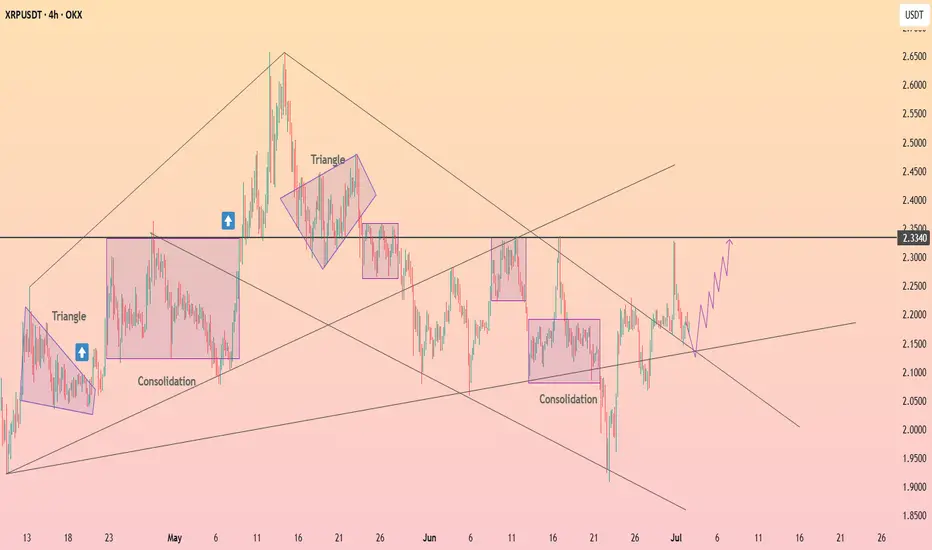
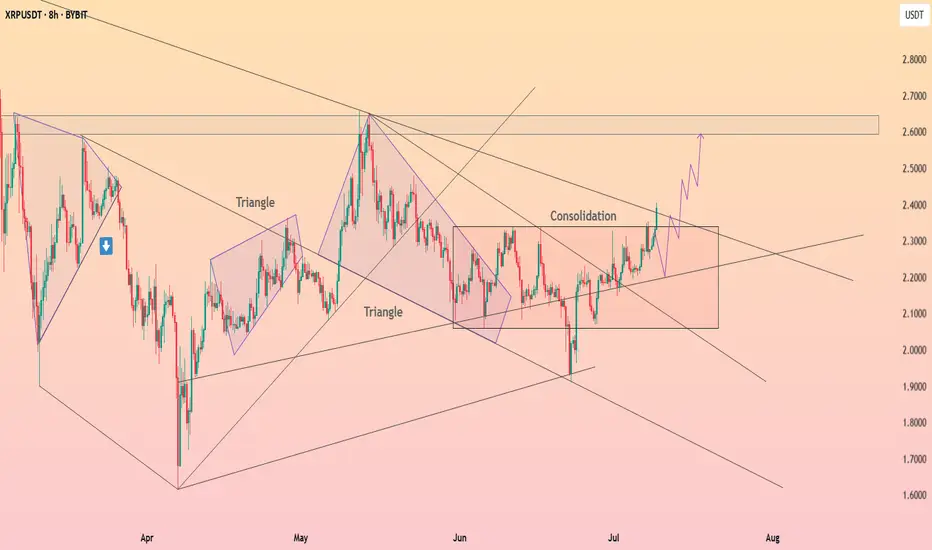
HolderStat┆XRPUSD got out of the consolidation areaBYBIT:XRPUSDT is building strength within a wide consolidation range after multiple triangle breakouts. Price is eyeing the 2.60 level, and structure suggests bulls are preparing for the next push.
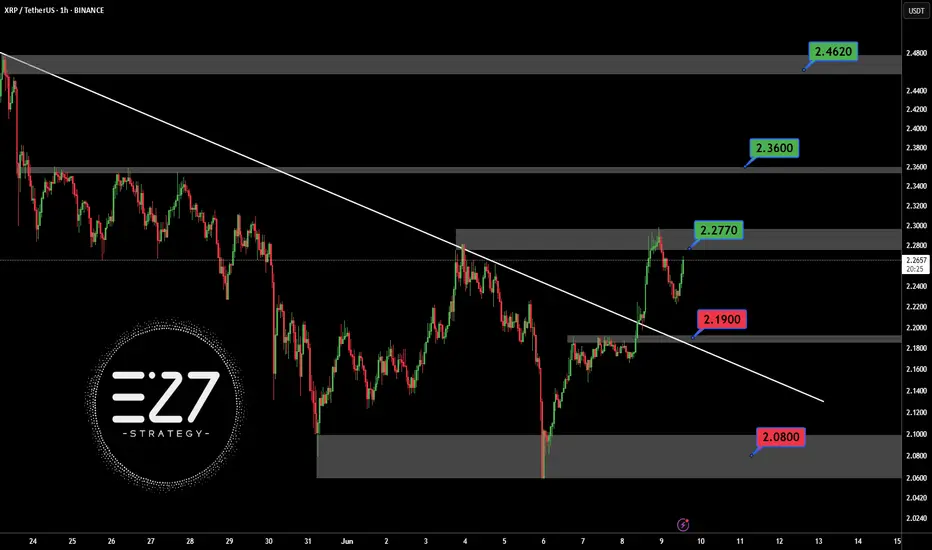
XRPUSDT BINANCE:XRPUSDT Price broke above the downtrend line but faced resistance at 2.2770 dollars and started correcting. Key supports are at 2.1900 and 2.0800 dollars. If it bounces, resistances to watch are 2.2770, 2.3600, and 2.4620 dollars. Price is currently between key levels.
Key Levels:
Support: 2.1900 – 2.0800
Resistance: 2.2770 – 2.3600 – 2.4620
⚠️Contorl Risk management for trades.
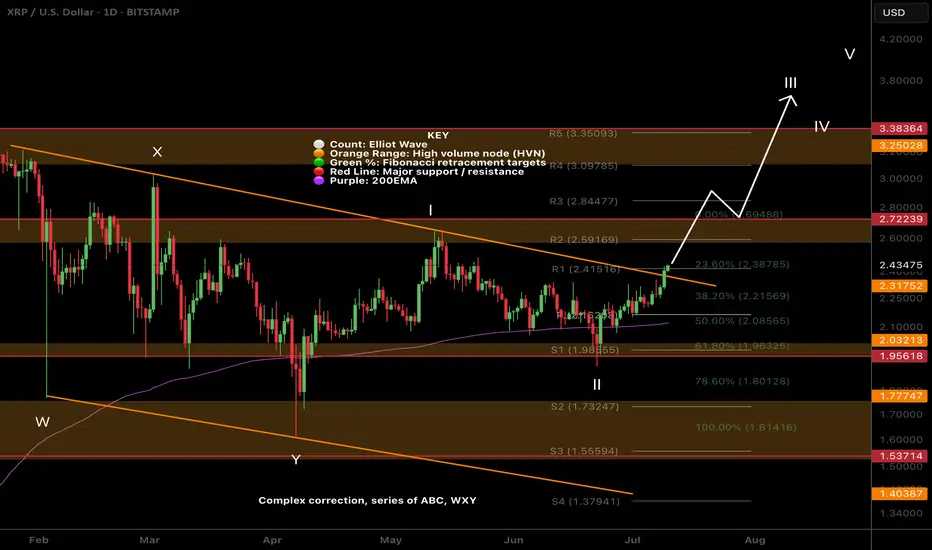
$XRP Bias Change: Bullish Elliot Wave CountCRYPTOCAP:XRP is breaking out the descending resistance causing me to take another look at my WXYXZ corrective Eliot Wave count expecting lower. I have adjusted the count to WXY and a 1-2 new motif wave with a target of $3.8
Price is well above the daily 200EMA and daily pivot after testing both as support including the High Volume Node. Closing above the descending resistance today will be a bullish signal but a retest of that resistance as support before continuing onwards its what to look out for.
Analysis is invalidated below $1.8
Safe Trading
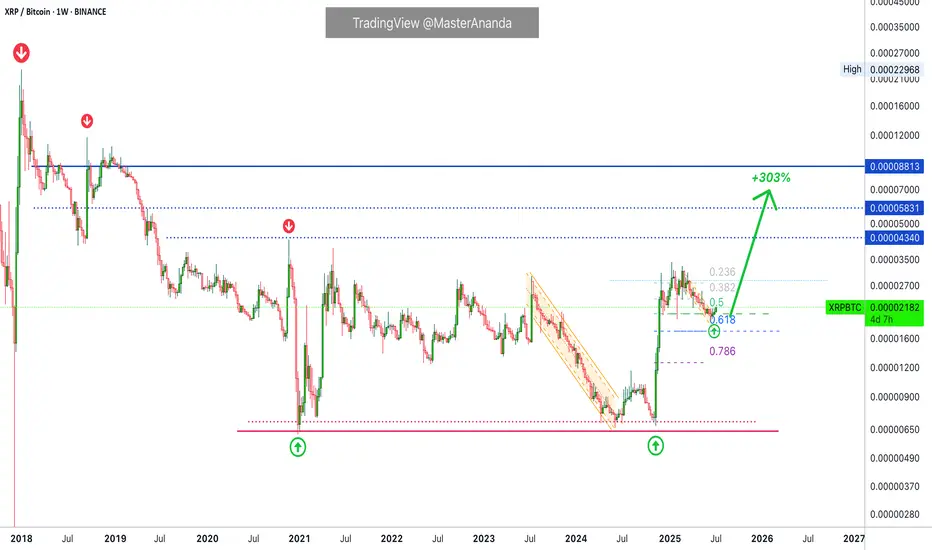
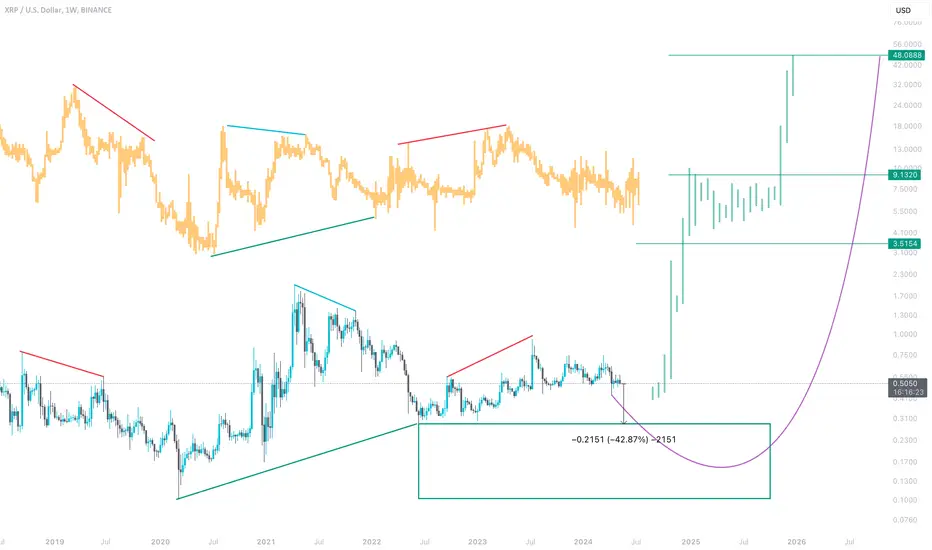
XRPBTC 303% Bullish Wave in the Making (Or Higher)One of the most unique charts in the entire Cryptocurrency market, XRPBTC produced very little retrace after its major late 2024 bullish breakout and recovery. This small retrace is a signal of strength. When prices produce a strong advance but fail to move deep once the advance is over—consolidation happening at high prices—this is one of the strongest signals the market can offer.
XRPBTC started at a low of 674 satoshis in mid-November 2024. The peak happened two months later at 3419 satoshis. Mid January 2025. Now, the retrace lowest point in June was 1928 satoshis. This is 185% higher compared to the November 2024 low, that's what I mean by strength.
The fact that there wasn't strong selling pressure after a 400% bullish wave, signals that participants are ready to hold long-term. And this is a great choice, people are smart. They are holding because they know XRP will continue to grow.
When it comes to Fibonacci retracements, the correction found support right at 0.5. When the market is weak, it tends to move below 0.618 and reach 0.786 or lower before recovering.
The rounded bottom is already in and the candles are starting to curve. Three weeks green, we can expect XRPBTC to produce a new wave of growth. The targets can be found on the chart.
Namaste.
#XRP Update #1 – July 8, 2025🟢 #XRP Update #1 – July 8, 2025
XRP has touched the lower edge of its 20-day ascending trendline and is currently holding above the 200 MA, a positive sign technically.
While there is a resistance zone above, it doesn’t appear too strong. Minor selling pressure might emerge around 2.35, but overall the setup looks promising.
▫️ Entry: 2.260
▫️ TP1: 2.320 (50%)
▫️ TP2: 2.390 (50%)
▫️ Stop: 2.235
▫️ RR Ratio: 5.15
❗️ With a tight stop (~1%) and a potential upside of 5.7%, this setup offers a favorable risk-reward opportunity. If it aligns with your capital and risk tolerance, it may be worth considering.

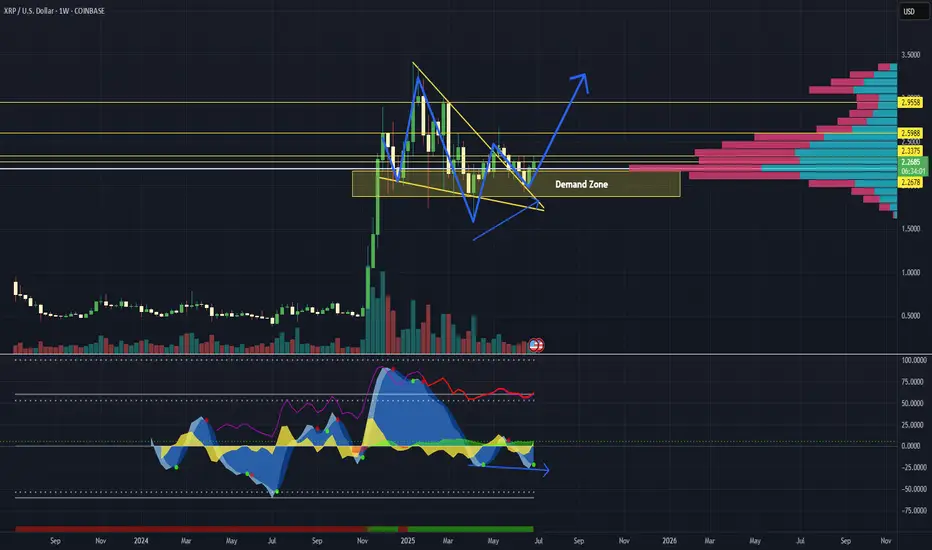
XRP: Ripple Ready to Unleash a Tsunami?Ripple (XRP) is coiling like a spring—ready to explode. After five clean re-tests of a powerful demand zone, buyers have repeatedly stepped in to defend key levels, launching 40–75% swings each time. Is this the moment it unleashes the wave?
🔍 Technical Breakdown:
✅ Demand Zone Strength
XRP is bouncing from a long-tested demand zone (5+ re-tests). Each bounce led to substantial upside momentum.
✅ Bull Flag Retest
XRP previously broke out of a large bull flag and has been holding the flag’s top trendline for over 40 days—acting as strong support.
✅ Higher Low Structure
Price formed a higher low (H/L) and has climbed steadily for two weeks—building bullish structure.
✅ Volume Profile
Price reclaimed ground above the high-volume node, signaling accumulation strength.
✅ Market Cipher B Divergence
A weekly hidden bullish divergence is present—not massive, but notable—hinting at momentum shift.
⚠️ What to Watch:
Volume is key: Current consolidation shows a decline in volume—a surge could ignite the breakout.
Confirmation for conservative traders: Wait for a break and hold above $2.33 with volume, or a retest of that level.
If past demand zone reactions repeat, a breakout could be imminent.
What do you think?
📈 As always—this is not financial advice. Do your own research.
🧭 Happy Hunting!
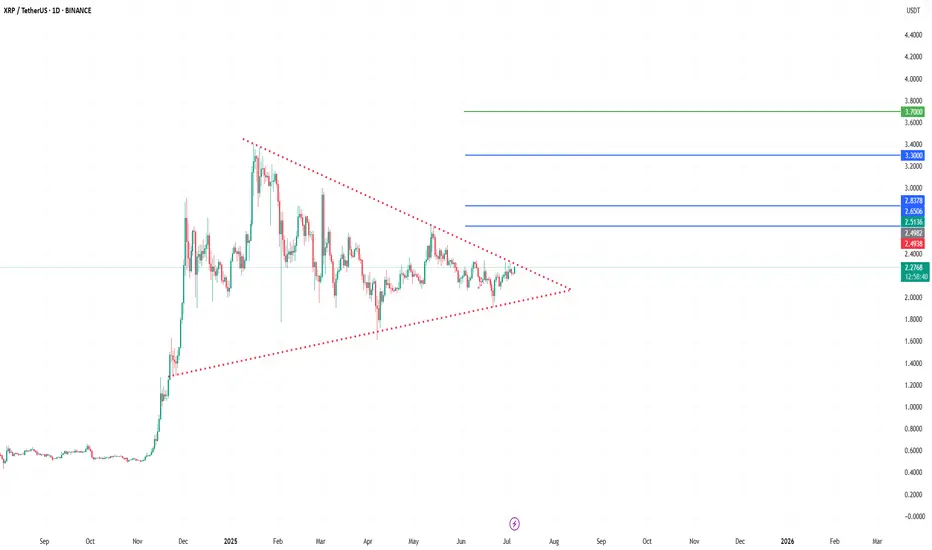
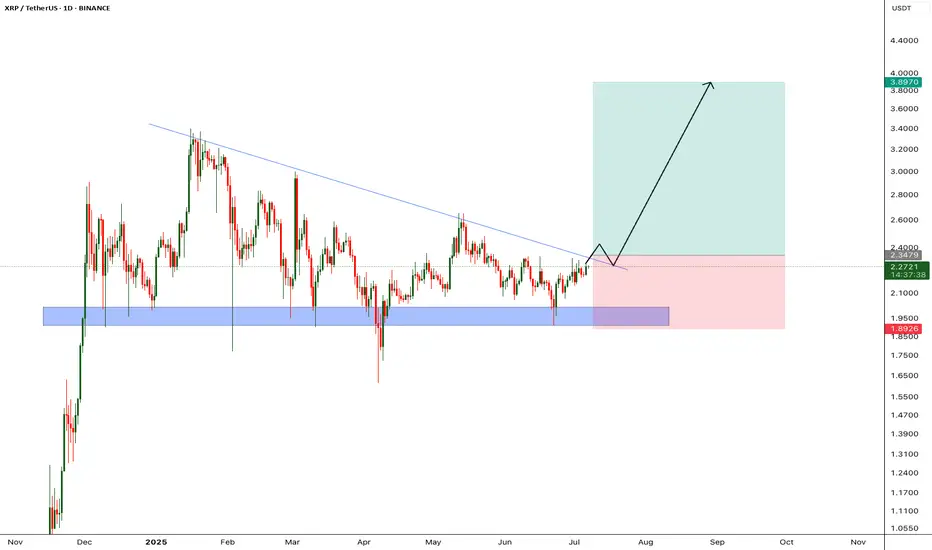
XRP/USDT| Targeting $3.3 to $3.7📝 Description:
XRP has been consolidating inside a large symmetrical triangle on the daily chart since early 2025. Price is now approaching the apex, suggesting a potential breakout move is near.
🔹 Upper trendline resistance: ~$2.49
🔹 Lower trendline support: ~$1.90
🔹 Breakout level to watch: $2.45–$2.50
✅ If a breakout is confirmed with strong volume, potential upside targets include:
🎯 $3.30 – mid-range target
🎯 $3.70 – full breakout objective
A spike in volume will be key to confirming the move. Until the breakout is validated, this setup remains neutral.
📌 This is not financial advice – please do your own research before making any trading decisions.
💬 What’s your target for XRP if this breaks out?
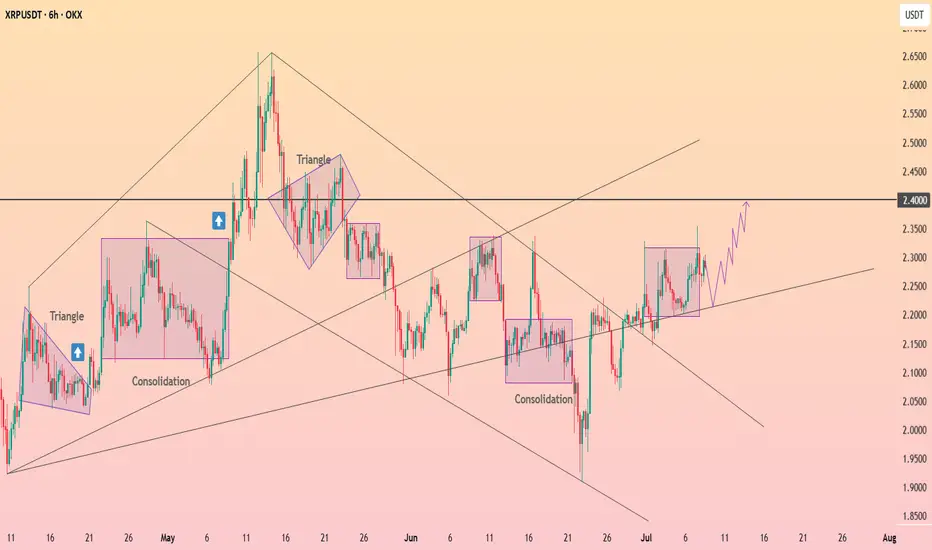
HolderStat┆XRPUSD targeting $2.4BINANCE:XRPUSDT is printing repeated consolidation zones and ascending structures. Price is currently rebounding above 2.20, eyeing a breakout toward 2.40. The bullish momentum persists with higher lows and breakout setups.
XRP - How they gonna know? They gonna know!Huuuhh XRP blind longs eh? But yeah you can but if i was I wouldn;t

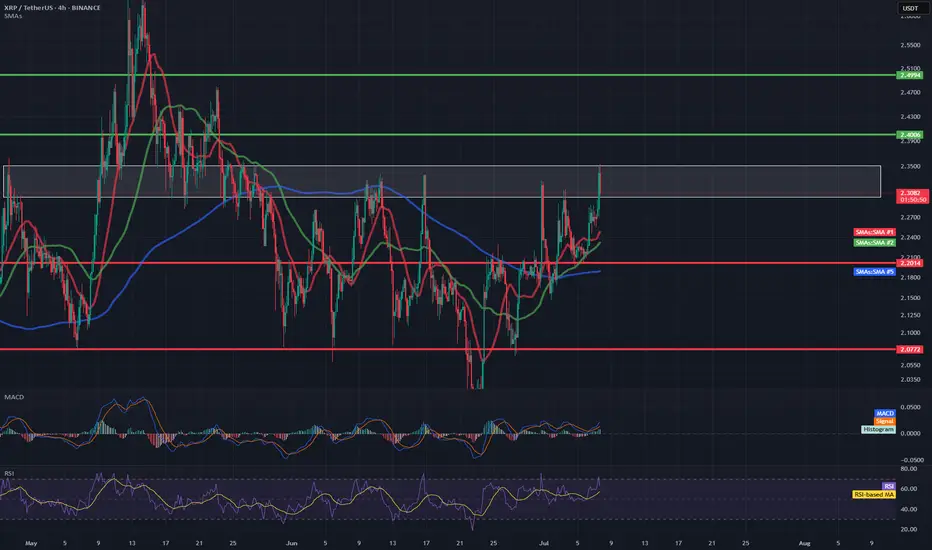
XRP/USDT 4H📊 1. Trend and moving averages
Red line (SMA 10) – short-term, currently rising, which suggests upward momentum.
Green line (SMA 20) – also in the upward trend and below the price – dynamic support.
Blue line (SMA 50/200) – probably SMA 50 or 200 – the price has broken through it from below and is currently above it – this is a pro-growth signal.
📌 Conclusion: In the short and medium term, a reversal of the trend to growth is visible.
📈 2. MACD (Moving Average Convergence Divergence)
The MACD line has crossed the signal line from below, which is a buy signal.
The MACD histogram is rising and is above zero – further confirmation of the upward trend.
📌 Conclusion: The upward momentum is increasing.
💪 3. RSI (Relative Strength Index)
RSI is currently at ~62, which means that:
We are still ahead of the overbought zone (70).
RSI is rising – it suggests bullish buyer pressure.
📌 Conclusion: There is still room for further growth before the market is overbought.
🔍 4. Market structure and resistance/support
The price is in the 2.30–2.35 USDT zone, which previously acted as resistance.
The closest resistance is around 2.38–2.40 USDT – the level from May, where the decline occurred.
The closest support is around 2.20 USDT (in line with the green SMA) and stronger at 2.05–2.10 USDT (earlier consolidations).
📌 Conclusion: Breaking 2.40 opens the way to a test of 2.50 and above.
🧠 Technical Summary
Aspect Rating
Trend (SMA) ✅ Up
MACD ✅ Buy
RSI ⚠️ Near overbought
Resistance/Support ⚠️ Resistance at 2.38–2.40
Movement Potential ✅ To 2.50 or higher
📌 Potential scenarios:
✅ Bullish (uptrend scenario)
A hold above 2.30 and a breakout of 2.40 could give an impulse for further gains towards 2.50–2.60.
Strong confirmation would be an increase in volume.
⚠️ Bearish (correction scenario)
A rejection from 2.38 and a drop below 2.20 could initiate a retest of support at 2.05 or even 1.95.
XRP/USDT – Breakout Confirmed!Hey Traders — if you're into high-conviction setups with real momentum, this one’s for you.
XRP has finally broken out from the massive symmetrical triangle on the 1D timeframe after holding the green support zone like a champ.
This structure has been compressing for months, and with this breakout, momentum could be shifting in favor of the bulls.
Entry: Current Market Price (CMP)
Add More: On dips above $2.20
Targets: $2.60 / $2.95 / $3.40 / $3.80
Stop Loss: $2.05
Leverage: 5x–10x
As long as price stays above the breakout zone, this setup holds strong potential. Keep a close eye for volume confirmation and follow-through.
Let’s see how this plays out. Will update as it unfolds.
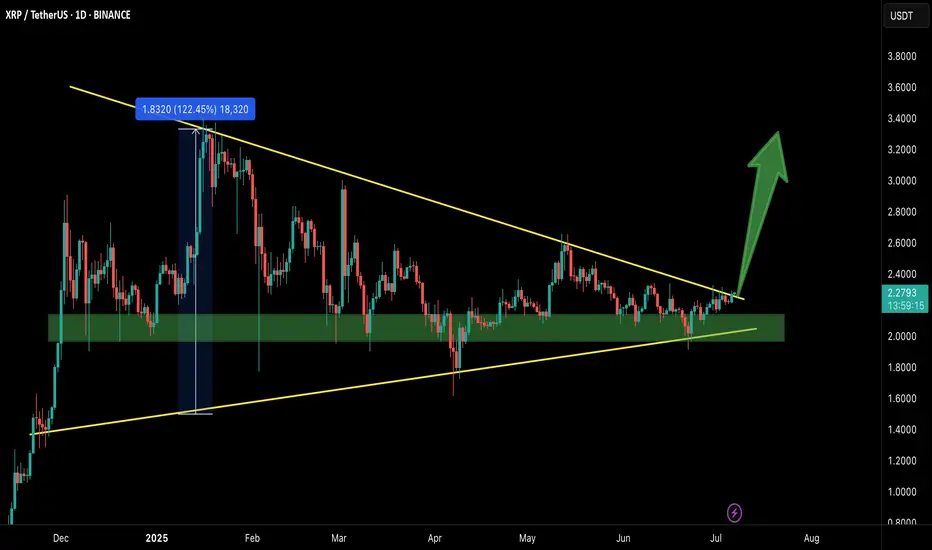
XRP - Huge breakout incomingXRP price is retesting it's descending trendline, in the past price got rejected from this trendline multple times, however im expecting price to breakout from this trendline since we almost at the last 2 quarters of bull run.
We will enter the trade after candle closes above the trendline
Entry Price: 2.34
StopLoss: 1.89
TP1: 2.5981
TP2: 2.8543
TP3: 3.2796
TP4: 3.8676
Like and follow.
Cheers
GreenCrypto
XRP .. few weeks before next bull?A new low is possible before Bull run!
it may be huge or one candle ,,
don't take the fractal exactly as you see for every movement
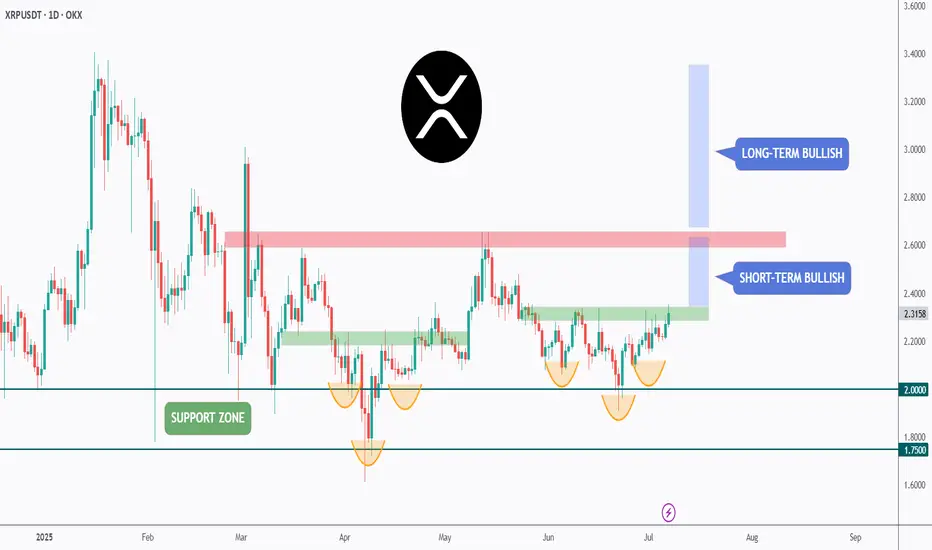
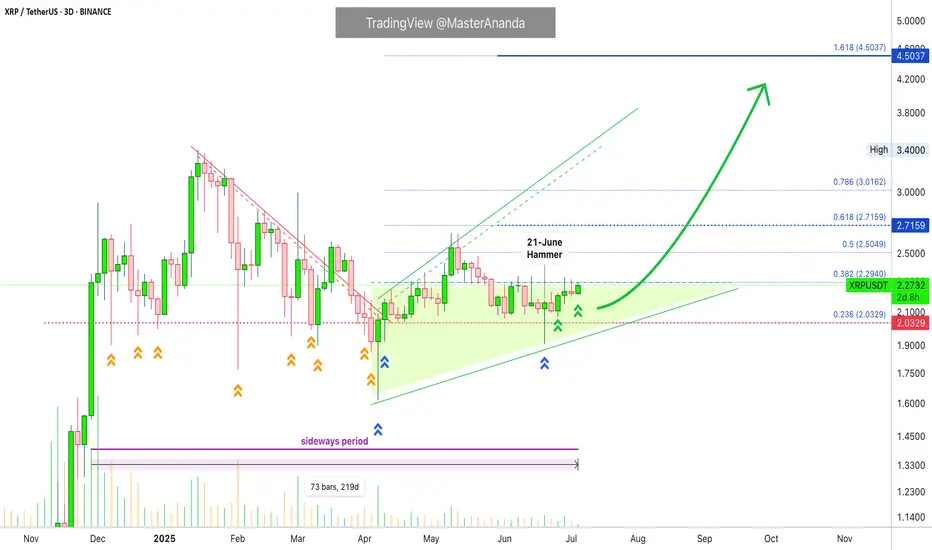
XRP $2 Support Updated, Tested 12 Times & When BullishThere is one number, a price level, that defines XRP's current situation. Either bearish or bullish depends on this number: $2.
As long as XRPUSDT trades above $2, we know the bulls have the upper hand and the bullish bias is confirmed.
If XRPUSDT moves and closes below $2, we know the bulls are losing momentum, the bears are gaining the upper hand and lower prices are possible.
What is the current situation?
XRP continues to trade above $2 and this price continues to be left behind, meaning, the bulls are winning.
Before 7-April, this level was tested over and over, again and again. After 7-April, only two challenges and the last one, 21-June, ended as a perfect bullish hammer. Now the action is moving higher toward resistance, growing not lower. $2 has been confirmed as support.
Now that support has been confirmed, we can expect additional growth. It can take some time, maybe a few days but the bulls are in control.
It can take some time, not that long, the market has been sideways for more than 7 months. This is a long-time and no more is needed. The consolidation period just reached its end.
The final low happened late last month, Crypto is set to grow; XRP will be doing great in a matter of days. Closer than anything you can think or expect, next week can be boom, sellers are exhausted. People are back to work.
Thank you for reading.
We are about to experience a growth explosion.
Namaste.
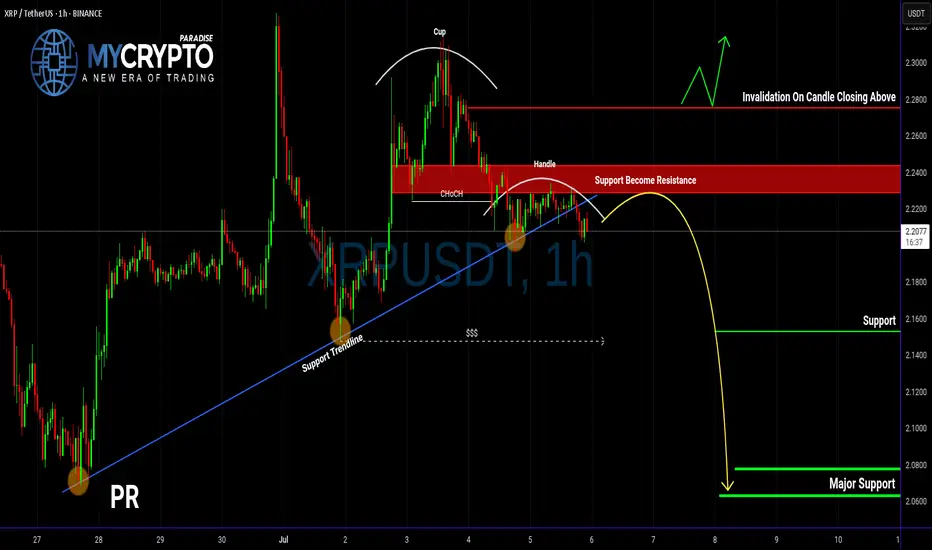
XRP Breakdown Ahead? Don’t Get Caught LongYello, Paradisers! Are you about to fall into a classic trap on XRP? The signs are stacking up, and if you're not careful, this move could catch a lot of traders on the wrong side of the market.
💎XRPUSDT is showing clear signs of weakness. A bearish CHoCH (Change of Character) has formed, and an inverse Cup & Handle pattern is currently playing out. On top of that, price action has decisively broken below the key support trendline. These signals together significantly increase the probability of a deeper bearish move in the coming days.
💎From the current price level, XRP is offering a 1:1 risk-to-reward setup. While this may attract more aggressive or short-term traders, the safer and more strategic approach is to wait for a proper pullback before entering. That would allow for a more favorable risk-to-reward and confirmation of the trend direction, reducing the likelihood of being caught in short-term noise.
💎It’s also crucial to watch the invalidation level. If XRP manages to break back above that zone and close a candle above it, this would invalidate the current bearish idea entirely. In such a case, it's better to stay patient and wait for clearer price action before making any decisions.
🎖Strive for consistency, not quick profits. Treat the market as a businessman, not as a gambler.
MyCryptoParadise
iFeel the success🌴
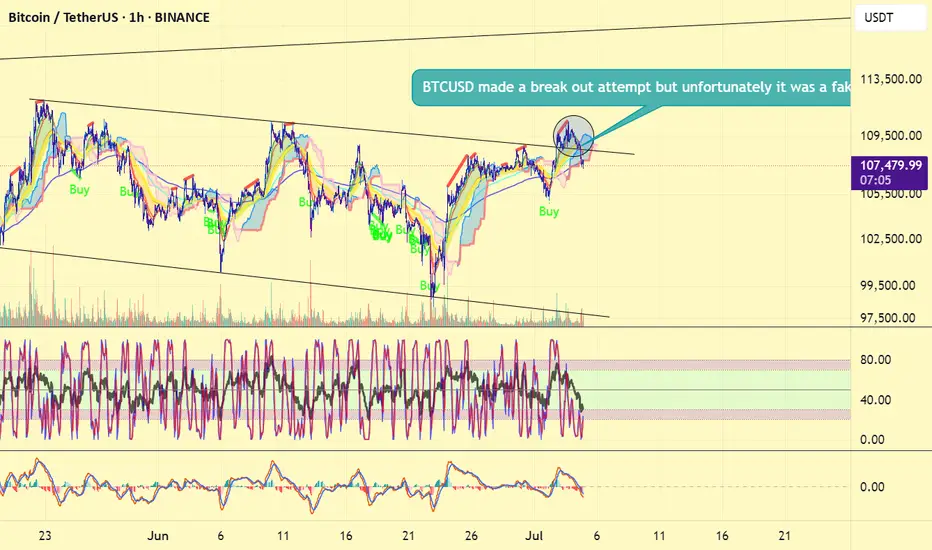
All this just before Fedwire implements ISO20022?#bitcoin #btc price attempted a breakout but today failed with dumps. There "may" be other attempts but while ISO20022 subject is approaching, isn' t it wise to think about #xrp and other ISO20022 licenced coins will overperform the others (BTC, ETH, SOL and all other non iso certified coins) in near future? Not financial advice.
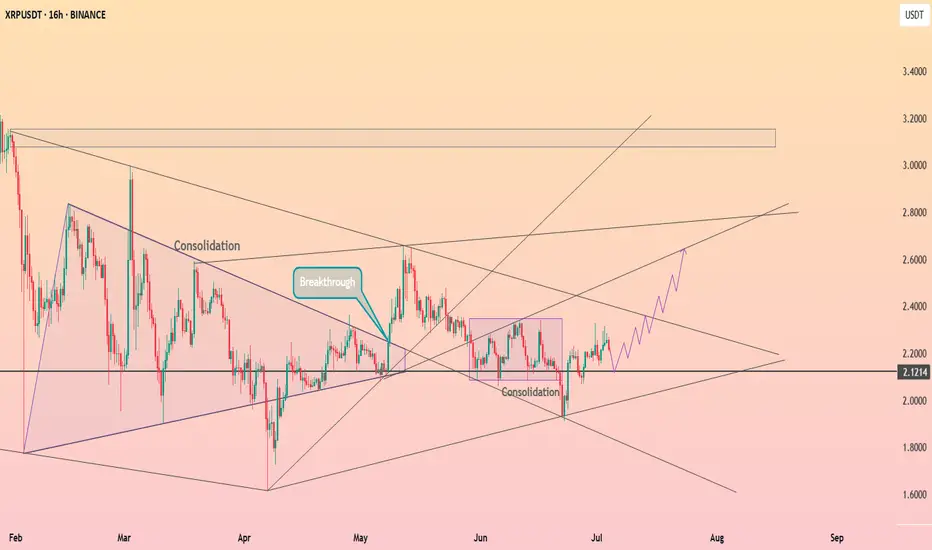
HolderStat┆XRPUSD forms an ascending structureBINANCE:XRPUSDT is forming a stair-step bullish pattern after breaking out of consolidation above 2.12. The current trajectory suggests continued movement toward 2.70, with multiple support bounces validating the structure. Price action remains favorable for bulls.
HolderStat┆XRPUSD forming the rising bottomBINANCE:XRPUSDT has broken above resistance and is consolidating above the breakout zone. This mirrors previous triangle–consolidation patterns that preceded upside moves. If momentum continues, a run toward 2.34 is in play.