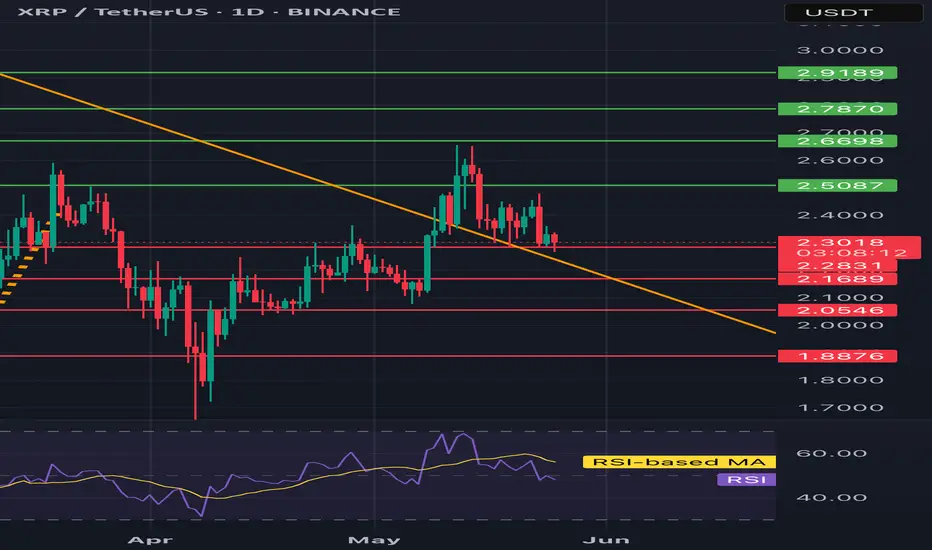
XRP/USDT 1D chart reviewHello everyone, let's look at the 1D XRP chart to USD, in this situation we can see how the price lasts above the downward trend line.
Going further, let's check the places of potential target for the price:
T1 = $ 2.51
T2 = $ 2.67
Т3 = 2.79 $ t4 = $ 2.92
Let's go to Stop-Loss now in case of further declines on the market:
SL1 = $ 2.31
SL2 = $ 2.17
SL3 = $ 2.06
SL4 = $ 1.89
Looking at the RSI indicator, you can see how he reacted and returned to the middle of the range, which creates a place for a panty growth.
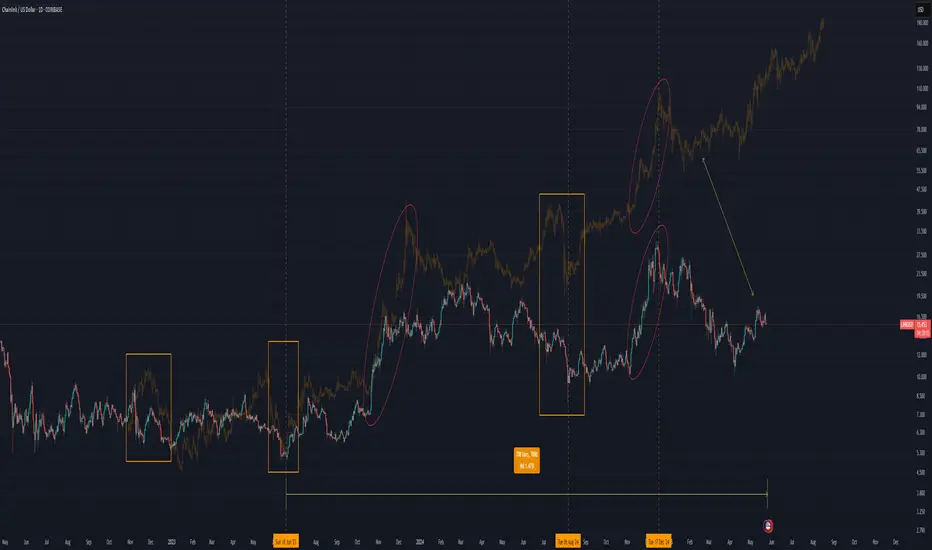
Xrp
The Greatest Chainlink Bar Pattern in History: The Crystal Ball For over 700 days now, following this Chainlink bar pattern has been the most profitable bar pattern I have ever found since I began this journey — it’s literally been a map of the future.
But for the first time, there has been a massive deviation. Let me explain.
We must go back to August 2020.
According to the bar pattern, we’ve just completed the same move from August 2020 — but the big difference here is that this time, it’s taken over 100 days to complete, while in 2020 it took just 30 days.
So far this cycle, it's the biggest deviation yet. Which has me thinking: what if this cycle breaks the four-year cycle and we extend beyond the 1,064-day cycle that's supposed to complete in October 2025?
Without this recent deviation, Chainlink would have completed the cycle bar pattern in August 2025.
My Chainlink Time Fib has a hit on this time period — August 2025. Something could happen around this time. This Time Fib has had major calls before, although it has also failed in the past.
The new deviated timeline for the cycle top:
This is what it would look like if the deviated bar pattern was shifted. Could this be a major clue showing us the future again? Are we catching a glimpse of what’s to come?
According to this new timeline, Chainlink rallies slowly until October 2025 — which lines up with Bitcoin’s cycle completion date. Bitcoin has never passed 1,064 days in a bull market. The last two cycles took exactly that long. So it’s interesting that price appears to grind upward to that date and then roll over.
It continues to roll over and apparently has a major retest of the lows:
This shows a retest of $10 in December 2025 — forming what could be the biggest bear trap in history — before a massive rally in 2026 leading to a March 2027 top.
I’ll be watching Chainlink like a hawk this year. So far, it has led the way for me and made this cycle pretty easy to read. Is it possible that the major run happens in 2026?
Stay safe, marines. 🫡
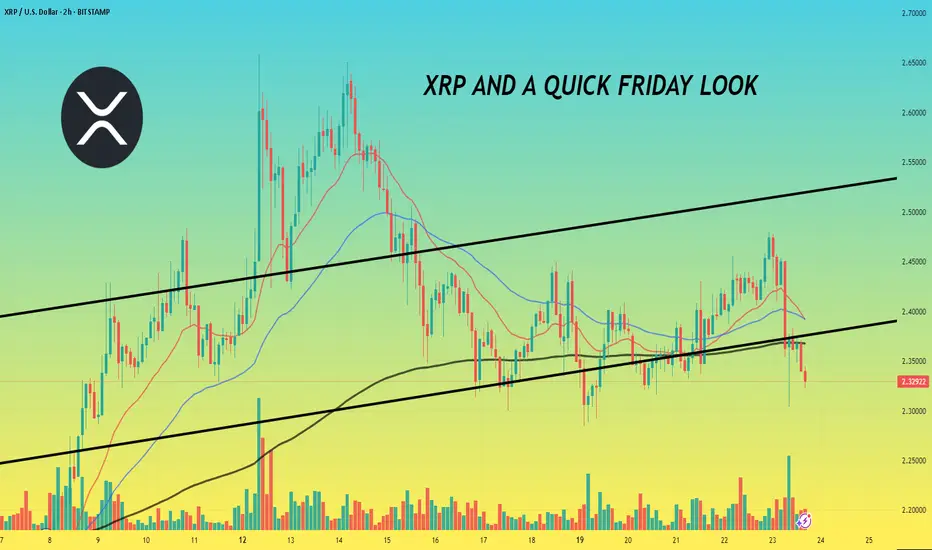
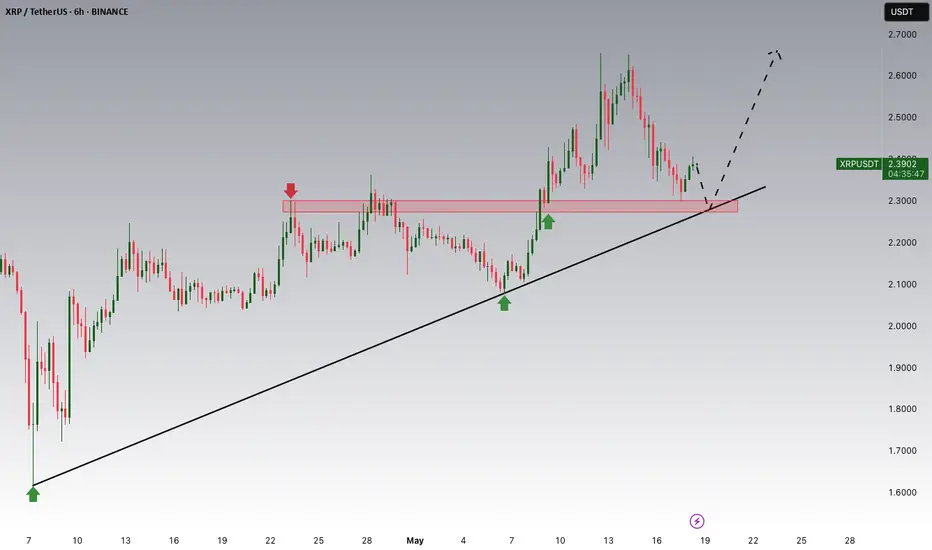
XRP AND A QUICK FRIDAY LOOK🔥 Hey hey, happy friday, it's definitely a busy one but hope everyone's doing well. As usual, we'll get going with our thoughts and try and keep things short.
🔥 Gonna focus on technical for the most part today as we look at things and follow up from our previous idea which is also linked below for reference.
🔥 Looking at our 2 hourly we can see that we're still we continued with the trend and we're able to keep within that ascending channel but we did end up hitting a pretty tough resistance at $2.5 at which we got a pretty quick reversal, sell off. More than likely a coordinated move to sell off enough to have us lose that 200 EMA which was successful.
🔥 We ended up losing that 200 EMA and as of currently we've exited our ascending channel so to get reference on things we've got our Fibonacci chart below to find some good horizontal levels, especially as we approach an important support level being $2.99-3
🔥Next few day's I'll be keeping watch of that Fibonacci Retracement Chart for those levels. It's not perfect but gives some pretty good insight on things and these sort of horizontal channels we've got. Take $2.45-$2.42 for instance. Whenever we got out the channel we broke out or at least tried to and whenever we fell below that $2.35 support we'd get vice versa and fall, retrace.
🔥 So main things so watch right now are whether or not we can keep within that channel or if we'll fall into the one below and if we can regain that 200 EMA or if we fail by which then we could be seeing a retest of $2.99 and should that fail look to $2.20 and $2.10.
🔥 Regardless, XRP still stands in a great position for the long term as we last noted on our previous Big picture idea and whatever happens within the next few days and weeks will simply be market makers playing their game and technical running things till we get some more news or developments. On that note I've got to run but happy we could get something quick out today.
🔥 And as always, thanks so much for the support! Really appreciate it and let's keep at it till, same as ever. Always have more to gain and get done, work towards. Till next, keep posted and have a positive day.
Best regards,
~ Rock'
HolderStat┆XRPUSD seeks to overcome $2.8CRYPTOCAP:XRP snapped a year-long down-sloping barrier, rocketed to 2.65 USDT, and is recharging in a slanted box whose floor sits on the 2.40 trend confluence. Hold that hinge and the next swing could tunnel into the 2.90-3.00 sell zone; surrender it and 2.20 becomes the logical rebound trench while the macro channel still tilts higher.
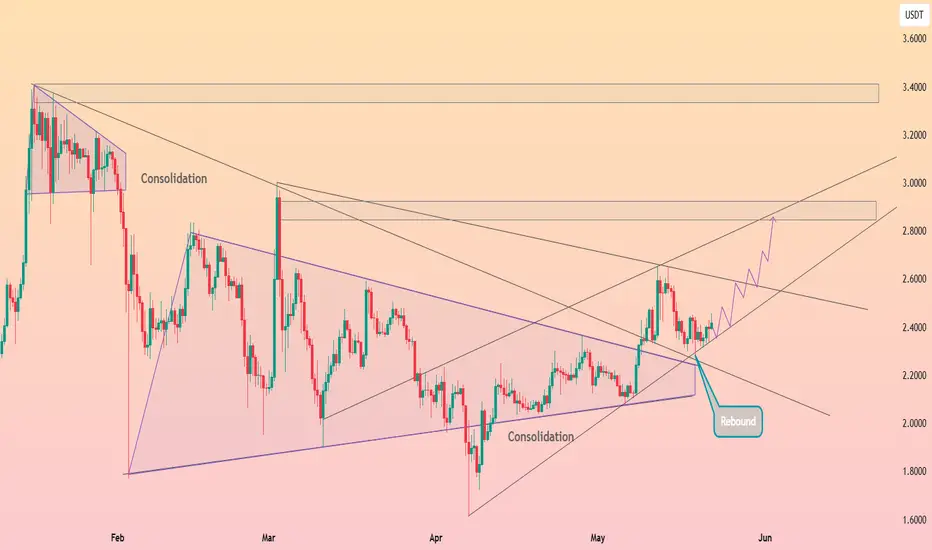
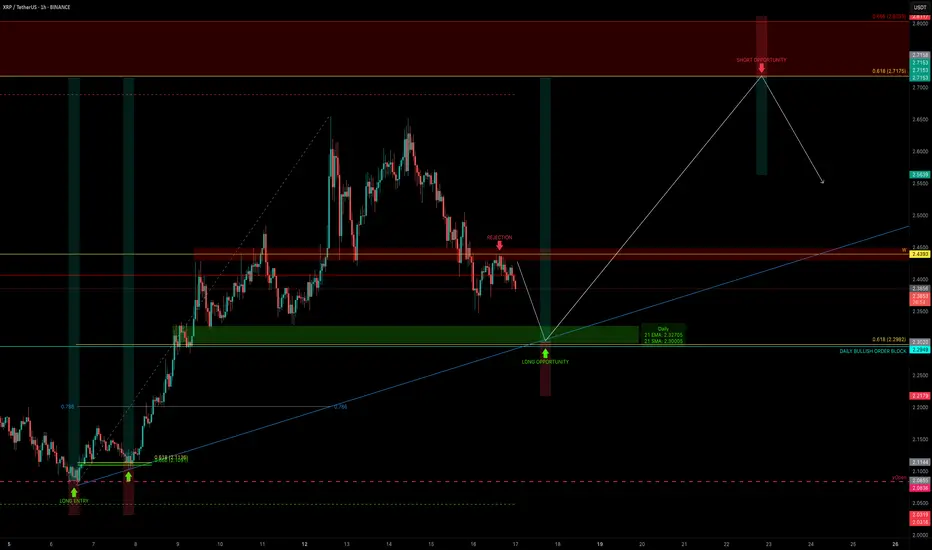
XRP Correction Complete? — Long Setup Aligned with Fib & OBXRP has completed a 5-wave impulse move. As expected, XRP is now in a corrective phase, pulling back after rejecting from a key resistance — and it’s doing so with technical precision.
The question now: where is the next high-probability long setup? Let’s break it down.
🧠 Market Structure & Key Zones
Using Fibonacci retracement from the base of the 5-wave impulse, we now have a potential golden pocket target aligned with major confluence.
🔽 Support Zone
🔹 0.618 Fib retracement: $2.2982
🔹 Daily Bullish Order Block: $2.2949
🔹 Daily 21 EMA: $2.329
🔹 Daily 21 SMA: $2.301
🔹 Liquidity pool
🔹 0.786 Fib Speed Fan (only if price drops between May 17–18)
This creates a high-confluence support cluster at ~$2.3 — a prime candidate for a long re-entry.
🟢 Long Trade Setup
Entry: Ladder between $2.32 and $2.28
Stop-loss: ~$2.21
Target: $2.7175 (0.618 Fib retracement of the corrective downtrend)
R:R: ~5:1
🔴 Short Setup (Conditional)
Trigger: Rejection at $2.7175
Entry: ~$2.7175
Stop-loss: Above $2.8033 (0.666 Fib) → set at ~$2.811
Take Profit: ~$2.56 or lower
R:R: ~2:1+ (dependent on entry confirmation and PA behaviour)
Shorts only valid if a clear rejection or SFP pattern emerges. If momentum is strong, this level may break — so wait for structure to confirm.
📘 Educational Insight: Why Confluence Matters
Too often, traders chase single-indicator signals. But real edge comes from confluence — when multiple tools (Fibs, MAs, Order Blocks, Liquidity, VWAPs, FVG, Speed Fans etc.) agree on the same zone. This alignment not only increases confidence in your entry, but also sharpens your risk management.
Think of it as building a case — the more aligned evidence you have, the stronger your trade thesis becomes.
📌 Summary
XRP is in a corrective phase after a 5-wave impulse
Clean rejection from weekly resistance → continuation of bearish trend
Long zone: ~$2.3
SL: ~$2.21 | TP: $2.7175 | R:R ~5:1
Optional short: $2.7175 rejection → SL $2.811 | TP $2.56
Precision isn’t about predicting — it’s about being ready when the chart speaks with clarity. Patience makes probability powerful.
___________________________________
If you found this helpful, leave a like and comment below! Got requests for the next technical analysis? Let me know.
XRP (Ripple) is at a Critical Supply Zone: Will it Fall or Rise?FenzoFx—Ripple (XRP) is testing the resistance level, which expands from $2.40 to $2.46, with the Stochastic Oscillator hinting at an overbought market.
A new bearish wave could emerge if the resistance holds. In this scenario, the price could dip toward the 50.0% Fibonacci retracement level at $2.37, backed by the 50-SMA.
The bearish outlook should be invalidated if XRP/USD exceeds and stabilizes above $2.46.
Trade XRP/USD with low spread, no commission and no swap at FenzoFx.
Crypto update for 2025.05.22Bitcoin hits a new all-time high, but others are lagging. What's the deal?
Let's dig in...
CRYPTO:BTCUSD
CRYPTO:BCHUSD
CRYPTO:ETHUSD
CRYPTO:XRPUSD
CRYPTO:LTCUSD
CRYPTO:DOGEUSD
CRYPTO:DOTUSD
CRYPTO:TRXUSD
Let us know what you think in the comments below.
Thank you.
77.3% of retail investor accounts lose money when trading CFDs with this provider. You should consider whether you understand how CFDs work and whether you can afford to take the high risk of losing your money. Past performance is not necessarily indicative of future results. The value of investments may fall as well as rise and the investor may not get back the amount initially invested. This content is not intended for nor applicable to residents of the UK. Cryptocurrency CFDs and spread bets are restricted in the UK for all retail clients.

XRPUSD Bull Flag broken. Can it go x10 from here?XRPUSD has broken above its Bull Flag, which has been the corrective pattern of the Trade War since January's High.
At the same time a 1day Golden Cross is being formed and if we get the same rally that was followed after the recent U.S. elections, the price may hit the 2.0 Fibonacci extension.
This represents a bold x10 move from here with a $23 target. Do you think that's plausible for this Cycle?
Follow us, like the idea and leave a comment below!!

HolderStat┆XRPUSD guarding the breakout lineCRYPTOCAP:XRP rocketed from a triangle breakout to 2.6 USDT, then retraced to the 2.30-2.35 confluence of breakout trendline and rising support. Higher-low structure is alive: maintain it and the measured path opens toward the 2.85-3.00 resistance band. A decisive candle under 2.25 would neutralise near-term upside. 📈

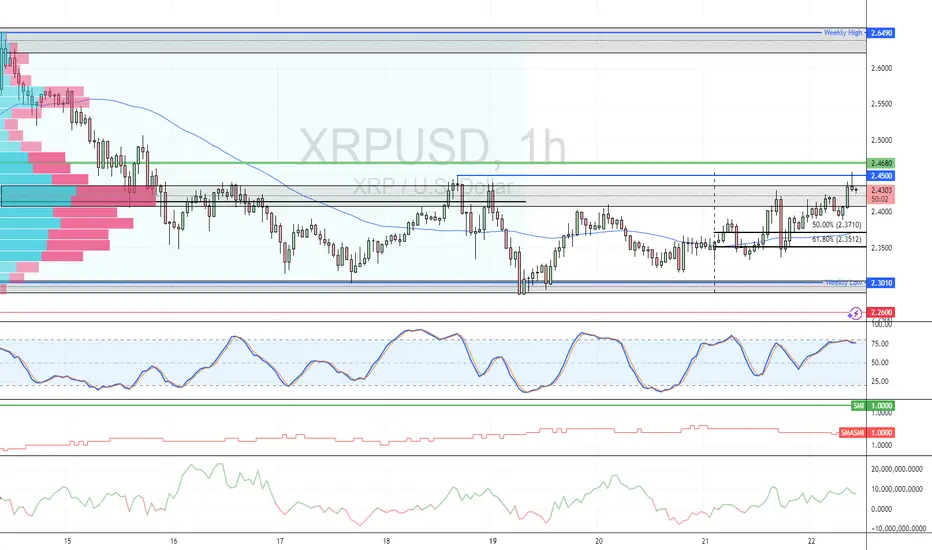
Potential Surge Ahead for Ripple?XRP is currently trading around 2.3300 and showing signs of a recent breakout from a descending wedge pattern (a classic bullish reversal signal). This move is backed by a bullish divergence on the Stochastic RSI, hinting at building upward momentum. However, the RSI is nearing overbought levels, suggesting a potential short-term pullback might be on the horizon before any sustained rally.
Technical Analysis:
Key support levels to monitor are 2.2800 and 2.2500, both of which have acted as reliable floors in the past. On the upside, resistance sits at 2.4000 and 2.4500 (levels XRP will need to conquer to confirm the bullish trend). The 50-period moving average is currently below the price, reinforcing the bullish bias, but traders should watch for a possible correction if the price struggles to break through the resistance zone.
Market Sentiment and News:
The market sentiment around XRP is cautiously optimistic. Despite $170M in net market selling over the past week, XRP has climbed 11%, pointing to strong accumulation by passive buyers. The recent launch of XRP-based futures by CME Group adds a layer of credibility, potentially drawing institutional interest. That said, the ongoing SEC lawsuit continues to linger as a concern for some investors, possibly tempering enthusiasm.
Looking ahead, XRP could push higher if it clears the 2.4000 resistance, with potential targets at 2.5000 and 2.6000 in the short term. However, if the price fails to stay above 2.3300, a dip toward the 2.2800 support could unfold. Traders should keep a close eye on price action for confirmation of either scenario.
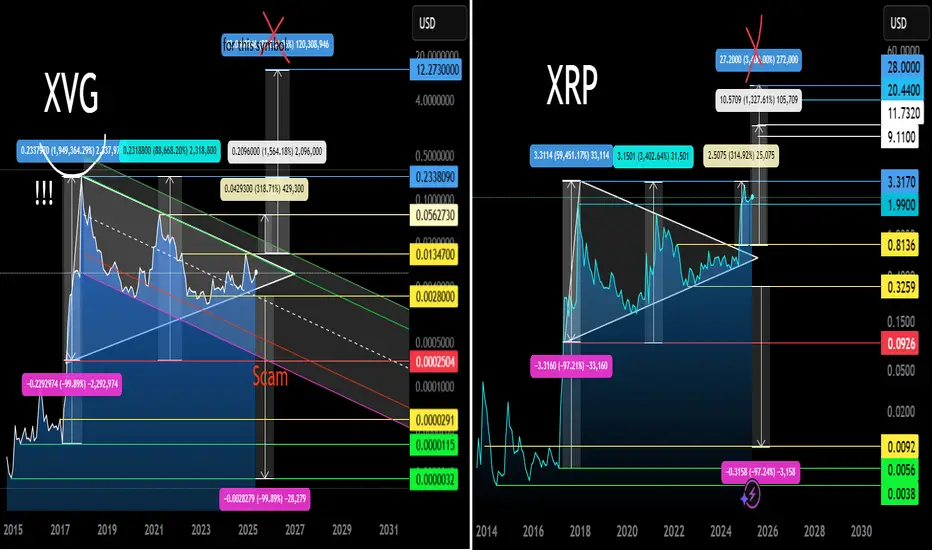
XRP vs XVG 8 Year Triangle Fractal Comparison 05 2025Logarithm. Time frame 1 month. Linear chart for clarity. Two cryptocurrencies of the super hype of altcoins in 2017 (the final alt season of the cycle before last). XRP is ahead of XVG. The structures are similar, but if XVG breaks through the triangle upwards like on XRP, then work with the first target, observing risk management. You can leave 5-10% of the position for the second target, but this is not necessary. As for XRP, everything is as before... local update in the XRP idea.
XVG Secondary trend (part) Resolution of the triangle 8 years 05 2025
XRP/USD Main trend 28 07 2022
Binance Blinked! High level of USDC volume across Binance..Binance has for many years tried their own versions of buying US debt with USD made from selling a stablecoin of their own. This has been squashed nearly every time and has most likely hindered the flow on binance itself.
It seems binance may have blinked. USDC has been flooding into Binance this year maintaining often very high levels of relative volume. This flow is overall better than if neither party capitulated. Must be careful of different streams of volume fragmenting both bullish and bearish data. While USDT is seeing all time highs its market share is falling with the wider adoption of stablecoins on chain and in traditional finance.
All this is occuring as stablecoin regulation is being passed in the US tradingview.sweetlogin.com and Dimon says NYSE:JPM will be buying COINBASE:BTCUSD for clients soon

Xrp - Prepare for at least a +50% move!Xrp - CRYPTO:XRPUSD - will head much higher:
(click chart above to see the in depth analysis👆🏻)
Xrp has perfectly been respecting market structure lately and despite the significant volatility, the overall crypto market remains bullish. Especially Xrp is about to perform a bullish break and retest, which - if confirmed by bullish confirmation - could lead to a rally of about +50%.
Levels to watch: $3.0
Keep your long term vision!
Philip (BasicTrading)

Ripple is Nearing The Daily TrendHey Traders, in today's trading session we are monitoring XRPUSDT for a buying opportunity around 2.28 zone, Ripple is trading in an uptrend and currently is in a correction phase in which it is approaching the trend at 2.28 support and resistance area.
Trade safe, Joe.
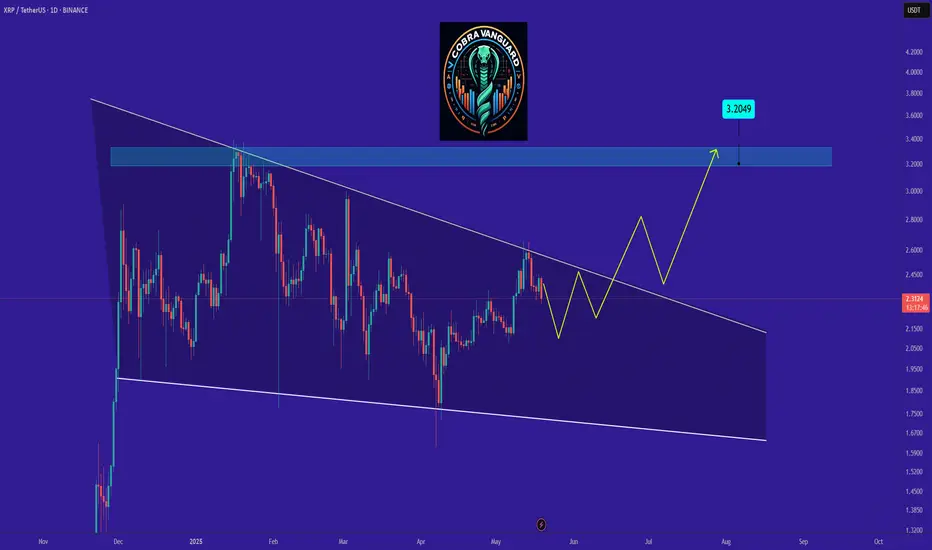
XRP's situation+ Target PredictionThe XRP is in a Bullish phase by a Falling Wedge Pattern.
A falling wedge indicates the potential for price to reach to $3.
Note if the Wedge Pattern is broken downwards with the strength of Bearish candles , this analysis of ours will be failed.
Give me some energy !!
✨We spend hours finding potential opportunities and writing useful ideas, we would be happy if you support us.
Best regards CobraVanguard.💚
_ _ _ _ __ _ _ _ _ _ _ _ _ _ _ _ _ _ _ _ _ _ _ _ _ _ _ _ _ _ _ _
✅Thank you, and for more ideas, hit ❤️Like❤️ and 🌟Follow🌟!
⚠️Things can change...
The markets are always changing and even with all these signals, the market changes tend to be strong and fast!!
HolderStat┆XRPUSD textbook triangle retest fuels 2.9-3.0 aimCRYPTOCAP:XRP pierced a five-month symmetrical triangle and instantly wicked back to retest the breakout line near 2.20 USDT, leaving a long tail labelled “retest.” The rebound has carved a series of higher lows, indicating accumulation above trend support. As long as 2.20 holds, the measured move projects toward the 2.85-3.00 resistance band drawn by February’s highs. Closing beneath the retest level would neutralise the immediate upside bias but broader ascending guides remain constructive.
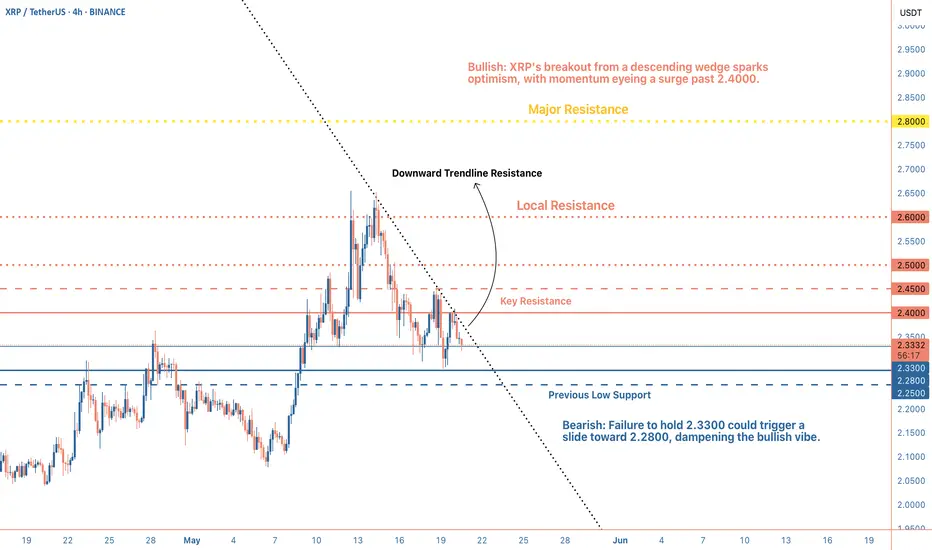
Ripple (XRP) Could Rally If Support HoldsFenzoFx—Ripple (XRP) has extended its downtrend from 2.650 to the key support at 2.30. XRP is currently trading slightly above this level.
The smart money index reads 1.28, matching prior lows where price previously bounced.
Support remains at 2.26. As long as XRP stays above this, a move toward the 2.44 resistance is likely.
Bearish Scenario: A drop below 2.26 would invalidate the bullish outlook, potentially opening the path to 2.06.
XRP at $7 in 50 days!Like the rest of the market XRP has been stalling a bit for the last few days.
The coming 50 days will give us several new ATHs, though.
For this scenario to play out, we need a strong break out from $2.57 and a strong support from $2.60.
Look at the chart and find the minor pullbacks going up to around $7 !
God speed to all of you !

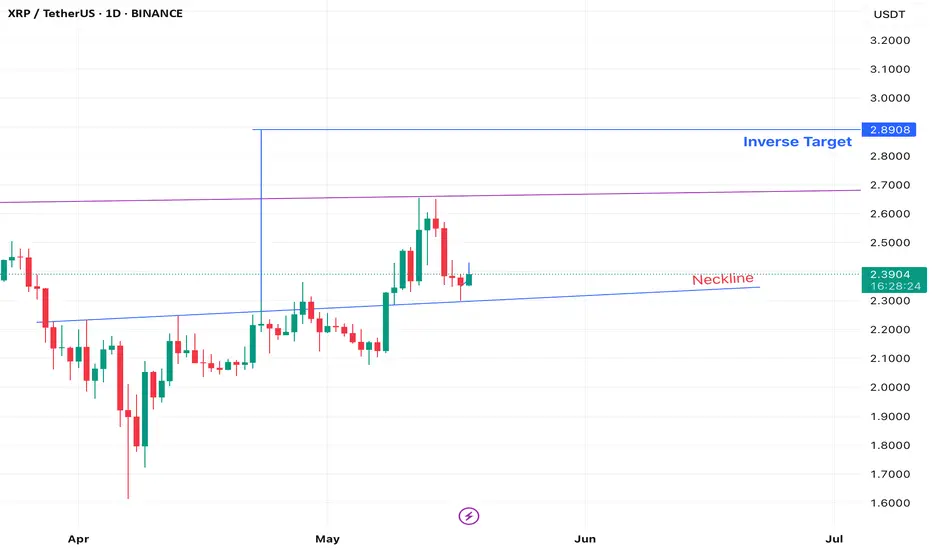
XRP Inverse Head And Shoulders $2.89 TargetWe've had this sitting here for awhile, but we just confirmed a strong perfect bounce off the neckline signaling another attempt to break through the strong resistance above around $2.50 to get to our $2.89 Target
#XRP #XRPUSD #XRPUSDT #Ripple #Analysis #Eddy#XRP #XRPUSD #XRPUSDT #Ripple #Analysis #Eddy
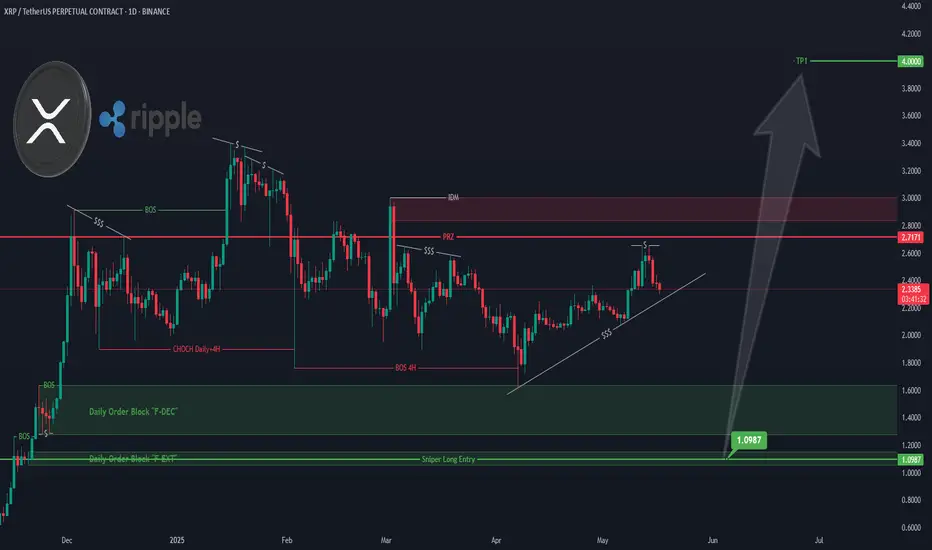
I have identified the important supply and demand zones of the higher timeframe for you.
This analysis is based on a combination of different styles, including the volume style with the ict style.
Based on your strategy and style, get the necessary confirmations for this analysis to enter the trade.
Don't forget about risk and capital management.
The responsibility for the transaction is yours and I have no responsibility for your failure to comply with your risk and capital management.
💬 Note: Important liquidity is marked on the chart. Be careful of liquidity hunting. In my opinion, the important entry point for buying spot and long futures is at 1.0987$, and it will most likely be a sniper entry. The first target from the specified point will be $4 and the second target will be $10.
Be successful and profitable.
XRP Failed Advance?The corrections are red yes?
An advance is green.
Consolidation is blue. In this case we have bullish consolidation.
Is this a failed advance?
No. So far the chart is saying that current price action is simply an extension of the consolidation phase. That is, XRPUSDT continues with a bullish consolidation. Sideways while growing slowly.
Four days red and no major retrace. Four days red is literally the maximum since August 2024.
This is an interesting signal. Since August 2024, XRPUSDT has never closed more than four consecutive days red. We can interpret this signal in several ways.
A red close today would lead to a green day tomorrow.
Today can produce any type of move, can be lower but as soon as the candle closes we can expect a green day next. That is because the market continues to fluctuates and it never stays the same for too long.
The green day doesn't have to be a big green candle but it can be the continuation of the slow bullish consolidation. The good news is that bullish consolidation will lead to a strong bullish advance at some point. The bad news is that it tends to become boring to wait. Prices are not growing super fast but it is growing and this is were most people make mistakes.
Beginners want to see 100% growth daily or else nothing is happening but that is not the case. XRPUSDT has been growing since 7-April and look at this, more than 60% growth in a month. With a good entry at the low this can translate into huge profits and that's how it goes. It can grow slowly but surely for months and then boom, out of nowhere a sudden jump. But still, it is growing daily and that's what is most important if you are holding this coin.
It will keep on growing and that's an easy call.
Namaste.

XRPUSDT: The Sleeping Whale Stirs!
📊 Key Stats (May 10, 2025)
- Price: $2.4177 (+1.59%)
- Volume: $53.57M (Whale activity detected!)
- Key Levels:
- Entry Zone: $2.32 - $2.34
- Take Profit: $2.60 (immediate), $3.40 (swing)
- Stop Loss: Below $2.15 (risky) or $2.00 (conservative)
🔥 Technical Breakdown
1. Bullish Structure: Higher lows since $1.61 bottom
2. Volume Spike: $53M suggests institutional interest
3. Breakout Potential: Testing descending trendline
💎 3 Reasons This Trade Works
1. Regulatory Clarity: SEC case resolved = institutional FOMO
2. Payment Adoption: Ripple partnerships expanding in 2025
3. Technical Setup: Bull flag forming on daily chart
🎯 Trading Plan
- Aggressive Entry: $2.38 (current)
- Ideal Entry: $2.20 retest
- Targets:
→ $2.50 (4% gain)
→ $3.00 (25% gain)
→ $3.40 (42% gain)
⚠️ Risk Warning
XRP remains volatile - manage position size carefully. The $2.00 level is critical support.
📈 Why This Matters Now
With the 2025 bull market accelerating, XRP is one of the few major alts still below its 2021 ATH ($3.40). This could be the last chance to buy under $2.50.
👍 Like/Follow for more high-probability setups!
#XRP #Ripple #AltSeason2025
Not financial advice - always do your own research. - DYOR
XRP is so BACK!Hello TradingView Family / Fellow Traders. This is Richard, also known as theSignalyst.
As per our last XRP idea, attached on the chart, it rejected the lower green structure and surged by over 25%.
📈XRP is now bullish long-term trading within the rising channel marked in blue.
Moreover, the upper green zone is a strong structure!
🏹 Thus, the highlighted blue circle is a strong area to look for buy setups as it is the intersection of structure and lower blue trendline acting as a non-horizontal support.
📚 As per my trading style:
As #XRP retests the blue circle zone, I will be looking for bullish reversal setups (like a double bottom pattern, trendline break , and so on...)
📚 Always follow your trading plan regarding entry, risk management, and trade management.
Good luck!
All Strategies Are Good; If Managed Properly!
~Rich
