XRP DAILY CHART ANALYSISXRP DAILY CHART ANALYSIS 📈
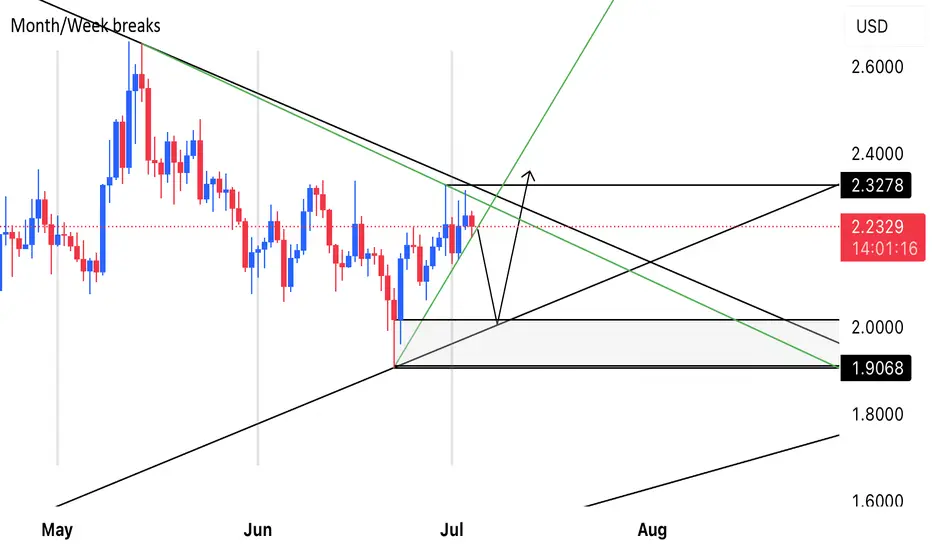
🟩Green lines are “inside trendline” having last interactions with price.
Price did a third touch on the bearish inside trend line yesterday 3rd July @ 2.3157
And current interaction with the bullish “inside trendline” today.
Fundamentally, expect short term USD strength with positive US data as catalyst from yesterday’s release.
Market could extend to closest support @2.1714
If bullish “inside trendline” is broken, we expect support and outer trendline (Black) third touch @2.0181.
If there’s a strong bullish signal convicted to positive XRP or Crypto fundamentals, we expect a bullish move back to at least 2.4
Short term - Bearish 🟥
Medium to long term - Bullish 🟩
Xrpdaily
XRP DAILY ANALYSIS!!- The market moves in 3 directions: UP, DOWN OR SIDEWAYS!
- We can get either this is crypto one of the most volatile asset classes out there, so if you trade crypto, trade with caution!

It is the time Ripple: XRPUSDT LongIt's been a while we're all waiting for #Ripple #xrp.
Now the daily chart is quite beautiful;
Strong S/R levels showed up,
A symmetrical triangle formed,
200 and 100 sma act as strong supports,
A powerful descending trend line which needs to be clear.
Hint: the #xrpbtc chart is at a strong support as well.
#Bitcoin pumps and dumps can destroy any analysis, but to be honest, when I look at this chart, I do not care about whatever #btc might do.
Targets can be higher if market was in a good mood. These are what we can talk about for now.
This is a daily chart, I do not tell you where to enter; check out 4h timeframe and find the best point by yourself.
Manage your risk.
Obviously, a stop-loss should be considered below the symmetrical triangle and support area.
Good luck,
Median Eagle.

What's UP XRP ? Quick 4 min update on W & DHi everyone,
Thank you for watching this video - hope you like it and share your thoughts and comment below :)
Kind regards,
Noel
