XRP Shorterm SELLOn higher timeframes - Weekly and Daily, $XRP just broke above a historical resistance and we expect a retest. Clearly, there's an exhaustion from the upside as shown by the ascending channel on the 30 minutes time frame. A break below is feasible before it flies to our first target, $2.
We go short to $1.4 before we fly to Elon Mars.
Let me know your thoughts?
Xrpshort

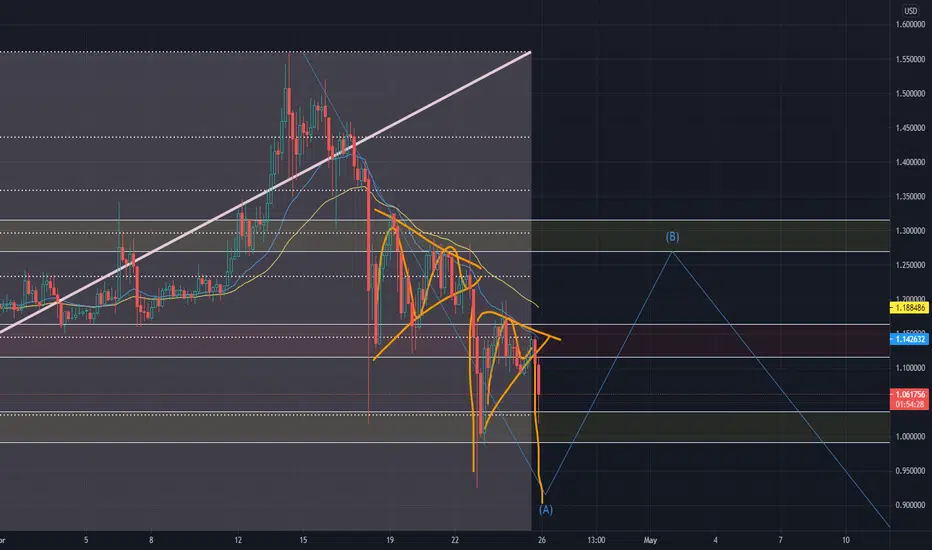
XRP 4H - ABC Correction WaveHi everyone,
Correction wave is playing out and seems Wave A went deeper then expected since we broke out the triangle - you could say bear flag depending on how you look :)
After that retrace to previous resistance, that will be Wave B, It's to be seen how high it retraces but it shouldn't overtake Wave A.
After that an even deeper pull back towards 70 cent zone thus retesting the Weekly support zone before heading on the the bigger Wave 3.
Similar to most markets and they go up and down, nothing unusual!
Elliot Wave Theory is a theory so not all price points should be taken as a fact, but it does gives us a clear picture of what might happen.
Kind regards,
Noel

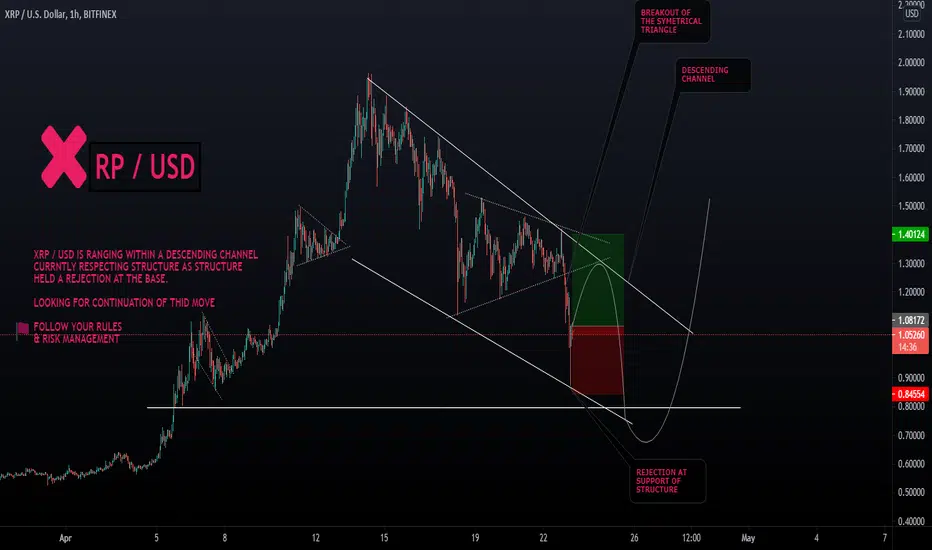
XRPUSD 1.05160 - 9.31 % LONG IDEA * PRICE ACTION AND STRUCTUREHELLO EVERYONE
HOPE EVERYONE IS DOING GOOD HAVING A GOOD ONE IN THE MARKET THIS WEEK, HERE'S A LOOK AT THEXRP / USD.
* follow your entry rules on entries
* significant moves with the bears change the plan.
lets see how it goes.
many stars must align with the plan before executing the trade, kindly follow your rules.
HAPPY TRADING EVERYONE & LET YOUR WINS RUN...
_________________________________________________________________________________________________________________________
ENTRY & SL - FOLLOW YOUR RULES
RISK-MANAGEMENT
PERIOD - SWING TRADE
__________________________________________________________________________________________________________________________
If this idea helps with your trading plan kindly leave a like definitely appreciate it.
XRP Short Looks like .70 is very possible in this chart. Not sure of the 200 day will be broken but if it does. .70 cents target.

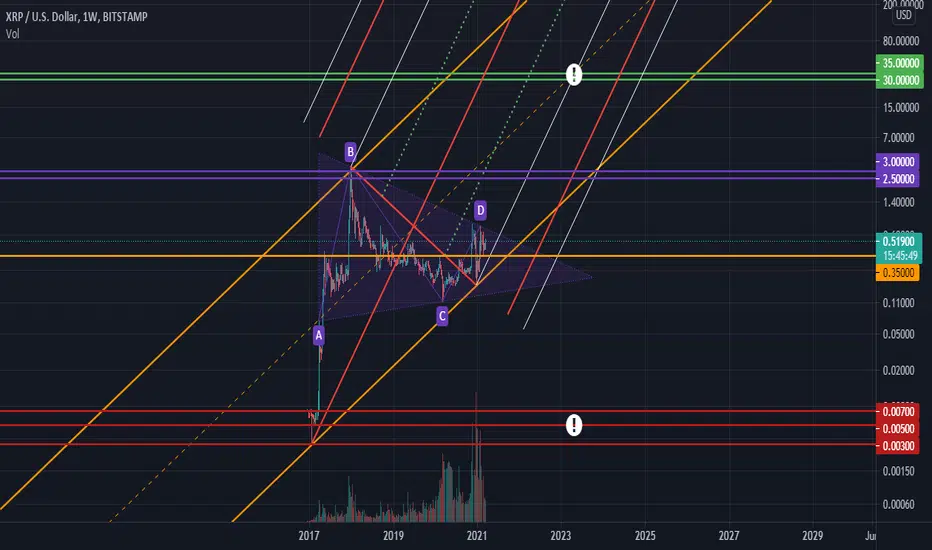
XRP short to $0.9Quick analysis on XRP using both wave theory, Fibonacci analysis :
Wave theory Analysis:
1) XRP had a nice IMPULSE run-up from Apr 4th to Apr 13th going from $0.58 to $1.96 as shown in my 5 point wave in the diagram above
2) After a good impulse phase comes the CORRECTION phase, markets usually stay two-thirds of the time in a correction phase
3) Looks like the correction is a ZIG-ZAG correction look at my wave A-B-C where Wave A touched FIB 61.8% and Wave B is a symmetrical triangle with a nice (3-3-3-3-3) pattern
4) I believe the next one is corrective wave C which has just started and it's is going to come down to FIB 78.6% i.e. $0.9 where the support is tested again to see if it moves up in the next impulse leg up or go down - so watch out for this support line at $0.9
Summary :
-------------
1) Looks like the bears are still in control
2) It's in the final leg of corrective Wave C
3) The support line $0.9 needs to be tested one more time and see which way the market is going to trend
Happy trading, feedback is always appreciated

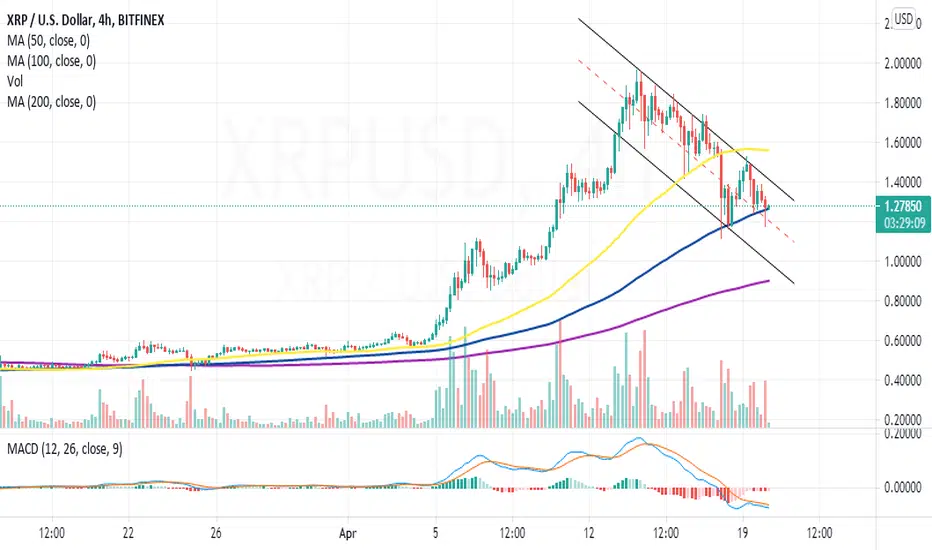
Ripple price falls fast toward $1 as cryptocurrencies bleed
Ripple has continued to lose ground from April highs around $1.95 toward $1.
Breaking under the descending channel’s middle boundary’s support could trigger massive losses toward $0.9.
Ripple was one of the best-performing cryptocurrencies in the first two weeks of April. The cross-border token made giant slides not seen since the breakdown in December when the United States Securities and Exchange Commission (SEC) filed a lawsuit against Ripple Labs and its top executives for selling unregistered tokens to raise funds.
Ripple revisits key support areas
Ripple suffered a rejection near $2 last week. However, support at $1.6 ensured that the bearish advances were checked while market stability protected. However, volatility swept across the market on Sunday, leaving most investors wrecked.
Bitcoin dropped close to $50,000 from highs above $60,000 while Ethereum extended the bearish leg to $2,000. The international remittance token hit lows around $1.12 before a reflex recovery pulled XRP slightly above $1.5.
Nonetheless, the entire cryptocurrency market has continued to suffer under the aggressive bears’ hands. Ripple is back to seeking support at $1.2 while holding firmly to the descending channel’s middle boundary support. The 100 Simple Moving Average (SMA) is also in line to prove the much-needed refuge, in turn, averting potential losses toward $1.
The Moving Average Convergence Divergence (MACD) indicator affirms that the slightest resistance path is downward. This indicator tracks the asset’s trend and measures its momentum. The MACD line (blue) is stuck under the signal line, adding credence to the bearish outlook.
Ripple intraday levels
Spot rate: $1.28
Trend: Bearish
Volatility: Low
Support: 1.2 and the 100 SMA
Resistance: $1.4 and the 50 SMA
IS XRP DONE FALLING?I´ve been looking a lot at XRP these days and I have been trying to figure out if it is time to fill or empty the bags!
Looking at the current formation and price action, it is really not tempting.
The price is currently below the SMMA 200 on the 30 min, which indicates a bearish trend.
Furthermore, the price is clearly forming a bearish cup & handle, as well as collecting momentum on the RSI.
I would not look to short the coin nor buy in this current market, we need to see how this plays out.
Be well and beware of the risk in this market,
Best regards,
Widtrade


XRPUSDT FUTURES 15mIt has the ability to make a good profit.
With long, as well as short.
Take it under supervision.
Wish you all the best...


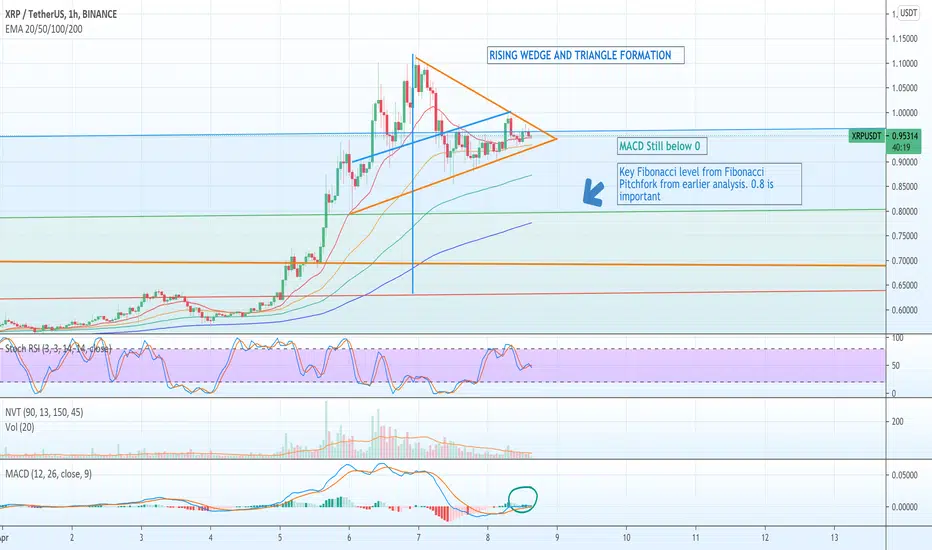
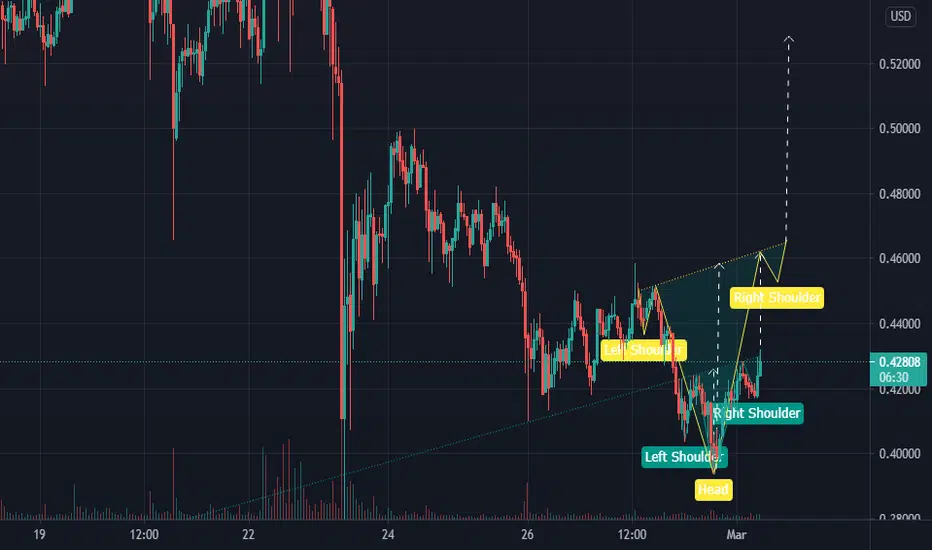
Rising Wedge and Triangle Formation. KEY LEVELS!Many has mentioned a breakout to higher targets, Yes there is a huge triangle on the 1 hour chart, but there is also a "hidden" wedge present.
We are most probably going to get a retracement to the levels showed in the chart.
Remember, already in 2018 the Sweedish Central Bank had moved liquidity worth over a 1B SEK via Ripple.
You really think they do not know what they are using?
Have a great day, and good luck :)
If you want to educated yourself : www.youtube.com
XRP short term bearish I think BTC is about to go down, so there is a high chance XRP will retest the lower trend line of the triangle in the coming week and then bounce off
------
This is not a financial advice .
#DYOR
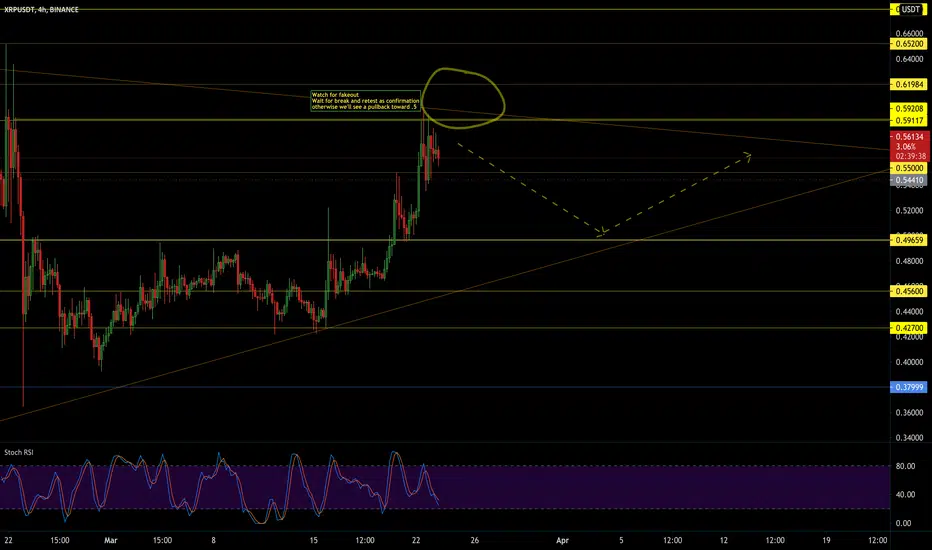
$XRP Possible Pullback | Watch for fakeoutXRP is popping off after hearing Ripple could beat the case with SEC. Considering how volatile the crypto markets have been, this news might be enough to pop XRP off to the next level (with time).
In the short-term, we will see one of two things...
We could see a light fakeout around $.59-$.6 before seeing a strong pullback to $.5 then a run back up
or
A breakout and retest of $.6 will lead us to our next target of $.62 & $.65
Considering the volatility and huge news for XRP, do you think XRP can push to higher levels or will it fall off?
DCJ

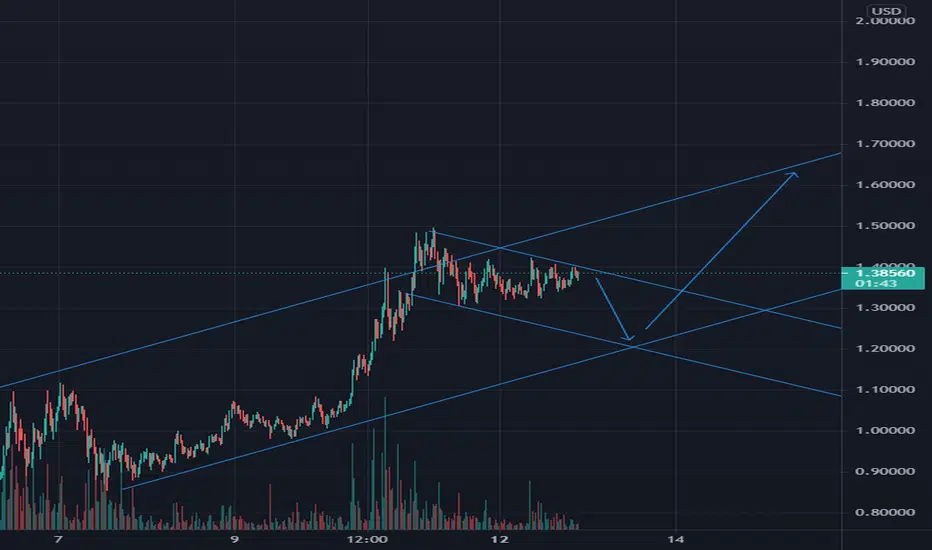
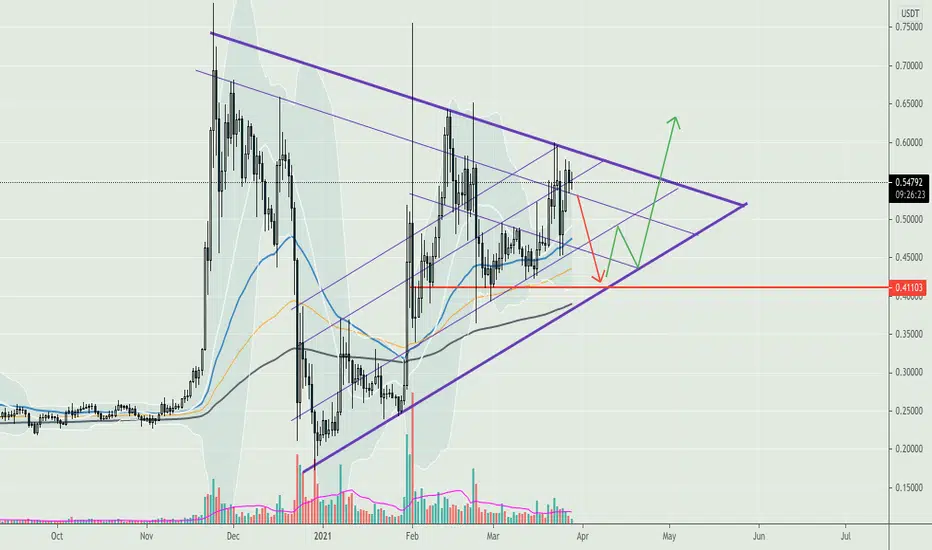
XRP/USDTHi again .
The chart has a triangular pattern that is not stable at the moment but still gives us positive and negative dream targets.!!!
I'm waiting for the pattern to break, but the positive target seems more reasonable.
Write me what you think in the comments.
XRP/USDT - Possible Bearish BreakoutHello traders and community, today we will tell ourselves shortly about the situation of XRP/USDT
Trend analysis
- As you can see from the XRP/USDT daily chart, right now we are still moving in bullish ascending triangle (white zone on the chart), but unforunately the price of Ripple started creating bearish breakout for testing new lower prices. That's why as a trader, I recommend to wait for correct signal before opening buy or sell position on this pair. If the price of XRP drops lower than 0,435 price level then we can expect beginning of bearish trend and the price will continue to drop up to 0,37 price level (white line on the chart). As another alternative scenario price of Ripple continue to rise up to 0,56 price level. Resistance level is on 0,5 pricel level, support zone near 0,417 pricel level and global trend stays bullish (but can change if the price drops).
Chart pattern
- Bullish ascending triangle (processing)
- Bearish breakout (processing)
Technical indicators
- RSI: market is still in boarders and is located near 50 level (not overheated, Neutral signal)
- MACD: MAs are prepared for downward movement + they get closer to each other (Bearish signal)
- BB: Volatility of the market started stabilizing after volatile movement accomplished (Bearish signal in this case)
- MA (10,20): MA10 is going upward to the level of MA20 (Bull signal)
= Overall bearish signal movement
Dear friends, please push the like button, write comments below, follow me for more technical analysis and share this post with other traders - that would be the best support, Thank you for your attention!
Tell us about your opinion for making better decisions :)
P.S.: Information provided is only educational and should not be used to take action in the market.

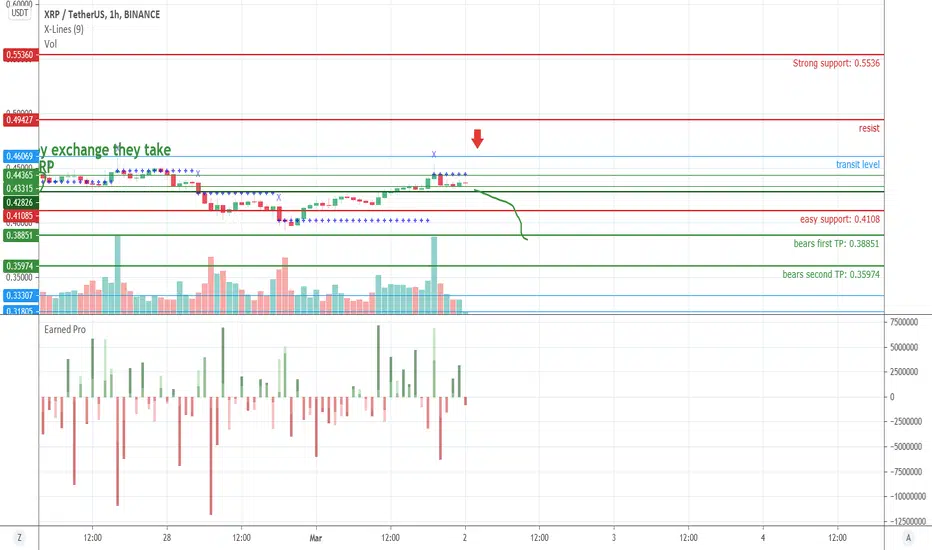
XRPUSDT, short again. Target still 0.39Hi friends. Its our second attempt going to 0.39. Big solds continue and we will fall with bitcoin. Target for ripple still 0.39. Follow me.

XRP: It's All Up To BTC NOWGood day to all money makers!
If you find my charts useful please consider a follow and a thumbs-up as it motivates me to share and grow with you!
- Current price movement is heavily dependant on what BTC does next.
- This is just my current idea.
- I am not a financial advisor!
- There is always a huge chance of different patterns taking shape in these ever-changing charts.
- I can be 1000% wrong!
- Trade responsibly.
- Be focused.
- Have a plan.
- Stick to the plan.
- No FOMO.
- Take the time to study YOUR own charts and come up with your own ideas as you are going to trade with your money.
- Never trade what you are not willing to lose
- Remember Stop-loss is your friend.
- Smile!
- Good Trading and Good Luck
If you Find my Charts useful please consider a follow and a thumbs-up as it motivates me to share and grow with you!
