XRP/USD- Accumulation or Crashing Pattern?Hi Guys,
Thank you for tuning into my analysis.
BITFINEX:XRPUSD
As you can see on the larger time frame, BITFINEX:XRPUSD is mimicking the trend of BTC/USD. However, a more significant lower high and lower low can be spotted in BITFINEX:XRPUSD then in BTC.
The green box could signify an accumulation zone provided that BITFINEX:XRPUSD doesn't break down the $0.55 region. Notice that the $0.55 also constitute my 88% fib level. This shows that the $0.55 level is a significant strong support.
A false break down of the $0.55 could eventually occur but the bulls must manage to bring the price back to $0.55. Otherwise, $0.33 will be met.
I suggest downward cost averaging would be the best idea for this coin. Expect to hold until end of 2018.
Thanks.
CK
Xrpshort

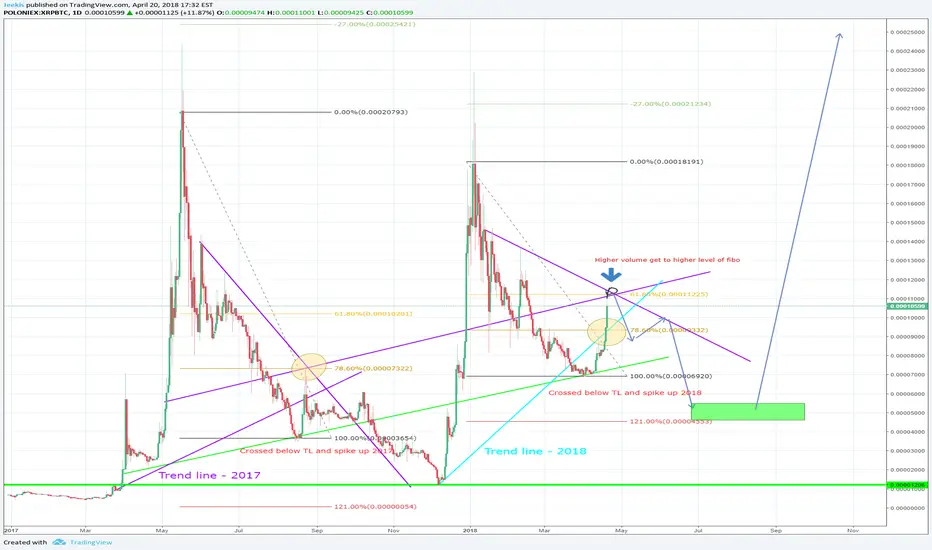
Did i just figured out the plan of Whales??? XRP Brutal DUMP!Trend line created and crossed down in 2017. Same happening right now! We spiked right through.
Just look at the Similarity of 2017 and 2018. I think this is really not coincidence.

XRP, double top? Read to all!Often I notice that altkoins work more technically and ahead of schedule. XRP showed signals for a breakdown of resistance and entry into the zone of imbalance above 0.70, but the market leader began to move down.
XRP draws a classic figure: a double top, but it is not yet formed, we are in the decision zone and everything depends on the BTC. But I completely closed my position and look forward to a new opportunity to enter the market.
We see a bearish divergence of OPEN INTEREST
RSI showed a divergence to a short position and a divergence on a larger timeframe for the purchase, but more I trust the OPEN INTEREST, the better the support of the RSI became resistance
Volumes are falling
We are in the decision-making zone for BTC and XRP, and throughout the market as a whole, but it's worth noting that altcoins are moving the market more technically, due to smaller volumes
The review will be continually supplemented, follow the news and put it live)
OPEN INTEREST v2 is already available, write to private messages
All Profits of FVB TEAM

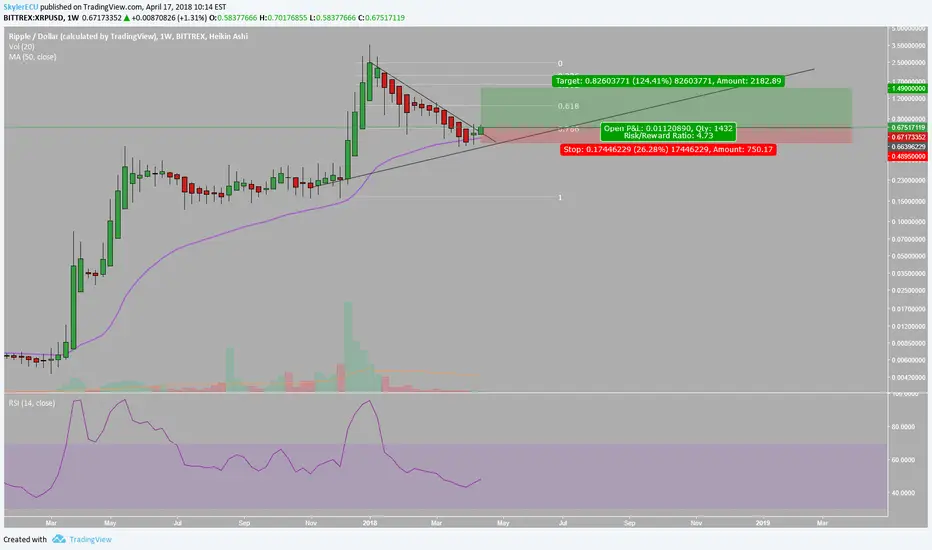
Ripple XRP Ripple weekly chart is looking good. Price has bounced of 50 MA. Looking to enter long position in this area.
Entry .67
Stop .49
Target 1 .99
Target 2 1.49
This is not financial advice.
Comments, criticism, questions always appreciated.
Cheers!

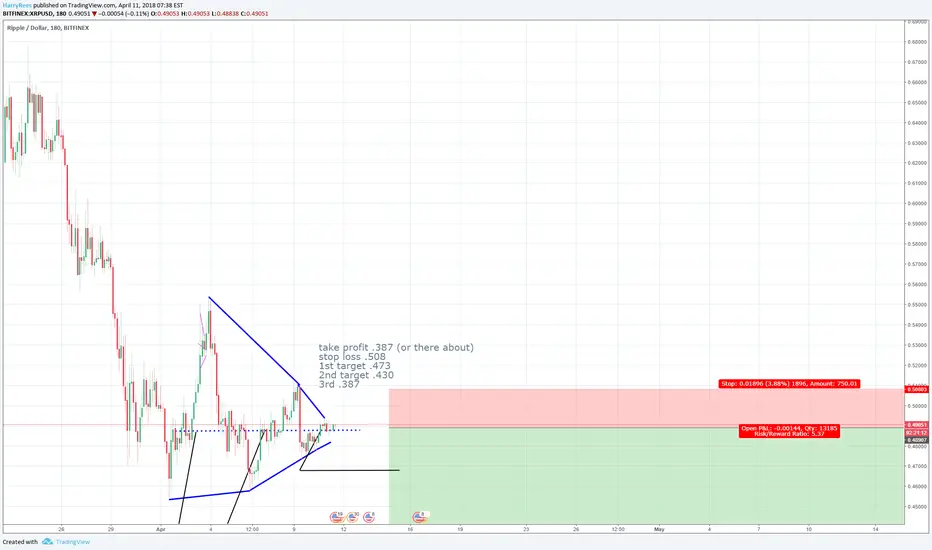
XRPUSD - Downside Continuation - HVFXRPUSD - Downside Continuation - Hunt Volatility Funnel
New trader. Welcome advice / criticisms
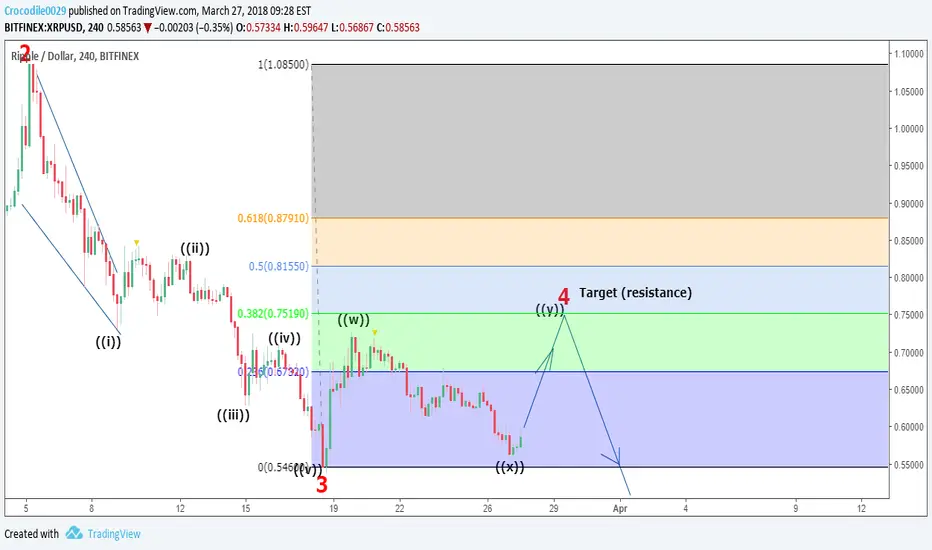
XRPUSD (Ripple) 4hr tf analysisPrice swing from ~$1.08 (March 5,2018) to ~$0.55 on March 18, 2018 has been identified in this analysis as a minor wave 3. Minute wave ((y)) is currently on and its termination marks the end of minor wave 4.
Minor wave 4 is shaping up so far as a zigzag (5-3-5) Elliott wave structure.A 38.2% retracement to 50% retracement
(i.e. ~$0.75 and ~$0.82 respectively) of minor wave 3 is expected to offer resistance and terminate minor wave 4. Projections for minute wave ((y)) include 100% wave ((w)), and 161.8% wave ((w)). These termination points are $0.73 and $0.83 respectively, and therefore increase the chances of XRPUSD terminating between 38.2% retracement to 50% retracement.
P.S. The use of "price swing" is used to indicate the direction of the trend (i.e. bearish in this case). Price swing is not imply an actionary or reactionary wave.
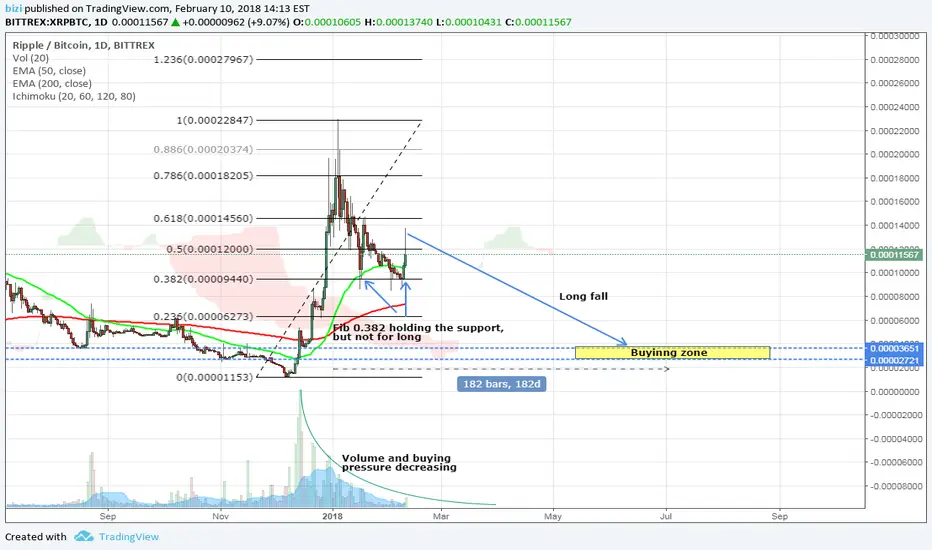
Ripple ,the new king is back XRR/BTC (just kidding)Ripple is showing simmilair fractal pattern as it did 8 months ago. People are buying the hype because they think it has potential to grow more than 10-20x eventhough that would put it way above Bitcoin total market capitalization.
I used to be the same and I used to have huge position in XRP hoping it will jump very hard eventhough it was just as unrealistic then as it is now. Back then I didn't understand bull / bear cycles and it was hard for me to say that the coin is showing bearish signs.
Right now, we can see that XRP honored the golden 61.8% retracement and bounced back from it, eventhough each of its bounce back made lower high. We can see that the volume is decreasing as the buyers are slowly fading away and letting this coin retrace to sub 5k satoshi area into our buying zone.
Both EMA's and Ichimoku Clouds are also showing bearish signals so I think Ripple is going to have a very long and slow fall.
Enjoy your day,
bizi
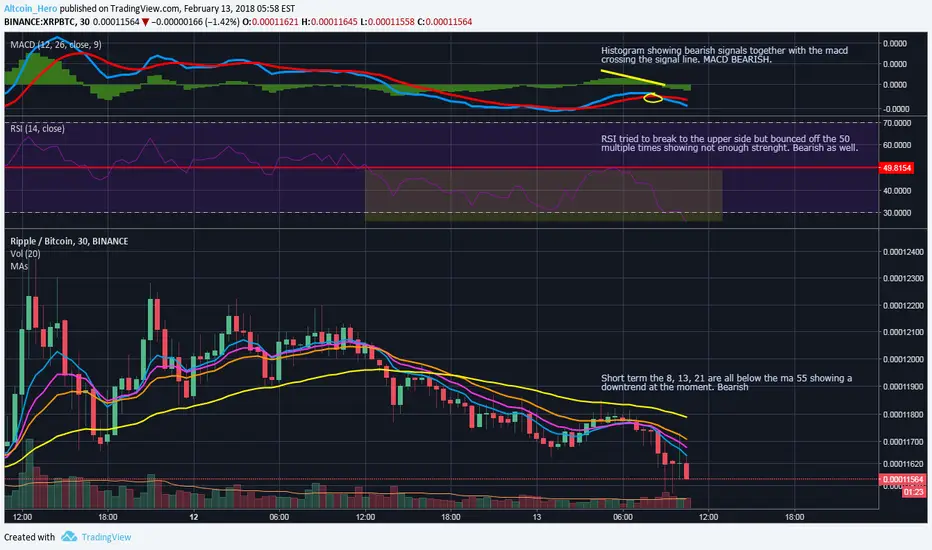
Ripple (XRP) Showing bearish signals on the 30 minute chartHistogram showing bearish signals together with the macd crossing the signal line. RSI tried to break to the upper side but bounced off the 50 multiple times showing not enough strength. Short term the 8, 13, 21 are all below the ma 55 showing a downtrend at the moment. This makes me conclude that XRP is currently bearish.
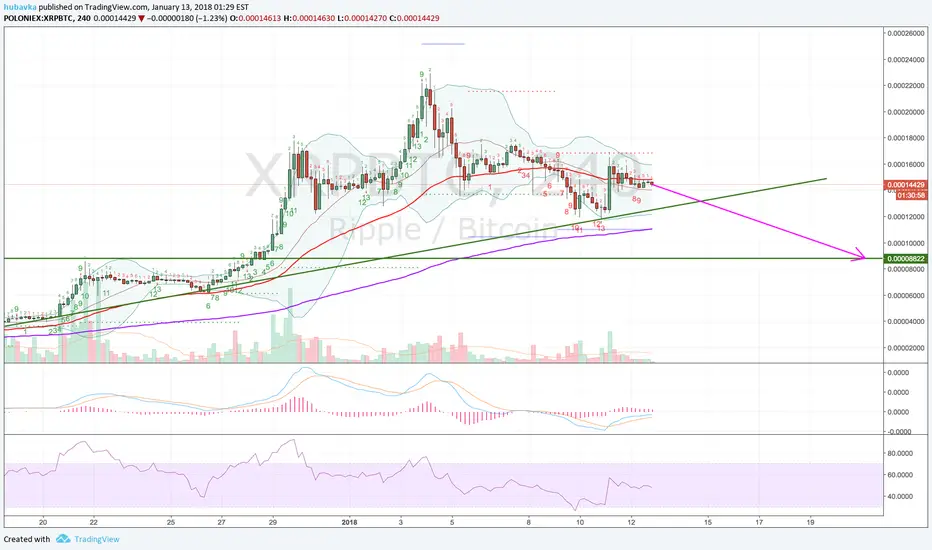
Ripple awaiting judgment. XRP/BTCRipple has created bearish channel,. Overlaid Daily support and resistance levels+ Fibonacci+Gann Fan, drawing future projections on price-points, where have to play attention.
Now price staing at 38% Fibo+Daily Pivot (was tested, and refused). Next 2 Support is surrounded 50% Fibo, and 50% level its serious area for break or reflect and back to Bullish trend.
* 3/1 Gann line+38%Fibo+Daily Pivot- 3/1 become resistance.
* 2/1 is next weak support line. if 50% will be breaked, 2/1 is next destinations,.
*Pink middle channel line, now its support, and will be tested ASAP.
After December rally of XRP, very hard to find good Bull trend line from pass. So all what can do its rely on Fibo+Gann+Daily Supp and Resist.

XRP bull run overXRP finally looks like it has no more fuel for a bull run and a major correction is inbound. Volume is decreasing and it couldt move past sma 21 just like at previous correction.
The downtrend could continue for the next couple of months and a great buy in would be around 1000 sat or lower, than another bull run is bound to happen.
"It's not personal. It's strictly business."

Ripple bounced perfectly as forecasted, prepare for bounce againRipple has bounced off our support perfectly as forecasted previously. We are seeing another potential upcoming bounce with major support at 1.2007 (Fibonacci retracement, horizontal overlap support) which could drive price up to previous resistance at 1.7564 (Fibonacci retracement, horizontal overlap resistance, Fibonacci extension).
Stochastic (34,5,3) is seeing really strong support above 5.7% where a potential bounce could occur.
Trading CFDs on margin carries high risk.
Losses can exceed the initial investment so please ensure you fully understand the risks.

XRPBTC shortShort near 0.00015
Target: 0.000088
Stop: 0.00017
Good Luck!!!
If you don't have accounts at BitMEX or Binanace consider using the links bellow to sign up.
XRP Correction incoming!Expecting a similar correction to the last 2 XRP pumps. Only way this could be wrong is if all the good news surrounding ripple pumps it to the moon. Personally I'm a TA > Fake news kinda guy.


TAS - XRP/USD Trade Opportunity (Closed)The TradeAlertSystem (TAS) aims to pinpoit entry (Enter Trade Alert) and exit points (Exit Trade Alert) for long and short positions for short day/intraday trades based on a powerfull algorithm running on background and picking the best entry and exit zones for the trader.
All the trader has to do is follow the email alerts the system sends, no more endless hours of looking at charts trying to guess entry or exit points.
The system consists also on a smart money managment that consists on entering in a trade with 1/5 of the total intended trade money in the 1st Enter Alert and exit at 1st Exit Alert, and it's also designed to cut your losses providing 4 extra price corrections possibility (pyramiding / layering entry x 4), these corrections are only allowed after a 4 candle period on the 2h chart meaning: the 1st correction should be done only after 8hs or more related to the entry position (1st Enter Trade Alert) and should be only done on a new alert (>= 8h new blue bar), and so on.
After 4 corrections a stop loss with 5% price value on the last correction price should be submitted.
Back testing gives a extremely high level of accuracy on short term trades (day/intraday trades).
This trade is close and was published to show how TAS works.
The chart colors are all changed to reduce headaches, so green is blue and red is white.
Entry price: 0.24117 with 1/5 of trade money. (e.g.: 2000 of 10000 USD)
1st Correction: 0.24350 with 1/5 of trade money.
Average price after the 1st correction: 0.24264 - 2/5 Trade money used
Close price: 0.22935
Trade Result: +5.79%
All our trades:
docs.google.com
Note: This is a closed trade opportunity alert to show our alerts accuracy, subscribers get all our trades alerts in real time by email, PM me if interested.

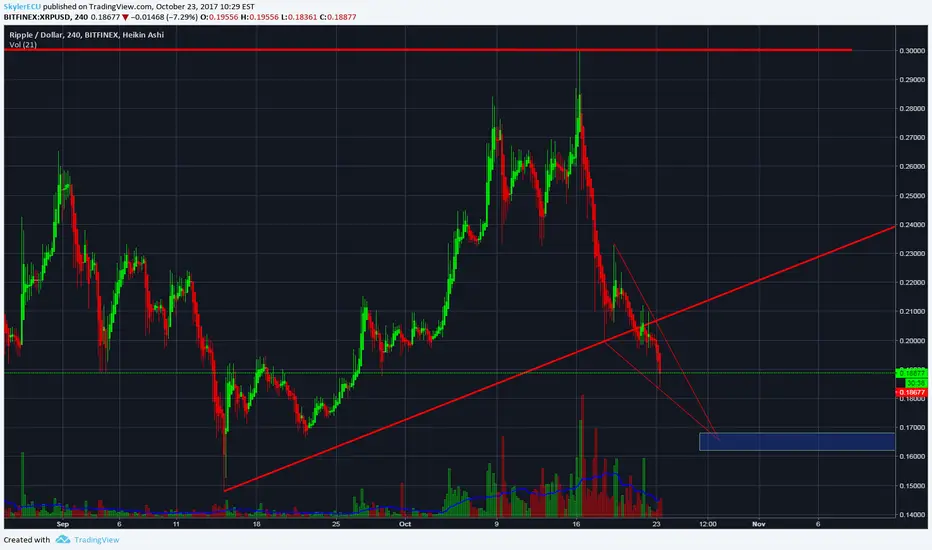
XRP falling wedgeWhere will XRP find its bottom?
I wish I could tell you. XRP has been on a steady skid for the past few days. However, from what I can tell XRP may be working its way into a falling wedge. The blue box is where I XRP will get my attention, there is a heavy resistance in that range, and lines up nicely with the descending wedge pattern. As I have mentioned in other charts, waiting for a solid reversal of the trend will be key before opening a long position on XRP. Look for volume to increase around the level of the blue box, and watch from there to determine a reversal. If XRP does not reverse in the .162-.168 range it will most likely be headed for new all time lows.
I would love opinions, thoughts, criticism, or analysis.
Cheers and happy trading
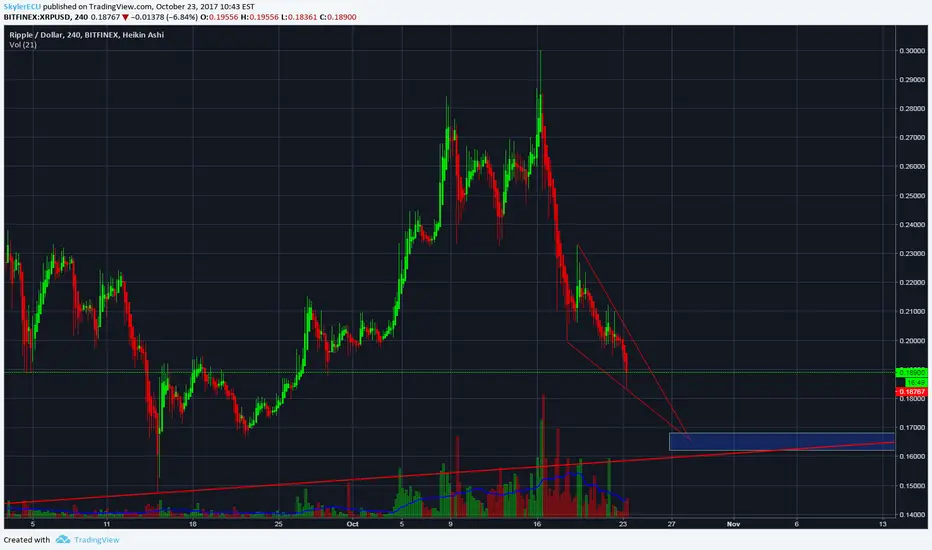
XRP descending wedge XRP continues its bearish down trend, however looks to be may moving in the pattern of a descending wedge (lower peaks on upper resistance, lower support on bottom of wedge, descending volume). Between .168-.162 XRP has a good amount of support, and also will be meeting up with a major upward trend. Look for reversal signals, before entering long, if you decide to do so.
As always, would love feedback, criticism, comments, or other ideas.
Cheers!
XRP GOING SHORTLearning about 5 leg triangle wave theory. Looking forward to seeing how it plays out. With mostly negativity from the crypto community, we will see how it holds up, good news coming soon and may play a big role. I cant make up my mind.

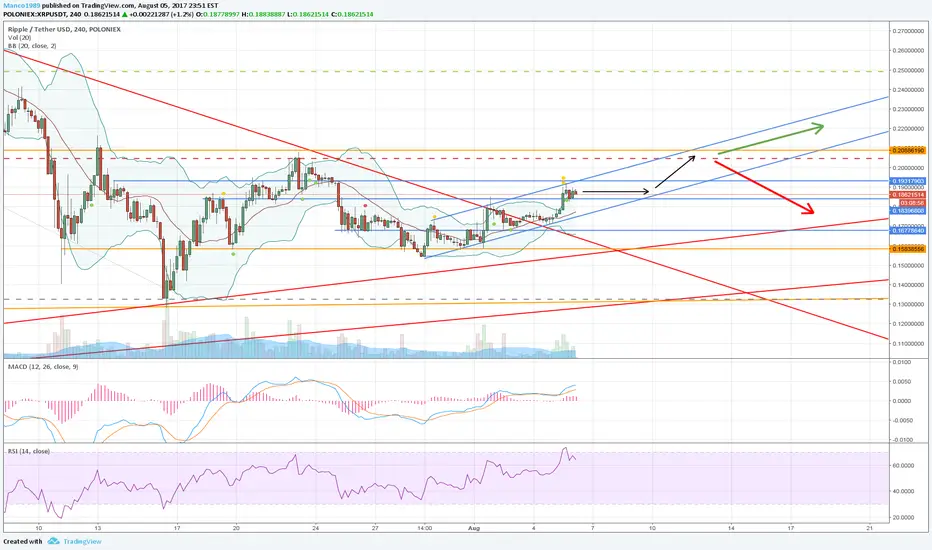
XRP/USDT Sideways movement or upward trendThe course is currently in a slight upward trend. It moves towards 0.236 Fibo and the often confirmed resistance at 0.208. It will show whether the course is strong enough to confirm the upward trend. If it is a sideways trade the next target is 0.167
XRP ShortI posted my long idea for XRP yesterday however I believe it needs to go down one last time before it starts its trend as an ascending triangle. If you analyze previous XRP moves it always touches the bottom one last time before break.
