Xrp - It all comes down to this!🚀Xrp ( CRYPTO:XRPUSD ) has to break structure:
🔎Analysis summary:
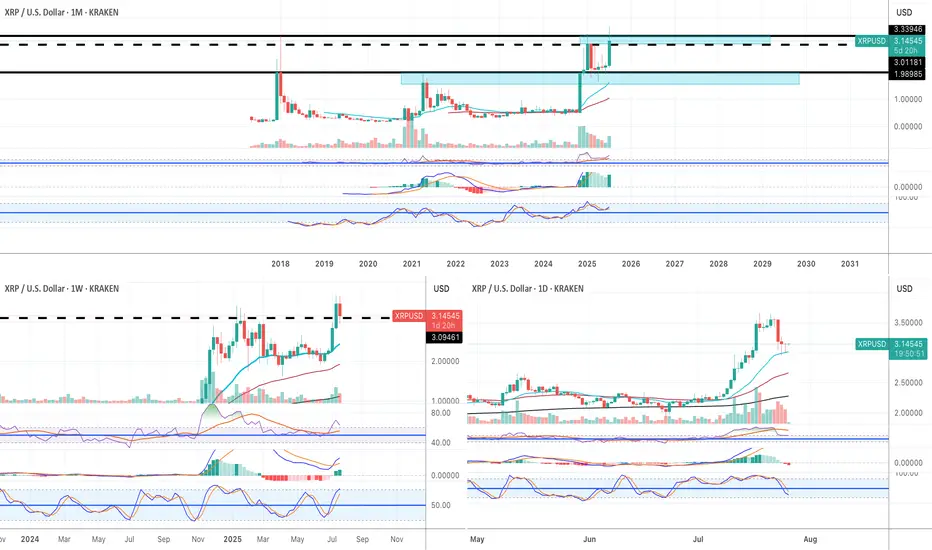
After Xrp created the previous all time high in 2018, we have been seeing a consolidation ever since. With the recent all time high retest however, Xrp is clearly showing some considerable strength. It all comes down to bulls being able to push price higher, above the massive horizontal structure.
📝Levels to watch:
$3.0
SwingTraderPhil
SwingTrading.Simplified. | Investing.Simplified. | #LONGTERMVISION
Xrpusdanalysis

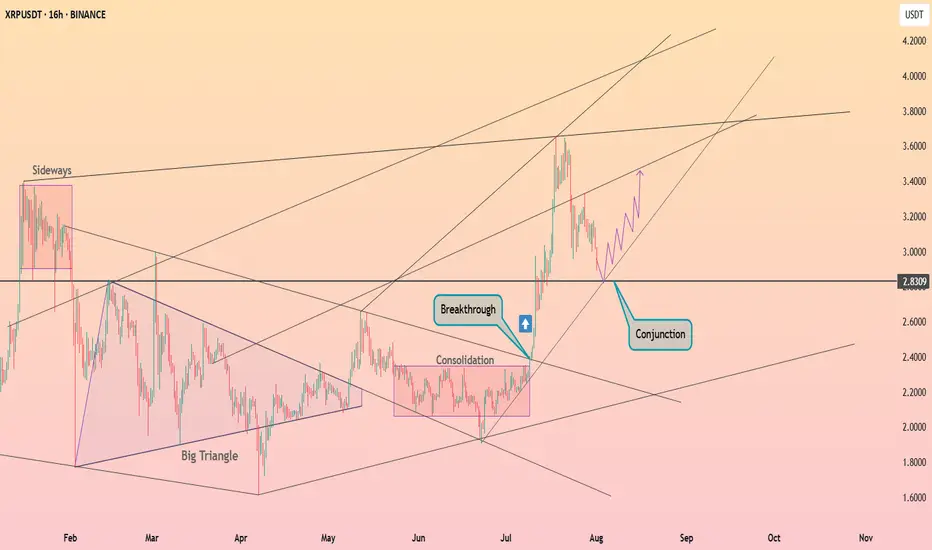
XRP continues to pullback ┆ HolderStatBINANCE:XRPUSDT surged above $2.83 after consolidating in a tight range. Price is now retesting the breakout zone at a key structural conjunction. If the level holds, a renewed move toward $3.40 may follow as bulls reclaim control.
The Great XRP Escape Plan: Thief Strategy Deployed🌀 XRP/USDT – Thief Trader’s Master Heist Plan: Crack the Vault Before They Catch On! 🧠💰
🔐💸 Operation Code: Ripple Raid 3.9 - Eyes on the Prize, Hands on the Trigger 💥
🌍 Attention Global Market Robbers and Strategic Money Movers!
This ain't just another analysis—this is the Thief Trading Style Blueprint, surgically designed for the XRP/USDT Crypto Market. Whether you're a silent sniper or full-squad raider, this trade setup is your next high-voltage money heist.
🔍 Market Breakdown:
📊 Technical + Fundamental = Robbery Precision
Currently, Ripple (XRP) is showing bullish fuel—charging into our trap-the-bears zone. Volatility is tightening, resistance is trembling, and it smells like liquidity is about to get stolen.
⚠️ Warning: The market’s at a risky cross-zone – overbought with heavy consolidation – where big bears and trapped traders usually play defense. That’s exactly where we strike.
🔓 Entry Gameplan – “Wait, Trigger, Execute”
📈 Entry:
"The heist begins when the candle breaks the high and screams confirmation!"
Set Buy Stop Orders above the recent resistance (around 3.1000).
Alternatively, use Buy Limit Orders on pullbacks at key swing levels (15M or 30M timeframes).
We use a multi-layered entry strategy (aka DCA + stacking like a pro thief stacking vaults). Be surgical. Be patient.
📌 Pro Tip: Always set a chart alert at the trigger zone to avoid missing the breakout party.
🛑 Stop Loss – “Breakout First, Then Talk Safety”
🚫 NO SL BEFORE BREAKOUT. Period.
Once price breaks out, then:
🔐 SL = Nearest 4H candle wick swing low (around 2.8000).
But remember, your SL = your risk appetite.
Whether you're placing 1 big order or 10 mini traps, manage it smart.
🎯 Target – "Get Rich, Then Vanish"
🏴☠️ Primary Take Profit Zone:
Target: 3.9000
Or exit anytime you see signs of reversal.
Don't get greedy—get paid.
👀 Scalpers’ Note:
Only play the Long side.
If you're deep-pocketed, dive in straight. If not, ride with swing traders and trail your SL to protect profits.
🔥 Why This Trade is 🔐:
📈 Current price structure, liquidity zones, and momentum favor bulls.
📊 Correlated intermarket signals + on-chain activity + macro backdrop align with XRP strength.
🧠 Smart money accumulation is visible – this is your window before the big breakout.
🚨 News & Position Management Alert:
📢 Stay clear of opening trades during major news events.
Use Trailing Stop-Loss on running positions to lock gains while letting profits fly.
This is not hype. This is precision.
Thief Trader doesn’t guess – we plan, we trigger, we exit.
📌 Final Words:
Whether you're scalping seconds or swinging for days – follow the blueprint. XRP has a vault to crack, and we’re here to rob it clean.
Now go out there, set those traps, and let the market pay you like it owes you.
🧠💸🕶️ Next Heist Plan Coming Soon… Stay Sharp.

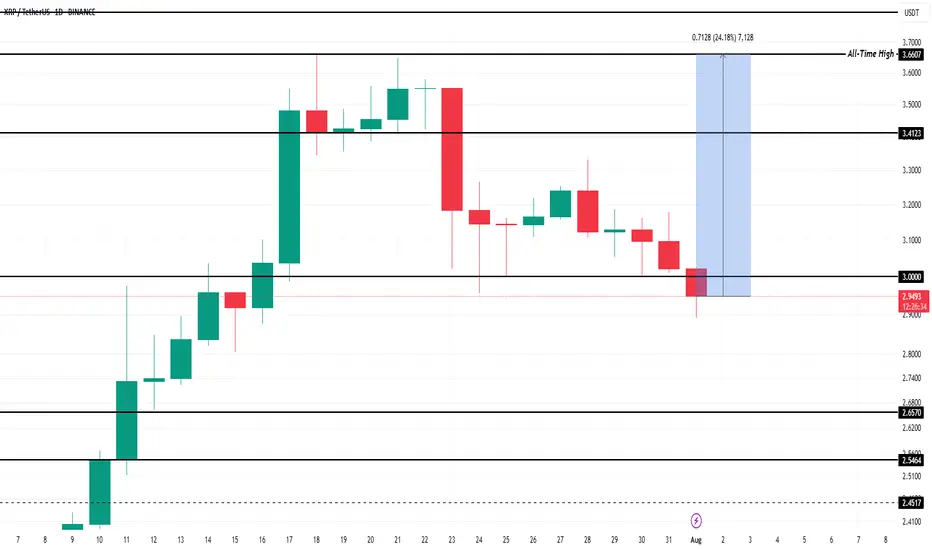
What To Expect From XRP In August 2025?Currently, BINANCE:XRPUSDT is trading at $2.99, slipping through the key support level of $3.00. While the altcoin is still over 22% away from its ATH of $3.66 , the foundation for potential growth remains strong. Historical data has shown that August typically brings bearish momentum for BINANCE:XRPUSDT , with median monthly returns of -6% .
However, given the strong buying activity observed recently and the positive technical indicators, this August might defy the usual trend. If BINANCE:XRPUSDT manages to secure support above $3.41, the altcoin could push towards its ATH once again . Alexis Sirkia, Captain at Yellow Network, discussed with BeInCrypto how XRP’s future could be looking like.
“Institutions that have been in the market for a while are gaining momentum. We're also, in the meanwhile, in a macro environment where funds are doing risk rotation… BINANCE:XRPUSDT is taking its stand with regulation and infrastructure, not hype. That's what will endure in the long run. Short-term flows are fleeting, but the groundwork laid today will define the cycle to follow.”
However, there’s a downside risk. If BINANCE:XRPUSDT fails to reclaim the $3.00 support, the price could fall to $2.65, invalidating the bullish thesis. A drop to this level would mark a four-week low and would likely lead to further selling pressure.
Xrp - The final bullish breakout!💰Xrp ( CRYPTO:XRPUSD ) will create new all time highs:
🔎Analysis summary:
After a consolidation of an incredible seven years, Xrp is finally about to create new all time highs. With this monthly candle of +40%, bulls are totally taking over control, which means that an altcoin season is likely to happen. And the major winner will simply be our lovely coin of Xrp.
📝Levels to watch:
$3.0
🙏🏻#LONGTERMVISION
SwingTraderPhil

XRP Price Prediction: Is a Breakout to $15 Imminent? XRP Breakout Targets $15 — Analyst Says 'This Is Just The Start': Is XRP Set to Explode?
The cryptocurrency world is once again turning its attention to XRP, the token developed by Ripple Labs, as bullish analysts predict an imminent and explosive rally. After a strong run-up earlier in 2025, XRP has pulled back slightly and is now approaching a critical support zone. Some analysts are now calling for a $15 breakout target, even as the token hovers near $2.80, a level many see as a pivotal point for the next leg of the bull market.
Let's dive into the latest developments, technical analysis, and market sentiment surrounding XRP — and why some believe "this is just the start."
XRP Price Overview: Current Positioning
As of early August 2025, XRP is trading around the $2.85 mark, down from its recent high near $3.70. While this pullback may concern short-term traders, technical analysts argue that this retracement is healthy and necessary for the formation of a higher low, a common pattern in bullish market structures.
The key price levels to watch include a support zone between $2.80 and $2.95, resistance at $3.70, downside risk to $2.20 if $2.80 fails, and upside targets of $5 in the short term and $15 in the mid-term.
Why $2.80 Is So Important
The $2.80 support level is emerging as a make-or-break price zone. It aligns with multiple technical indicators including the 0.618 Fibonacci retracement from the previous rally, the Value Area High (VAH) from recent price accumulation zones, and Higher Time Frame (HTF) structure showing consistent support around this level in recent months.
If XRP manages to hold this level and establish a higher low, it could kick off a new bullish wave, potentially targeting $5 in the short term and beyond in the medium term.
Analysts Call for $15 XRP — Is It Possible?
Several key factors support the bull case. Institutional interest continues to grow as Ripple's partnerships with banks and financial institutions support long-term utility. Legal clarity has improved significantly after years of regulatory uncertainty, with the SEC lawsuit largely resolved, removing a major overhang. Technical indicators including bullish divergence on the RSI, MACD bullish crossover, and increasing volume all support upward momentum. Additionally, as Bitcoin stabilizes, funds are flowing into major altcoins, including XRP, as part of the typical altcoin rotation cycle.
August Rally Incoming? Bullish Divergence Signals 20% Upside
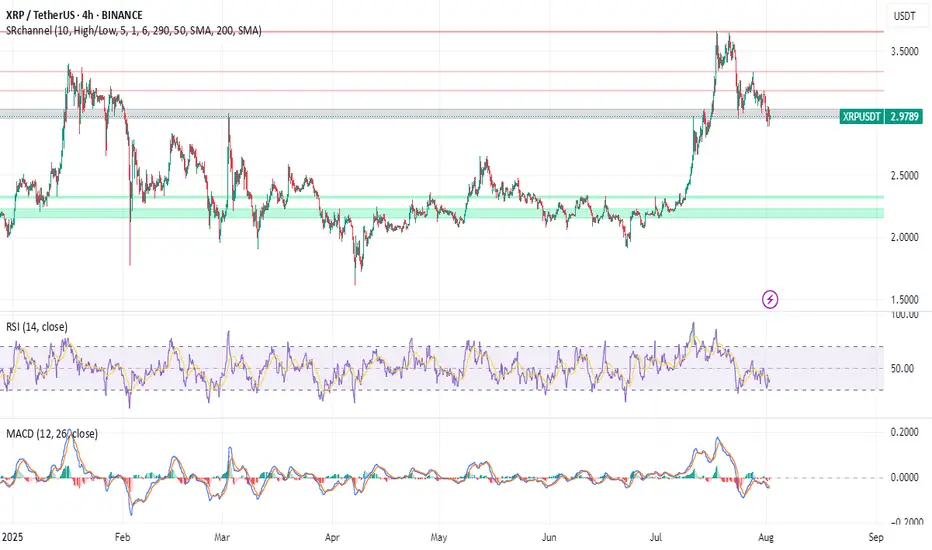
Technical analysts have identified a bullish divergence forming on the daily and 4-hour charts — a classic signal that often precedes a strong move upward. This divergence appears as the price makes lower lows while the RSI makes higher lows, suggesting momentum is shifting in favor of the bulls.
If confirmed, this divergence could catalyze a 20% rally in August, potentially pushing XRP back above $3.40 and testing the critical $3.70 resistance. A clean break above this level would likely open the floodgates for further gains.
$3.70: The Gatekeeper to Higher Highs
While there's excitement around the potential for XRP to hit $5 or even $15, the path forward must first go through $3.70. This resistance level has stalled price action multiple times in 2025 and will likely serve as a psychological and technical barrier.
Two scenarios are possible: a break above $3.70 would open the door to $5 and $7 targets quickly, while a rejection at $3.70 could lead to a pullback toward $2.20, especially if $2.80 fails.
Traders Hedge With New XRP Rival: Remittix
As XRP consolidates, some traders are diversifying their holdings into Remittix (RTX), a new cross-border payments token that promises enhanced scalability and compliance tools. RTX has gained traction recently, especially among DeFi-native traders seeking alternatives to XRP's centralized development model.
Remittix highlights include strong tokenomics with a deflationary model and staking rewards, a real-world use case targeting remittance markets in Asia and Africa, and a PayFi Wallet with beta slated for launch in Q3 2025, offering seamless integration with fiat on/off ramps.
While Remittix is gaining momentum, XRP's brand recognition, liquidity, and institutional partnerships still give it a significant edge in the payments space.
XRP Price Forecast: Short-Term and Long-Term Outlook
In the short term over the next 30 days, the bullish scenario involves holding $2.80 support, breaking $3.70, and rallying to $5. The bearish scenario would see XRP lose $2.80, drop to $2.20, and consolidate.
For the mid-term outlook in Q4 2025, if the bullish trend continues and macro conditions remain favorable, XRP could target $7 to $10 by the end of the year. In a full altseason scenario, $15 is not out of reach, according to some analysts.
Key Catalysts That Could Drive XRP Higher
Several catalysts could propel XRP higher. Institutional adoption continues to expand as Ripple's partnerships, especially in the Middle East and Asia-Pacific, lay the groundwork for long-term utility. CBDC integration presents another opportunity as Ripple works with multiple central banks on developing Central Bank Digital Currencies. Any progress here could significantly boost XRP's real-world use.
ETP listings could bring new inflows as XRP may benefit from exchange-traded products in Europe and Asia, especially if more crypto-based ETFs gain traction globally. The macro environment also favors growth, with a dovish Fed, weakening USD, and rising crypto adoption all creating a fertile environment for altcoins like XRP to thrive.
Community Sentiment: Is the XRP Army Ready?
The XRP community, also known as the XRP Army, remains one of the most passionate and active in the crypto space. Social media sentiment has turned increasingly bullish, with hashtags like #XRPToTheMoon and #XRP15 trending on X (formerly Twitter).
However, analysts caution against overexuberance, noting that market cycles can be volatile and unpredictable.
Risks to Watch
While the bullish case is compelling, it's important to consider the risks. Macro-economic shocks from a sudden shift in interest rates or recession fears could impact crypto markets broadly. Regulatory setbacks remain possible — although Ripple has gained legal clarity in the U.S., future regulations in Europe or Asia could cause volatility.
Network risks from any technical issues or security breaches could erode trust and trigger selloffs. Competition from new projects like Remittix, Stellar (XLM), and other payment-focused tokens could eat into XRP's market share.
Final Thoughts: Is XRP Set to Explode?
With XRP hovering near a critical support zone at $2.80, all eyes are on whether bulls can defend this level and push the token back into an uptrend. If successful, the next moves could be explosive, with analysts forecasting $5 in the short term and potentially $15 or higher before the end of 2025.
While risks remain, the technical setup, improving fundamentals, and renewed community optimism all point toward a bullish continuation — if key levels hold.
As always, investors should stay informed, manage risk, and avoid emotional decisions in this fast-moving market.
Summary
XRP currently trades around $2.85 with key support at $2.80 and major resistance at $3.70. Short-term targets point to $5 while mid-term projections suggest $10 to $15 is possible. Downside risk exists to $2.20 if support fails. Bullish catalysts include legal clarity, growing utility, and increasing adoption, while bearish risks encompass macro shocks, competition, and potential regulation.
Disclaimer
This article is for informational purposes only and is not financial advice. Cryptocurrency investments are highly volatile and involve significant risk. Always do your own research (DYOR) and consult with a financial advisor before making investment decisions.
Xrp - This is the bullrun breakout!🔑Xrp ( CRYPTO:XRPUSD ) breaks the triangle now:
🔎Analysis summary:
After the recent bullish break and retest, Xrp managed to already rally another +100%. This is a clear indication that bulls are still totally in control of cryptos and especially Xrp. It all just comes down to the all time breakout, which will then lead to a final parabolic rally.
📝Levels to watch:
$3.0
SwingTraderPhil
SwingTrading.Simplified. | Investing.Simplified. | #LONGTERMVISION

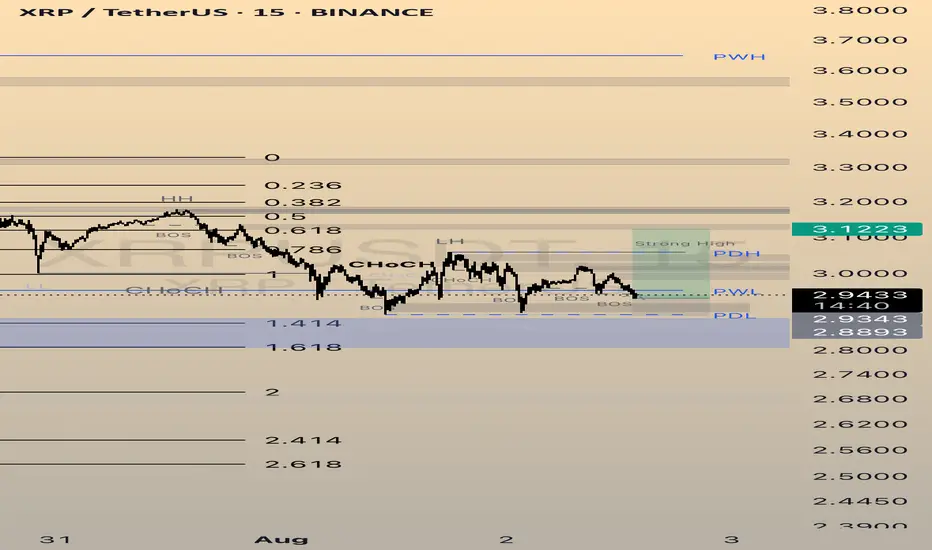
XRP - FUTURES SIGNALFUTURES SIGNAL
Coin: XRP
Direction: LONG
🟢Input range: 2,9358-2,9219
✔️ТР: 3,0116/3,0606/3,1223
❌SL: 2,8893
We try to carefully open a long position from the order block after the structure is broken on the 15-minute time frame. We enter at a reduced risk
Super bullish!! (I am not a XRP fan, but still) XRP is one of those cryptocurrencies that attract cult-like followers. I am not one of them.
Fundamentally I have no idea about the long term potential of XRP. HOWEVER, purely based on technicaly analysis, it looks very bullish to me.
Monthly:
1) the price finally broke above the 2018 historical ATH.
2) All momentum indicators in the bull zone.
3) Both RSI and MACD are in the overbought territory but they can remain in the OB territory for weeks and weeks when the macro bull trend begins.
4) Stochastic lines have crossed to the upside in the bull zone.
Weekly:
1) all momentum indicators are in the bull zone.
2) The price broke above the historical ATH. It is going through pull back now, but, there is a strong buying pressure around $3.15.
Daily:
1) all momentum indicators have reached the overbought territory. The lines are now rolled to the downside, however, it is likely to be a corrective move.
2) the price is hovering above EMA21 where the recent price breakout happened on Thurs 17th July. I have been monitoring price action in lower time frames such as 5 and 15 minutes, and it looks like the price does not want to go below the previous historical high at this stage.
I am not very familiar with XRP, but purely based on the current price action, it looks very bullish. For the very first time as a trader/investor, I deployed my capital to buy XRP last Wed (just under $3.00).
I have already took some profit when it hit $3.60. But I am planning to sell 90% of my XRP when it reaches $4.50 and $5.00, and let the rest run just in case it goes to the moon😅.
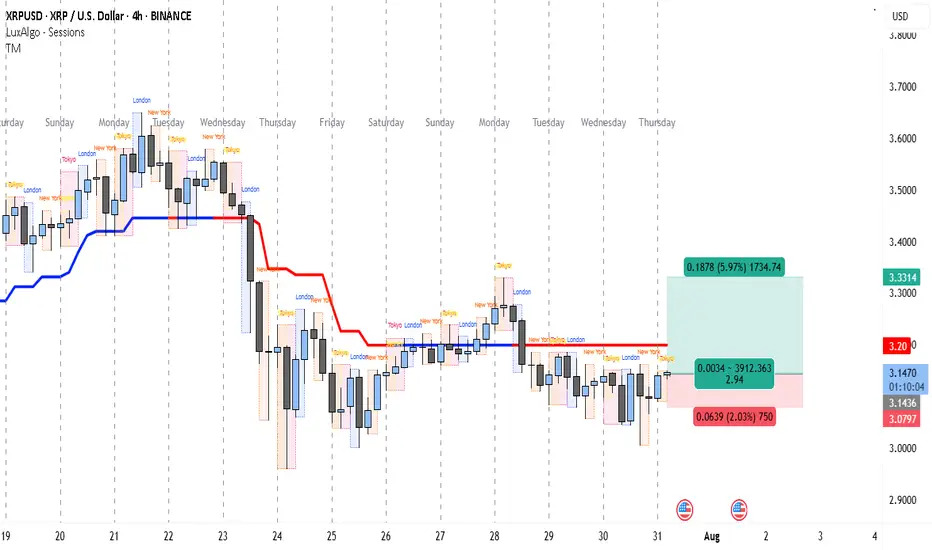
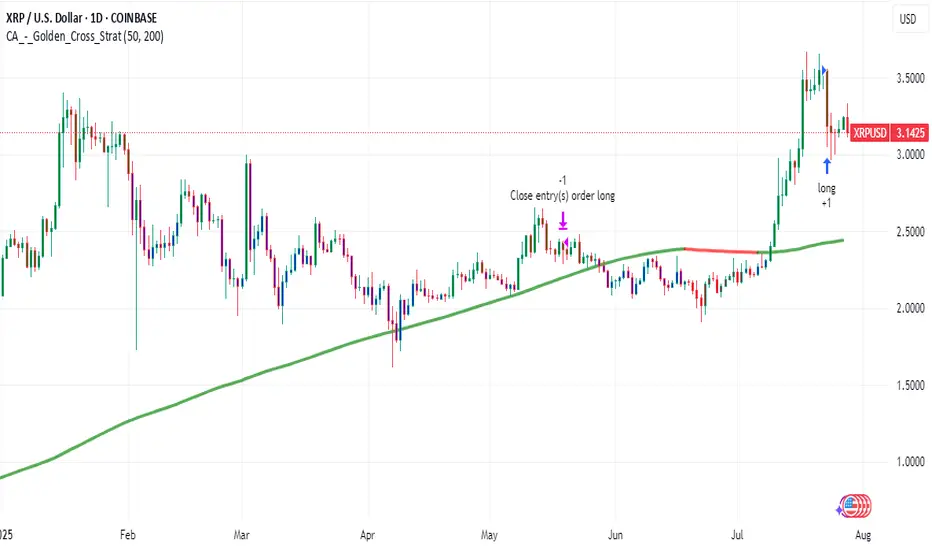
XRP’s 1:3 R:R Setup Could Pay Off FastThe 4-hour chart for XRP/USD indicates a market that has been under selling pressure since the sharp drop around July 23rd, where price broke down from the 3.40+ range. Since then, XRP has been struggling to reclaim higher levels, with the red trend indicator line (likely a moving average or trend-follow tool) acting as a persistent dynamic resistance.
After bottoming near the 3.05 zone on July 25th, the price moved into a sideways consolidation, repeatedly testing both the lower range (around 3.08) and upper range (around 3.20). This tight range suggests accumulation or distribution ahead of a bigger move.
Currently, the chart shows a potential long setup triggered around 3.1450, with a stop loss just below 3.0797 and a take profit target at 3.3314. This setup aims to capture a breakout from the consolidation zone toward the previous resistance area just below 3.35. The risk-to-reward ratio is favorable (close to 1:3), making it an attractive trade for short-term swing traders.
The target level aligns with the price area before the breakdown on July 23rd, where sellers previously gained control. Breaking through that level could signal a short-term trend reversal. However, the price still needs to clear the 3.20 resistance with a strong candle close to confirm bullish momentum.
Trade Setup
• Entry: 3.1450 (current level, inside consolidation support)
• Stop Loss: 3.0797 (below recent swing low)
• Take Profit: 3.3314 (prior resistance zone)
• Risk-to-Reward Ratio: ~1:2.94
• Trade Bias: Short-term long aiming for breakout from consolidation
Analytical Geometry Strategy Applied to the Market — XRP/USDTAnalytical Geometry Strategy Applied to the Market — XRP/USDT
Position Trader: Action Based on the Structural Geometry of the Metatron's Cube
Operational Introduction
In medium to long-term strategic positioning (position trading), market entry must not be random or emotional — it must be grounded in predictable zones of symmetry and imbalance.
For that, we apply Analytical Geometry to chart structure, using the Metatron’s Cube — a three-dimensional geometric figure composed of 13 spheres and 78 interlinked vector lines.
The cube is a projection from a six-dimensional hyperplane onto the 2D Cartesian plane. Its application on the chart allows us to:
Delimit areas of vector confluence (support/resistance)
Identify angular energy zones and technical pressure points
Anticipate critical price inflection points based on mathematical symmetry
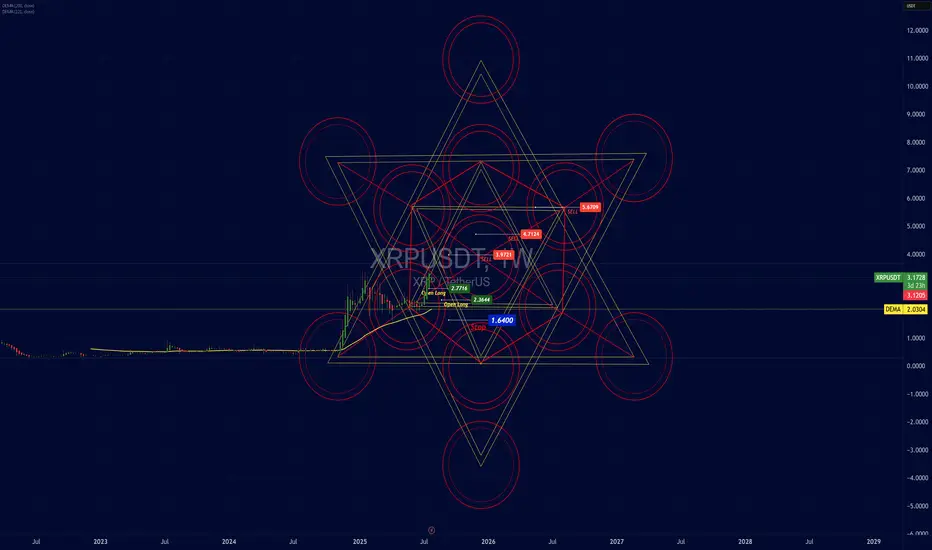
Structural Application on the XRP/USDT Chart
The projection of Metatron’s Cube onto the XRP/USDT chart reveals:
Entry points (Open Long) located at the lower inner vertices of the cube, where vectors converge toward the central axis — the liquidity attraction point
Supply zones (Sell) aligning with circular and angular intersections of the lines, where multiple vectors overlap — indicating movement saturation and possible redistribution
Stops placed below the angular base, representing a break in symmetry (the point where the vector loses cohesion with the model)
Structural Coordinates (Based on Vector Analysis)
Entry Points (Open Long):
Point A: (x = 2.6444, y = 0)
Point B: (x = 2.7176, y = 0)
Strategic Stop:
Point C: (x = 1.6400, y = -1), just below the lower angular base — a vector dispersion zone
Technical Targets (Supply Zones):
Level 1: x = 3.9721 (first circular layer)
Level 2: x = 4.7124 (72° expansion — common in golden ratio geometry)
Level 3: x = 5.6709 (structural exhaustion zone)
Technical Justification: Why Analytical Geometry Works
Analytical Geometry, developed by René Descartes, allows for the representation of curves, vectors, and spatial structures using numerical coordinates.
Metatron’s Cube functions as a vector mesh over the price chart — translating market behavior into a mathematical language of:
Proportions
Intersections
Angular projections
This approach enables us to:
Model price behavior as a multivariable function
Anticipate reaction zones based on angular and linear symmetry
Protect capital with stops anchored in vector-based rupture zones
Scientific Relevance
Metatron’s Cube is not merely symbolic — it remains actively used in modern physics and aerospace engineering.
At NASA, geometries derived from the Cube are applied to:
Orbital simulations
Spatial perimeter calculations on nonlinear geodesics
Angular mass distribution in interplanetary navigation systems
The same mathematical foundation used to understand celestial body dynamics is used here to identify repeatable behavior patterns in the market — with a high degree of precision.
Technical Conclusion
The market’s geometric structure is not random — it is vectorial, symmetrical, and proportional
Using Metatron’s Cube as a geometric projection allows for rational and coordinated alignment of entry, stop, and target points
The first target has already been validated, proving the structure’s effectiveness
The position remains active, with upper targets defined by vector intersections and angular saturation zones
Closing Insight
"The market’s geometry is the invisible code behind apparent movement. He who understands the vectors, masters the cycles."
This strategic model combines analytical geometry, energetic symmetry, and technical foundation in a unified framework — with precision, logic, and harmony.
XRP WHERE ARE WE HEADED ? LEVELS TO LOOKOUT FORHey trading fam
So XRP is a fun one but based on BTC correcting and what we are seeing there are a couple thesis's that we currently have for it
Thesis 1: We break south from 2.98 lows: Levels to look out for:
2.80
2.70
2.68
Thesis 2: We break the highs of 3.29: Levels to look out for:
3.65
3.79
3.99
Trade Smarter Live Better
Kris

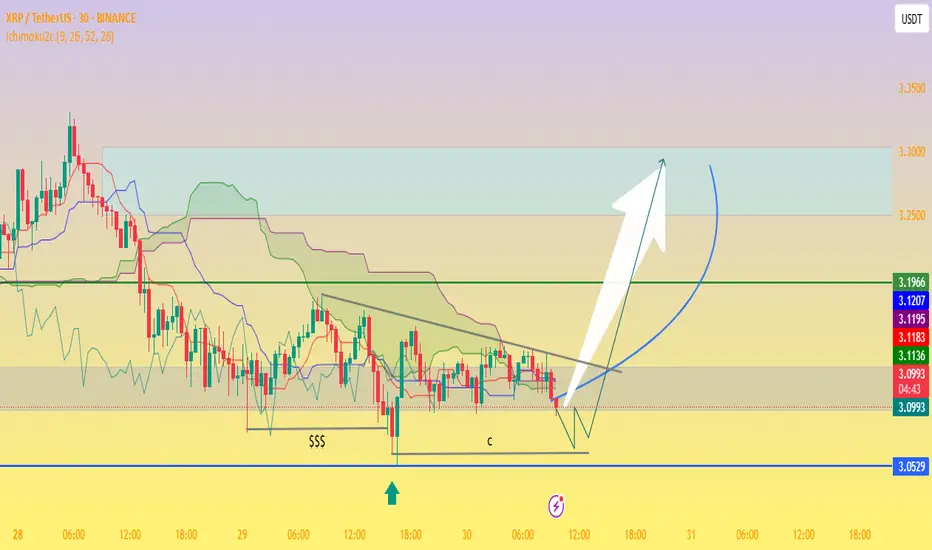
XRP/USDT Potential Reversal Zone — “Bottom Tested,Bullish Flag!📉 Chart Analysis Summary
The divided chart indicates XRP trading between a critical support zone near $3.05–$3.09 and overhead resistance around $3.19–$3.23, forming what could be a bullish pennant or descending wedge setup on the 30-minute timeframe:
Support Zone (~$3.05–$3.09):
Price retested this level multiple times (labeled as “$$$” and “c”), clearly identifying a demand zone.
Ichimoku cloud support lies nearby, adding technical relevance to the floor.
Resistance Trendline & Green Line (~$3.19–$3.23):
A descending trendline is visible, showing lower highs and building compression.
A breakout above this resistance zone is necessary to signal bullish continuation.
Projected Path:
The schematic arrow suggests a bounce off support, followed by consolidation, and then a breakout above resistance, targeting the $3.25–$3.30+ zone and potentially higher.
🔍 Context from Recent Market Commentary
Support Holding Above $3.11–$3.15: Analysts highlight strong support around $3.11–$3.15, where institutional and retail interest appears concentrated
TradingView
+13
TradingView
+13
CoinCentral
+13
.
Resistance & Consolidation at $3.30: While XRP briefly surpassed $3.30, it encountered rejection and remains rangebound. A confirmed break beyond this level could validate the bullish carry-forward
CryptoPotato
CoinDesk
.
Wave-Elliott Bull Case: Various Elliott Wave scenarios forecast targets as high as $5.25, $6.85, or even $10–$15 should Wave 5 materialize, though this depends on market strength and momentum
CoinCentral
.
✅ Trading Outlook
Bullish Scenario:
Bounce off $3.05–$3.15 support.
Break above $3.23–$3.30 resistance.
Potential upside targets:
Near term: $3.30–$3.40.
Medium term: $4.64 or $5–$6, with strong case for $6.85 if momentum and on-chain demand strengthen
CryptoPotato
+15
TECHi
+15
CoinGape
+15
.
Bearish Scenario:
Failure to hold $3.05–$3.11 risk retest toward $2.95 or lower zones ($2.30–$2.70)
TECHi
.
🧭 What to Watch
Key Level Role
$3.05–$3.11 Critical support/demand zone
$3.19–$3.23 Short‑term resistance/framing compression
~$3.30+ Confirm bullish breakout — key trigger for Wave 5 and higher targets
🧠 Overall Take
This chart is painting a classic consolidation near strong support with a visible descending upper boundary. If XRP holds the ~$3.05 zone and breaks above $3.23–$3.30 with conviction, it could initiate a bull move toward $3.40–$4.00, and potentially even $5–$6+ depending on volume and momentum.
However, breaks below $3.11 may open deeper downside risk. For many traders, this is a simple risk-reward setup: entry near the lower channel with a stop under $3.05 and initial profit targets at $3.30–$3.40.
XRP: Support at $2.960 Holds the Bullish SetupFenzoFx—XRP dipped from $3.666 but stabilized near the monthly anchored VWAP at $2.960. It now trades at $3.142 above the ascending trendline.
Immediate resistance lies at $3.332, aligned with the descending trendline. A close above this level may propel XRP to $3.432. Strong buying could extend gains to the recent high of $3.666.
The bullish outlook stands while XRP/USD holds above key support at $2.960. A drop below this level would invalidate the bullish scenario.

XRP: PullbackRipple’s XRP has once again seen a significant pullback since last Monday, raising the possibility that the high of turquoise wave B may already be in. For now, however, we continue to allow room for this corrective move to extend up to resistance at $4.09, before turquoise wave C drives the altcoin lower toward the magenta wave (2) low. With XRP still trading well above the $0.38 support level, the next upward impulse—magenta wave (3)—should then begin to take shape. Alternatively, there is a 33% chance that this bullish move has already started; however, this scenario would only be confirmed by a decisive break above the $4.09 level.
📈 Over 190 precise analyses, clear entry points, and defined Target Zones - that's what we do (for more: look to the right).

Bullish Signals Mount for XRP as Price Holds Weekend GainsXRP at a Crossroads: Technical Strength Meets Fundamental Catalysts in a High-Stakes Market
July 28, 2025 – In the volatile and ever-evolving world of digital assets, few tokens command as much attention, debate, and fervent community support as XRP. The digital asset, intrinsically linked with the fintech company Ripple, is currently navigating a period of intense market focus. After a period of consolidation, XRP is demonstrating renewed strength, holding onto recent gains and pressing against critical technical resistance levels. This price action is not occurring in a vacuum; it is the culmination of powerful undercurrents, including bullish chart patterns, significant accumulation by large holders, and a shifting landscape of regulatory clarity and institutional interest that could define its trajectory for years to come.
As of Monday morning, XRP has shown stability, trading around the $3.16 to $3.24 range. This follows a period where the token has been building momentum, with analysts closely watching key resistance zones between $3.30 and $3.40. A decisive break above these levels could signal the start of a new upward trend, while the ability to hold support, particularly around $3.15 to $3.20, is seen as crucial for maintaining the current bullish structure. This delicate balance has traders and long-term investors alike on high alert, as a confluence of technical indicators and fundamental developments suggests that XRP may be poised for its next significant move.
________________________________________
Chapter 1: Decoding the Charts: Bullish Patterns Emerge
For technical analysts, the recent XRP charts are a compelling study in bullish potential. Several classic patterns and indicators have emerged, suggesting that the path of least resistance may be upwards. These signals, watched closely by traders globally, are fueling a narrative of an imminent breakout.
One of the most discussed formations is the "Cup and Handle" pattern. This is a bullish continuation pattern that resembles a teacup on a chart. The "cup" is a U-shaped or rounded bottom that forms after a price run-up, indicating a period of consolidation and accumulation. This is followed by the "handle," a shorter and shallower downward drift in price, representing a final shakeout before a potential major upward move. Analysts have identified a large cup formation developing on XRP's long-term charts, with some pointing to a breakout zone around $3.64. A confirmed move above the handle's resistance could, according to technical theory, trigger an explosive rally, with some analysts projecting targets as high as $5.18, $7, or even a staggering $30 based on the pattern's depth.
Adding to this bullish thesis is the appearance of a "Golden Cross." This occurs when a shorter-term moving average (like the 50-day) crosses above a longer-term moving average (like the 200-day) on a price chart. It is widely regarded as a signal of a potential long-term uptrend. A golden cross was recently confirmed on XRP's daily chart around July 23, 2025, an event that historically has preceded significant price runs. The last major golden cross in late 2024 was followed by a rally of over 460% in two months. While past performance is not indicative of future results, the reappearance of such a powerful signal has undoubtedly bolstered investor confidence.
Furthermore, a rare golden cross has also been observed on the XRP/BTC trading pair, where XRP's price is measured against Bitcoin. This specific event, where the 23-day moving average crossed the 200-day, previously preceded a 158% surge in the pair's value in just two weeks. The near-identical structure of the current pattern has led analysts to suggest that XRP may be poised to outperform Bitcoin in the near term, especially as Bitcoin's price has been consolidating, shifting investor focus toward promising altcoins.
These technical signals—from the broad Cup and Handle to the precise Golden Cross—are painting a picture of a market coiling for a significant move. They suggest that underlying buying pressure is quietly building, setting the stage for a potential breakout if the market's fundamental drivers align.
________________________________________
Chapter 2: The Whale Effect: Following the Smart Money
Beyond the lines on a chart, the actions of the market's largest players—colloquially known as "whales"—provide another critical layer of insight. These are individuals or entities holding vast amounts of a cryptocurrency, and their trading activity can significantly influence market trends and sentiment. Recently, on-chain data has revealed a clear and compelling trend: XRP whales are accumulating.
In a remarkable show of force, wallets holding between 10 million and 100 million XRP have been steadily increasing their holdings, adding over 130 million XRP in a single day recently. These large-scale investors now control approximately 14% of the circulating supply, a historic high for this cohort. This accumulation is significant because it suggests that sophisticated, well-capitalized market participants are confident in XRP's future prospects and are positioning themselves for a potential price increase.
Simultaneously, the flow of XRP from whale wallets to exchanges has plummeted by over 93% since early July. This is a crucial indicator, as large transfers to exchanges often signal an intention to sell. The sharp decline suggests that whales are not only buying more XRP but are also holding onto their existing assets, reducing the available supply on the market and removing significant sell-side pressure. This behavior, often described as a "supply shock," can create a powerful tailwind for the price if demand continues to rise.
This intense accumulation has not gone unnoticed. In one instance, two identical transactions moved a combined 306.4 million XRP, worth nearly $1 billion, from an exchange to a private wallet within 60 seconds. Such large, coordinated movements are often interpreted as strategic positioning ahead of anticipated positive news or a market-wide rally. This activity, combined with reports of over 2,700 wallets now holding at least 1 million XRP each, paints a picture of broad-based accumulation among the asset's most significant backers. This "smart money" activity often provides a psychological boost to retail investors, reinforcing the belief that a major move could be on the horizon.
________________________________________
Chapter 3: The Fundamental Pillars: Regulation, ETFs, and Utility
While technicals and whale movements drive short-to-medium-term sentiment, the long-term value of any digital asset rests on its fundamental pillars. For XRP, these pillars are its evolving regulatory status, the tantalizing prospect of a spot Exchange-Traded Fund (ETF), and its core utility within Ripple's global payments network.
Regulatory Clarity on the Horizon:
The most significant overhang on XRP for years has been the lawsuit filed by the U.S. Securities and Exchange Commission (SEC) in December 2020, which alleged that Ripple conducted an unregistered securities offering. This legal battle has been a focal point for the entire crypto industry. However, recent developments have shifted sentiment dramatically. Key court rulings, including a partial victory for Ripple where a judge determined that some of its XRP sales did not qualify as securities, have bolstered institutional confidence.
Currently, the case is in a delicate phase, with both Ripple and the SEC having paused their respective appeals. While rumors of a final settlement swirl, legal experts caution that the process is subject to the SEC's internal bureaucratic procedures and a formal vote is still required. Nevertheless, the prevailing belief is that the worst of the legal uncertainty is over. A final resolution, which many hope will come before the end of the year, would remove the primary obstacle to XRP's full-scale adoption in the United States and could pave the way for its relisting on major exchanges and inclusion in institutional products.
The Race for a Spot XRP ETF:
Following the landmark approvals of spot Bitcoin and Ethereum ETFs, the crypto market is buzzing with anticipation for what comes next. XRP is widely considered a prime candidate for its own spot ETF. Asset management giants like Grayscale, Bitwise, Franklin Templeton, and WisdomTree have already filed applications with the SEC.
The approval of a spot XRP ETF would be a watershed moment, providing a regulated, accessible, and insured investment vehicle for both retail and institutional investors in the U.S. to gain exposure to XRP. The launch of XRP futures-based ETFs has been seen as a positive precursor, following the same playbook that led to the spot Bitcoin ETF approvals. Market analysts and prediction markets have placed the odds of a spot XRP ETF approval in 2025 as high as 92-95%, contingent on a favorable resolution of the SEC lawsuit. Such an approval could unlock billions of dollars in institutional inflows, dramatically increasing demand and market legitimacy for the asset.
Core Utility in Global Payments:
At its heart, XRP was designed for utility. It serves as the native digital asset on the XRP Ledger, a decentralized blockchain engineered for speed and efficiency. Its primary use case is powering Ripple's payment solutions, which are now part of the broader Ripple Payments suite.
Ripple's network is designed to challenge the legacy correspondent banking system, exemplified by SWIFT, which can be slow and costly for cross-border payments. By using XRP as a bridge currency, financial institutions can settle international transactions in seconds for a fraction of a cent, without needing to pre-fund accounts in foreign currencies. This utility is not merely theoretical. Ripple has forged partnerships with over 300 financial institutions across more than 45 countries, with a significant portion utilizing XRP for liquidity. In 2024 alone, over $15 billion was transacted via Ripple's liquidity solutions, and the XRP Ledger is now processing over 2 million transactions daily. This growing, real-world adoption provides a fundamental demand for XRP that is independent of market speculation and forms the bedrock of its long-term value proposition.
________________________________________
Chapter 4: The Retirement Dream: Audacious Predictions and Future Outlook
The convergence of bullish technicals, strong fundamentals, and growing market optimism has led to a wave of bold price predictions from analysts. While highly speculative, these forecasts illustrate the immense potential that many see in XRP, fueling a narrative that significant holdings could lead to life-changing wealth.
Price targets for the current cycle vary widely, reflecting different models and timelines. Short-term targets frequently center around the $4 to $7 range, with some analysts suggesting a move to $9 or $15 is possible if momentum continues. One analyst, citing a rare bullish chart pattern, sees a potential 60% rally to around $4.47.
Looking further out, the predictions become even more audacious. Projections based on historical cycles and technical models, such as Elliott Wave theory, have put forth long-term targets of $16, $24, and even $27. Some AI-driven prediction models forecast that XRP could reach the $10-$20 range by the end of 2025, especially if an ETF is approved. Longer-term forecasts extending to 2030 suggest prices could potentially climb to between $19 and $48, depending on the level of global adoption.
These predictions have given rise to the "retire on XRP" dream among its community. For instance, if XRP were to reach one analyst firm's high-end forecast for 2030 of $32.60, an investment of 10,000 XRP could be worth over $326,000. While tantalizing, it is imperative for investors to approach such forecasts with extreme caution. The cryptocurrency market is notoriously volatile, and such high-reward potential is invariably accompanied by high risk. Regulatory setbacks, macroeconomic downturns, or a failure to achieve widespread adoption could all significantly impact XRP's future price.
Conclusion: A Confluence of Forces
XRP currently stands at one of the most fascinating junctures in its history. The digital asset is being propelled by a powerful confluence of forces: bullish technical patterns are signaling a potential breakout, on-chain data shows undeniable accumulation by its largest holders, and its fundamental value proposition is being strengthened by increasing regulatory clarity, the imminent possibility of a spot ETF, and steadily growing real-world utility.
The journey ahead is fraught with both immense opportunity and significant risk. A decisive break above its current resistance could unleash the momentum that analysts and investors have been anticipating for months. However, the market remains sensitive to legal news and broader macroeconomic trends. For now, XRP remains a bellwether asset, its story a microcosm of the broader struggle and promise of the digital asset industry—a high-stakes battle for legitimacy, adoption, and a permanent place in the future of finance
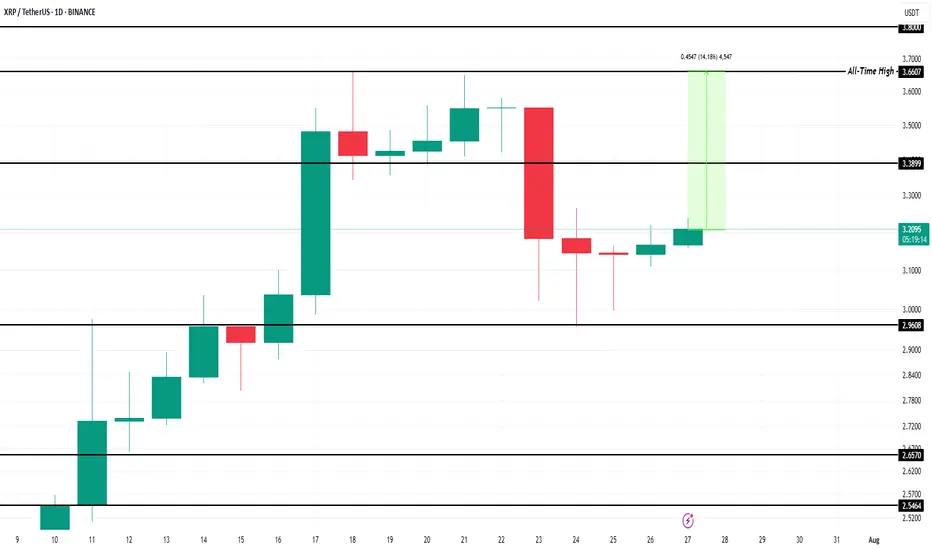
$500 Million XRP Accumulation To Drive 15% Price Rise to ATHBINANCE:XRPUSDT is currently trading at $3.20, which places it 14% away from reaching its ATH of $3.66. The support at $3.38 is crucial, and securing it could lead to further gains.
BINANCE:XRPUSDT has been seeing significant inflows in the past three days. Over 163 million XRP, worth around $519 million , have been accumulated by investors. This buying surge suggests that a wave of optimism is returning to the market, signaling that investors are positioning themselves for a potential price increase.
If BINANCE:XRPUSDT can reclaim support at $3.38 , it will be well-positioned to push past its ATH and reach new highs. This would mark a significant milestone for the altcoin, setting the stage for further price gains.
However, should the investor sentiment shift and selling pressure increase, BINANCE:XRPUSDT could face a decline. If the price falls below $3.00, it could slide to $2.96 or lower , invalidating the bullish thesis.
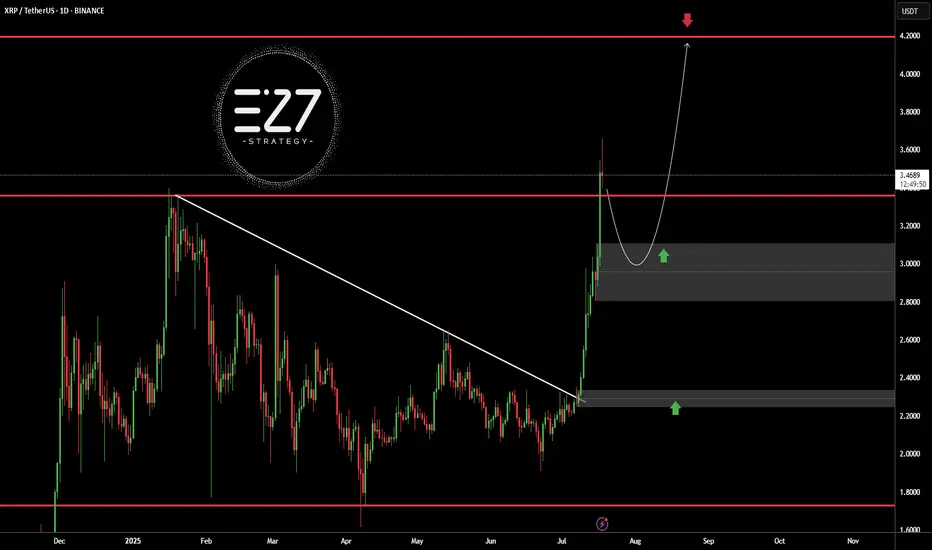
XRPUSDTBINANCE:XRPUSDT broke above its long-term downtrend line and surged to the $3.5000 resistance area, but is now undergoing a correction. The current bullish structure, with a higher high and higher low, suggests the trend remains upward. A pullback toward the $3.0000 demand zone is likely and would be a healthy retracement. Holding this area could trigger a continuation toward the key resistance at $4.2000.
Key Level Price
Main Support $2.2000
Main Resistance $4.2000
Best Buy Range $2.9500 – $3.1500
Best Sell Range $4.1000 – $4.2000
Investment Risk (Buying) Medium
⚠️Please control RISK management
XRP : Long term analysisHello friends🙌
🔊Considering the great growth that the price has had and has set a new ceiling, be careful because we are at the ceiling and when we are at the price ceiling, we should always expect a price correction...
⚠Now, given the strong upward trend we have, you can buy with risk and capital management, but our suggestion is lower prices for the possibility of a correction and the possibility of a reversal pattern.
So we have identified important support levels for you and we have also identified price targets.
🔥Follow us for more signals🔥
*Trade safely with us*
DeGRAM | XRPUSD rolls back to support📊 Technical Analysis
● After spiking to 3.56 (red dot) price slipped into a shallow bull-flag that is holding on the grey inner trend-line and the broken purple 2-year cap, converting 2.86-3.00 into firm support.
● Volatility compression inside the flag sits midway of the rising channel; a 16 h close back above 3.22 activates a 1:1 continuation toward the median-line cluster at 3.80, with the outer rail still pointing to 4.00.
💡 Fundamental Analysis
● CME’s launch of micro-XRP futures and fresh US exchange relistings lifted open-interest 18 % w/w, while Coinglass shows $12 M shorts liquidated since Monday—evidence of renewed upside pressure.
✨ Summary
Buy 3.05-3.22; breakout over 3.22 aims 3.80 → 4.00. Invalidate on a 16 h close below 2.86.
-------------------
Share your opinion in the comments and support the idea with a like. Thanks for your support!

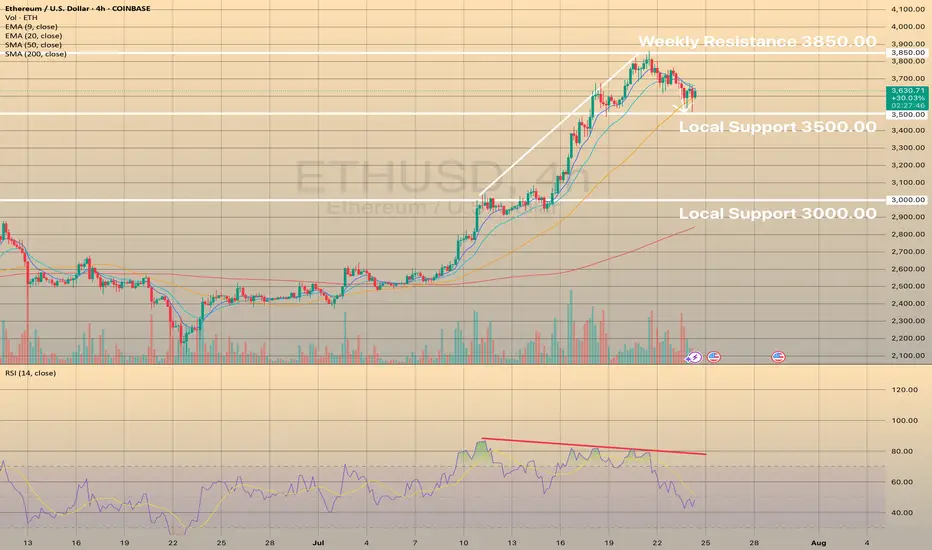
ETHUSD, XRPUSD - BEARISH DIVERGENCE SUCCESSFULLY WORKED OUT
ETHUSD, XRPUSD - BEARISH DIVERGENCE SUCCESSFULLY WORKED OUT
On these 2 graphs you may observe ethereum and ripple declining after strong bearish divergence showed up on both of these instruments. Here, the bearish divergence proved to be a success. In both cases the price has almost reached first targets: 3,500.00 for ETHUSD and 3.00000 for XRPUSD.
What will be next?
It looks like downwards correction still persists and we may observe some deeper than now decline with possible targets of 3,000.00 for the ETHUSD and 2.60000 for the XRPUSD.
XRP Price Reversal Likely After $2.81 Billion Selling In 7 DaysBINANCE:XRPUSDT is currently trading at $3.48, only 4% away from its all-time high . Over the past week, exchange wallets saw an influx of nearly 450 million XRP, valued at more than $2.81 billion . This spike in supply indicates that holders are moving their assets to sell, usually a bearish indicator in market cycles.
Despite the proximity, BINANCE:XRPUSDT price is showing signs of weakness and is clinging to the $3.38 support level . Without renewed buying interest, this support may not hold much longer.
If investor selling continues, BINANCE:XRPUSDT could fall through $3.38 and test the $3.00 support . A drop to this level would erase the recent gains and confirm a near-term bearish reversal. The loss of $3.00 could signal a longer consolidation phase or deeper correction.
However, if market participants absorb the sold supply and restore demand, BINANCE:XRPUSDT could rebound quickly . In this scenario, the altcoin might surpass $3.66, breach $3.80, and aim for $4.00 . Such a move would invalidate the bearish outlook and set a new all-time high.

XRP Eyes Explosive Growth: A Path to $10 and a 2025 "Euphoria PhThe cryptocurrency market is charged with renewed optimism, and much of the focus is now turning to established digital assets like XRP. After a prolonged period of consolidation, a powerful combination of bullish technical indicators, evolving market dynamics, and a compelling value proposition is fueling forecasts of a significant price surge. Market analysis now points to a potential future where XRP could trade in the $6 to $10 range, a move that hinges on Bitcoin achieving a landmark price of $144,000.
Adding to this momentum, detailed chart analysis suggests that XRP may be on the cusp of entering a "euphoria phase" between August and October of 2025, a window that could see unprecedented growth. As market leaders Bitcoin and Ethereum become increasingly expensive for the average investor, a strong argument is emerging that XRP currently offers a superior entry point, blending high potential with accessibility. This convergence of factors is positioning XRP as a token to watch, with many believing its next major bull run is not a matter of if, but when.
The Bitcoin Catalyst: Charting XRP's Trajectory to $10
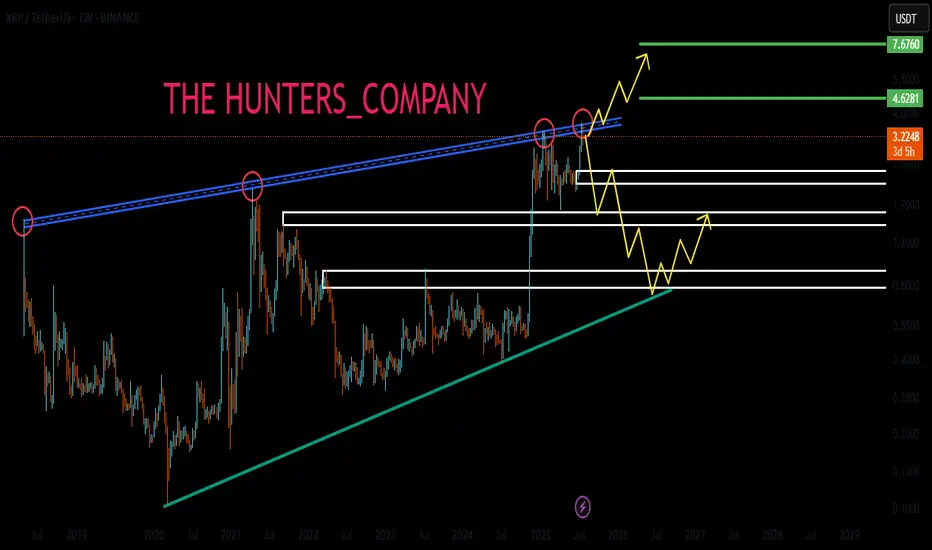
A significant component of XRP's bullish outlook is directly tied to the performance of Bitcoin. The relationship between the two assets, often measured by the XRP/BTC trading pair, is showing signs of a historic shift. Technical analysis of the XRP/BTC monthly chart reveals that its price is coiling tightly just below a critical resistance level. A definitive monthly close above this threshold would represent a major technical breakout, signaling a powerful reversal of its long-term trend against Bitcoin. Such a move would be the first of its kind since 2018 and could unleash substantial upward momentum.
Should this breakout on the XRP/BTC chart materialize, technical projections indicate an initial move toward a higher valuation, with a primary target zone identified. If this rally in the trading pair coincides with Bitcoin’s price climbing to the projected $144,000 level, the math translates to a U.S. dollar valuation for XRP of between $6 and $10. The timing for such a move is projected for late 2025, assuming Bitcoin’s own bull run accelerates as anticipated.
The XRP/USD chart independently supports this constructive outlook. A recent weekly close above a key price level has flipped several long-term indicators to a bullish stance, generating a classic breakout signal. Using standard technical projection models, such as Fibonacci extensions, price objectives for XRP now stand at approximately $4.53, $6.31, and even as high as $9.22. The journey to these targets, however, remains heavily dependent on the broader market strength led by Bitcoin. A stall in Bitcoin's advance would likely moderate the upside potential for XRP.
The "Euphoria Phase": Why Late 2025 Could Be Explosive
Beyond its relationship with Bitcoin, XRP's own price chart is signaling immense latent potential. After trading within a defined range for years, the token is now exhibiting powerful bullish signals on its weekly chart, suggesting a breakout from a multi-year consolidation pattern is underway.
Several key technical indicators are aligning to confirm the start of a new, sustained uptrend. A clear bullish crossover on the weekly Moving Average Convergence Divergence (MACD) indicator—a trusted measure of market momentum—has already occurred. At the same time, the Relative Strength Index (RSI) is climbing steadily but has yet to enter the overbought territory that has historically marked the peak of major cycles. This indicates that there is still significant room for price appreciation before the rally becomes exhausted.
A critical psychological and technical price level now stands at $5. A firm weekly close above this mark would be a monumental event, likely triggering a wave of intense buying pressure and shifting market sentiment from simple optimism into full-blown euphoria. If this breakout is confirmed, the next macro price targets are projected to be in the $8 to $11 range, levels consistent with the price action seen in XRP's previous parabolic advances. Based on historical cycle patterns and the current technical structure, this explosive phase could unfold between August and October of 2025.
The Value Proposition: Why XRP Stands Out in a High-Priced Market
As Bitcoin and Ethereum command prices that put them out of reach for many new participants, a psychological barrier to entry has formed. It is in this environment that XRP’s unique market position becomes a powerful advantage. The investment case for XRP is straightforward and highly attractive to first-time crypto buyers who may be experiencing "sticker shock" from the market leaders.
With its high market capitalization and global recognition, combined with a low per-unit price, XRP presents an appealing proposition. This dynamic, often referred to as "unit bias," makes investors feel they are getting better value by being able to purchase a larger quantity of tokens. This behavioral pattern has historically driven significant retail inflows into assets perceived as more affordable.
This appeal is not merely psychological. XRP is underpinned by a clear and functional use case: facilitating fast, low-cost cross-border payments. The XRP Ledger’s ability to settle international transactions in seconds for a fraction of a penny provides a fundamental strength that distinguishes it from purely speculative assets. This utility, aimed at disrupting the enormous traditional finance market, offers a layer of long-term credibility. The broad distribution of XRP across millions of digital wallets highlights its widespread accessibility and deep retail base, a demographic that could be instrumental in fueling its next major run.
A Prudent Perspective
Despite the compelling bullish case, it is essential to approach these forecasts with a clear understanding of the risks involved. The cryptocurrency market is defined by its volatility, and price targets are speculative projections, not guarantees. XRP's path is still influenced by external factors, most notably the ongoing regulatory landscape, which could have a significant impact on its future.
Furthermore, the most optimistic scenarios for XRP are heavily reliant on Bitcoin maintaining its powerful upward trajectory. Any weakness in the flagship cryptocurrency would undoubtedly impact the entire altcoin market, including XRP. While the technical and fundamental outlook appears increasingly bright, a disciplined and well-researched approach remains the cornerstone of navigating this exciting but unpredictable market.
