Feeling the waves (Ripple $XRP)Setup
The price has been consolidating since the explosive move from ~50c to $3 last year. There has been a wide $1 price range between $2 and $3. A failed breakdown below a still rising 30-week moving average and new 4-month high suggest underlying bullishness.
Signal
Should there be any follow-through to last week's big up-move, then any pullback to the golden pocket between the 50% and 61.8% Fibonacci retracement levels could trigger a rebound.
XRPUSDT

$XRP Macro Tiangle Final Thrust ContinuationCRYPTOCAP:XRP completed a macro triangle pattern last year. Triangles proceed a terminal motif wave which already completed a wave 3.
Wave (3) of (5) is underway with a terminal target around $5.7 after price broke out of the pennant / wedge pattern.
Weekly RSI confirmed bullish divergence.
Safe trading
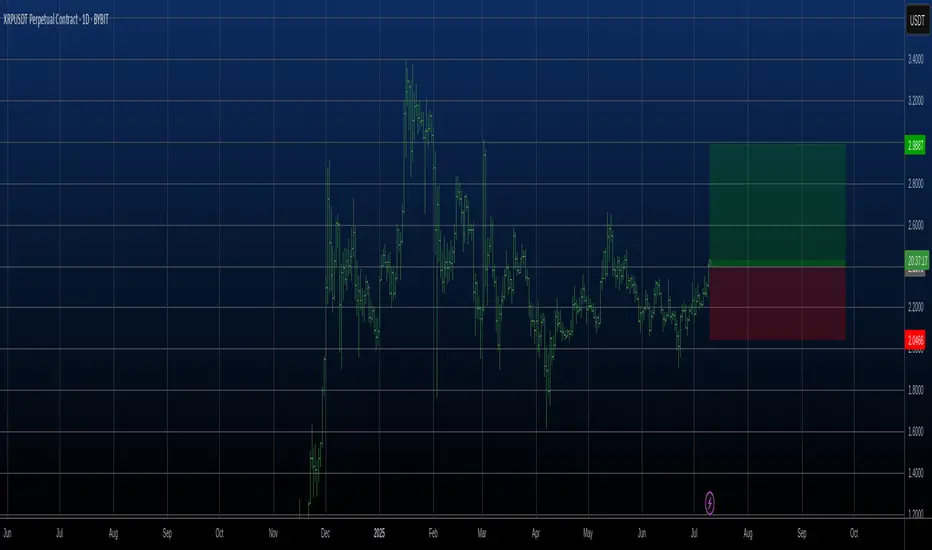
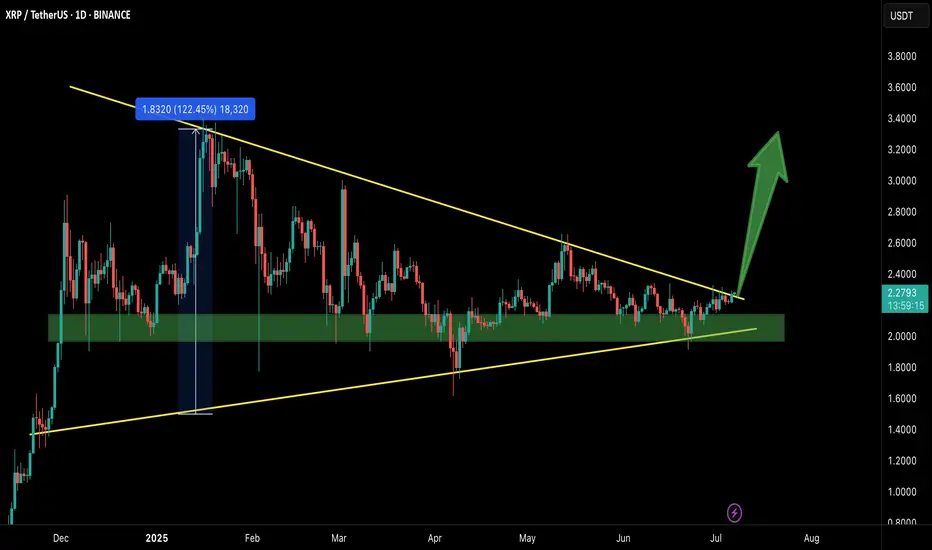
Good moment for try to Buy XRPGood moment for try to Buy XRP. We are in a sideways trend and are now approaching its upper border. We will take a breakout. Stop under the lower line of the channel. We'll see
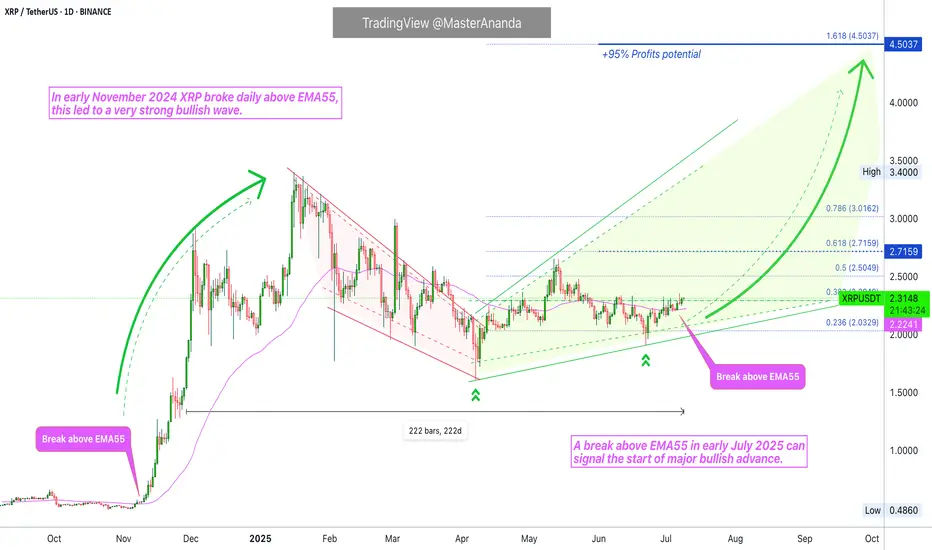
XRP Ready To Grow: $4.5 w/ 5X Lev = 475% Profits PotentialThe last time XRP moved above EMA55 daily was in early November 2024, you know pretty well what happened right after. Just a few days after EMA55 was conquered as resistance XRP grew from a price of $0.54 to a peak of $2.90 in less than one month. It continued to rise and peaked again but this time at $3.40. The market turns bullish above EMA55 and this same signal is active, valid, live today.
XRPUSDT has been fighting with EMA55, fluctuating around this level, since late April. Now, this resistance is no more. The bullish bias is fully confirmed after a decisive higher low. This is it... This is all we need, the next target is up.
» 95% is the easy target at $4.50. With 5X lev. we get 475%.
We've done this together many times before... This is not the last target but since this is a strong resistance we can wait for the retrace and enter again once support is found. That is, there will be a stop at this level.
This is a strong chart setup. The price is not the best ever, it would be better to enter lower and that is why we have only 5X. With a lower price we can do 7X, 8X and even up to 10X. Hardly ever I recommend more than 10X, it just isn't necessary and the risk is too high.
I am wishing you great profits and continued success.
This is a friendly reminder to let you know that XRP is ready to grow.
Thank you for reading.
Namaste.
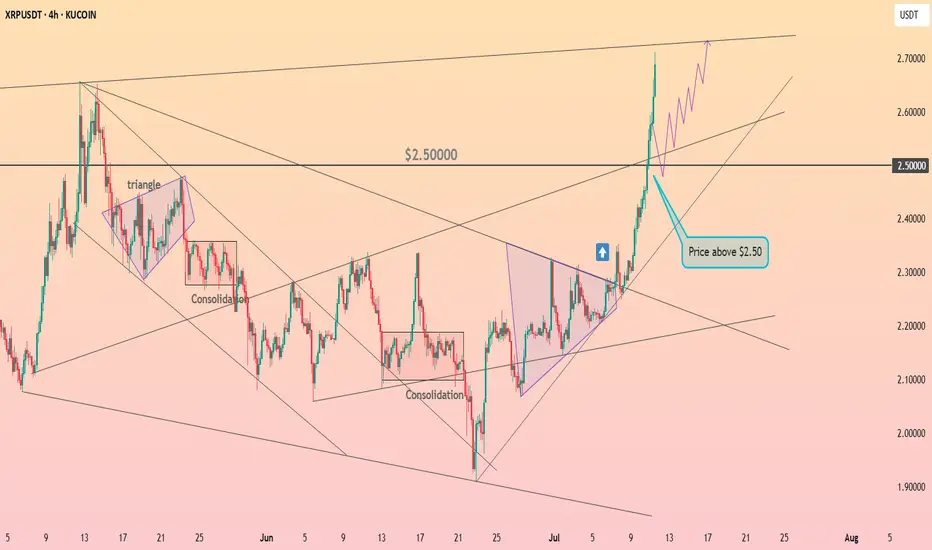
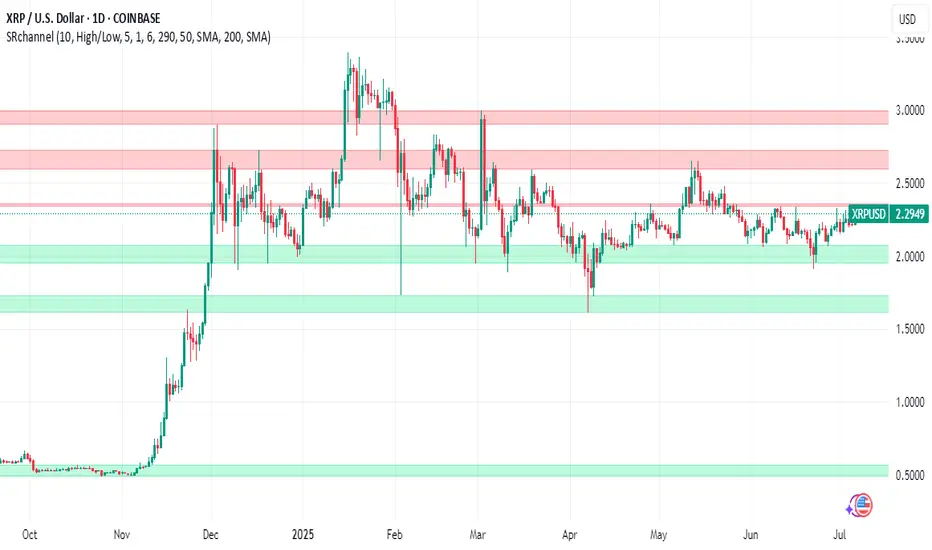
HolderStat┆XRPUSD above the $2.5KUCOIN:XRPUSDT has rallied sharply, breaking above the key $2.50 resistance following multiple consolidation and triangle patterns. Momentum remains strong, and price structure supports continuation toward the $2.75 resistance zone.
XRPUSDT Breaks Out of Bullish Flag - Big Moves Ahead!BINANCE:XRPUSDT has broken out of a classic bullish flag pattern on the weekly chart, signaling a strong continuation to the upside. This textbook setup is known for its high success rate, and the breakout suggests the potential for significant gains if momentum continues.
The CRYPTOCAP:XRP community remains strong, with long-term holders showing confidence and resilience. With the current market structure and support from loyal investors, there’s a real possibility for the price to double from this breakout zone.
The strategy is simple. Buy and hold for the long term. But as always, traders must manage risk carefully and use a proper stop loss. Let the flag fly high. CRYPTOCAP:XRP could be ready for a major pump from this level.
BINANCE:XRPUSDT Currently trading at $2.43
Buy level : Above $2.4
Stop loss : Below $1.9
Target : $5
Max leverage 3x
Always keep stop loss
Follow Our Tradingview Account for More Technical Analysis Updates, | Like, Share and Comment Your thoughts

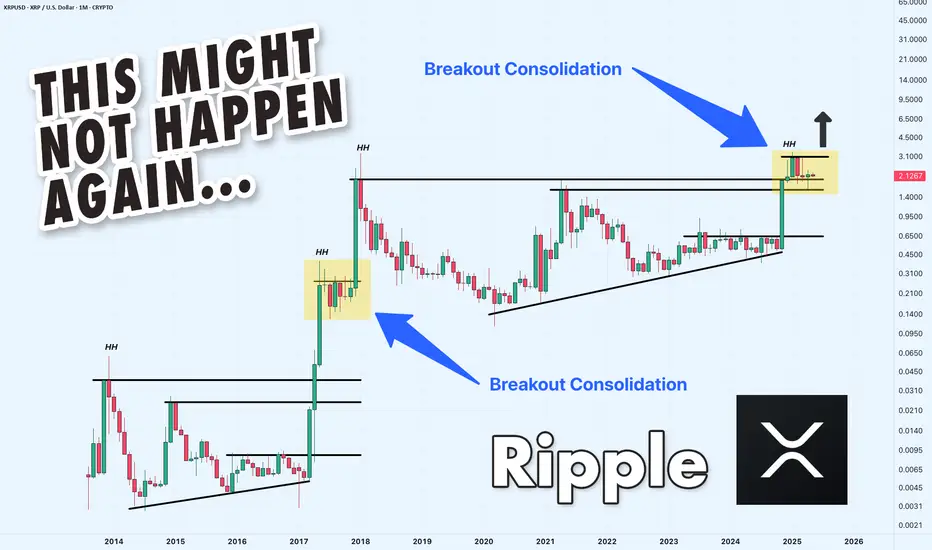
XRP/USDT Monthly Chart: History Repeating Itself?Hey traders! Let’s dive into this monthly XRP/USDT chart. I’ll be honest — I’m skeptical about this outcome, but let’s break it down because it could actually happen!
The chart screams déjà vu, with XRP’s price action mirroring the 2014-2018 period. Back then, XRP broke out from its 2014 ATH in 2017, leading to a massive rally. Fast forward to now, and we’re seeing a similar setup, but with a twist. XRP is struggling to break through the 2018 ATH resistance zone around $3.31, which reminds me of the Breakout Consolidation phase we saw in 2017. Historically, this consolidation led to a breakout, and the chart hints at a potential repeat!
If XRP breaks out soon, we could see a parabolic move, potentially targeting much higher levels. However, the current resistance is a tough hurdle, and if it fails, we might see a pullback to lower supports.
Key Levels to Watch:
Resistance: $3.31 (2018 ATH)
Support: $1.643 (previous consolidation low)
Breakout Target: To be determined (potentially parabolic)
Breakdown Risk: $0.650
I’m not fully convinced, but the setup is intriguing — could this be XRP’s moment to shine? What do you think? Let’s discuss below!
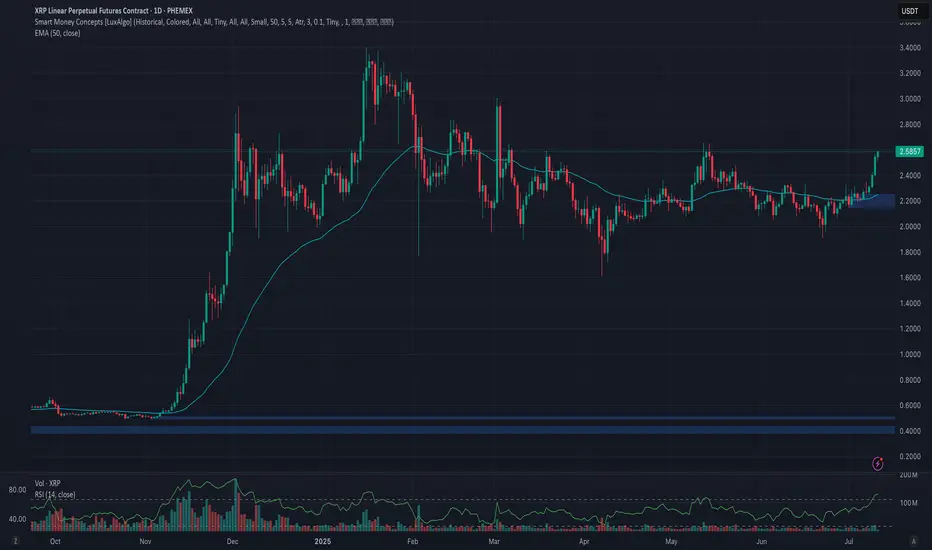
Phemex Analysis #96: Pro Tips for Trading Ripple (XRP)Since our previous analysis on XRP , Ripple’s native token [ PHEMEX:XRPUSDT.P ] successfully broke above the significant $2.45 resistance level, subsequently establishing a higher low around $1.90 on June 22nd. Encouragingly, XRP has surged 10% over the past two days, once again decisively breaking the $2.45 barrier, and is currently trading at around $2.57.
Given XRP’s recent bullish performance and evolving market dynamics, let's explore several potential scenarios that traders should closely monitor.
Possible Scenarios
1. Continued Bullish Momentum (Breakout Scenario)
If XRP maintains its current bullish strength, it’s likely to break above its recent high at $2.65. Such a breakout would signal strong buying interest and may push the price further toward the resistance zones at $2.96 and $3.12.
Pro Tips:
Entry Strategy: Consider entering or scaling positions upon confirmation of a breakout above $2.65, supported by increased trading volume.
Profit-Taking: Strategically take partial profits as XRP approaches the next resistance levels at $2.96 and especially $3.12 to secure gains effectively.
2. Rejected by Strong Resistance Levels (Pullback Scenario)
While the recent rally is promising, broader market conditions currently exhibit limited bullish momentum, indicating caution. XRP may face strong selling pressure at resistance levels like $3.12, leading to a potential price rejection.
In this scenario, XRP could retreat to establish a higher low above the important support at $2.15.
Pro Tips:
Buying Opportunities: Long-term investors might consider gradually accumulating positions if XRP forms a confirmed higher low above the critical support zone around $2.15.
Patience: Wait for clear stabilization signs at support before increasing positions, rather than rushing entries during active retracements.
3. Consolidation within Defined Range (Neutral Scenario)
XRP might enter a period of price consolidation, oscillating between support at $1.91 and resistance at $2.65. This scenario is common when market sentiment is uncertain or awaiting clearer directional cues.
Pro Tips:
Grid Trading Strategy: Utilize grid trading bots to profit systematically from predictable range-bound price movements. Initiate Long Grid bots near support at $1.91 and Short Grid bots near resistance around $2.65.
Stop-Loss: Always set clear stop-losses outside the consolidation range, ensuring protection against unexpected breakouts or breakdowns.
Conclusion
Ripple (XRP) currently offers compelling trade opportunities across different market scenarios. By closely monitoring bullish breakout signals above $2.65, potential pullbacks toward $2.15, and consolidation opportunities within $1.91–$2.65, traders can strategically position themselves to capitalize effectively while managing risks prudently. Always maintain a disciplined approach, pay close attention to broader market trends, and carefully execute trades based on well-defined scenarios.
🔥 Tips:
Armed Your Trading Arsenal with advanced tools like multiple watchlists, basket orders, and real-time strategy adjustments at Phemex. Our USDT-based scaled orders give you precise control over your risk, while iceberg orders provide stealthy execution.
Disclaimer: This is NOT financial or investment advice. Please conduct your own research (DYOR). Phemex is not responsible, directly or indirectly, for any damage or loss incurred or claimed to be caused by or in association with the use of or reliance on any content, goods, or services mentioned in this article.
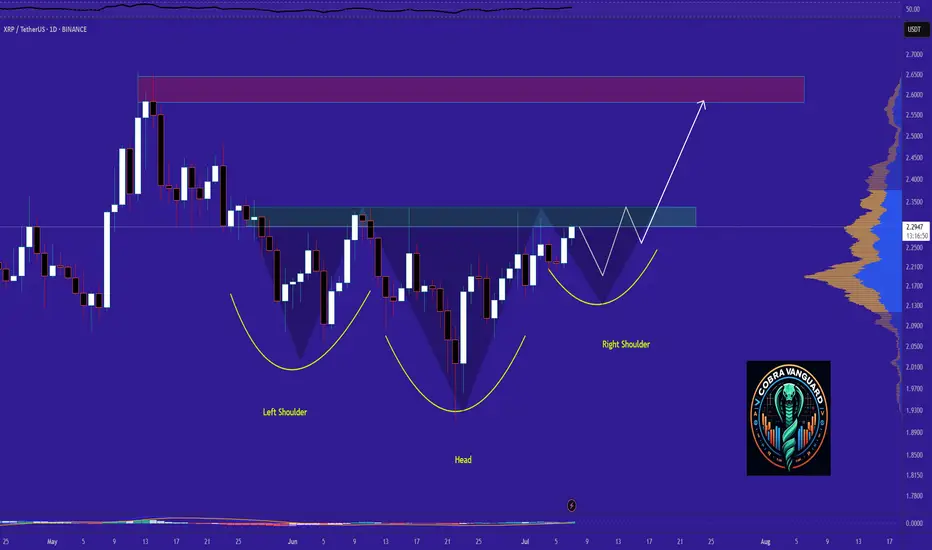
XRP - Time to buy again! (Update)It seems the price is forming a head and shoulders pattern, which, if correct, suggests a good price increase in the coming days. However, we should wait for the pattern to fully complete.
Best regards CobraVanguard.💚
XRP Technical Analysis – Massive Breakout in Play!After months of tight consolidation inside a symmetrical triangle, XRP/USDT has finally broken out with strong bullish momentum on the daily timeframe.
🔹 Chart Pattern: Symmetrical Triangle
🔹 Breakout Confirmation: Daily candle closed above the descending trendline resistance
🔹 Support Zone: ~$2.00 – $2.20 (Held multiple times since April)
🔹 Breakout Level: ~$2.48 – $2.50
🔹 Next Resistance Levels:
▫️ $2.62 – Minor horizontal resistance
▫️ $3.39 – Major resistance from previous highs
▫️ $4.92 – Long-term macro target (measured move from triangle)
🧠 Why does this breakout matter?
✅ Strong Volume: Breakout happened with increased volume – a sign of genuine breakout
✅ Multi-month Base: The longer the consolidation, the stronger the breakout
✅ Support Respect: XRP respected the demand zone repeatedly, showing accumulation
✅ Momentum Building: A clean break could trigger trend-following bots and new buyers

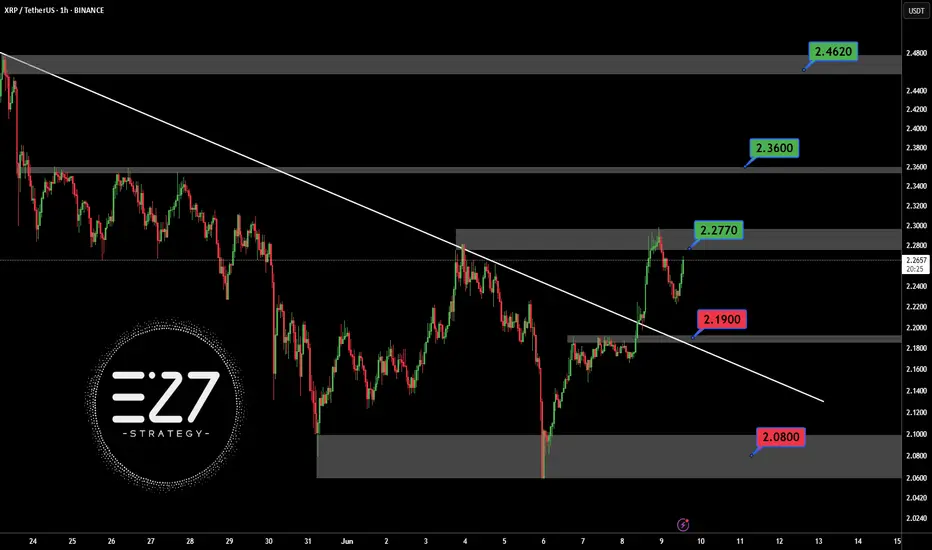
XRPUSDT BINANCE:XRPUSDT Price broke above the downtrend line but faced resistance at 2.2770 dollars and started correcting. Key supports are at 2.1900 and 2.0800 dollars. If it bounces, resistances to watch are 2.2770, 2.3600, and 2.4620 dollars. Price is currently between key levels.
Key Levels:
Support: 2.1900 – 2.0800
Resistance: 2.2770 – 2.3600 – 2.4620
⚠️Contorl Risk management for trades.
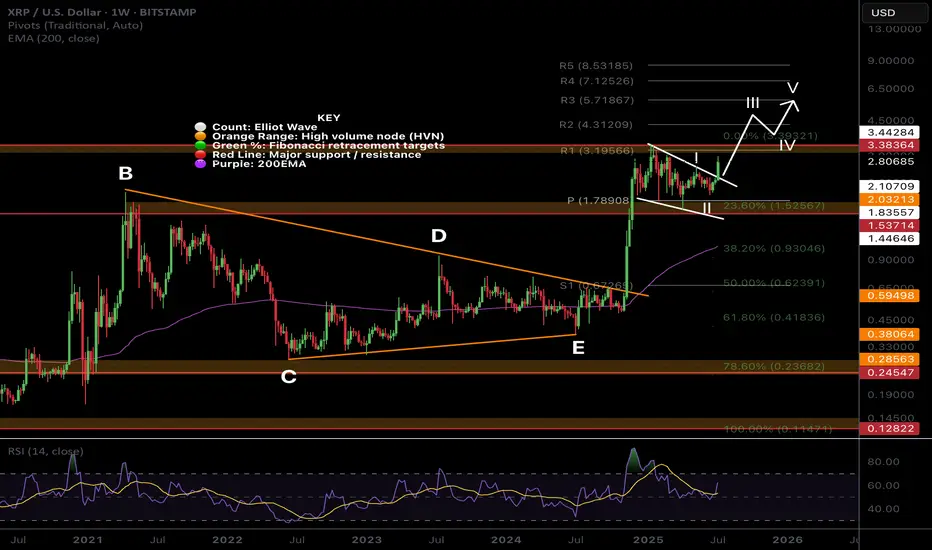
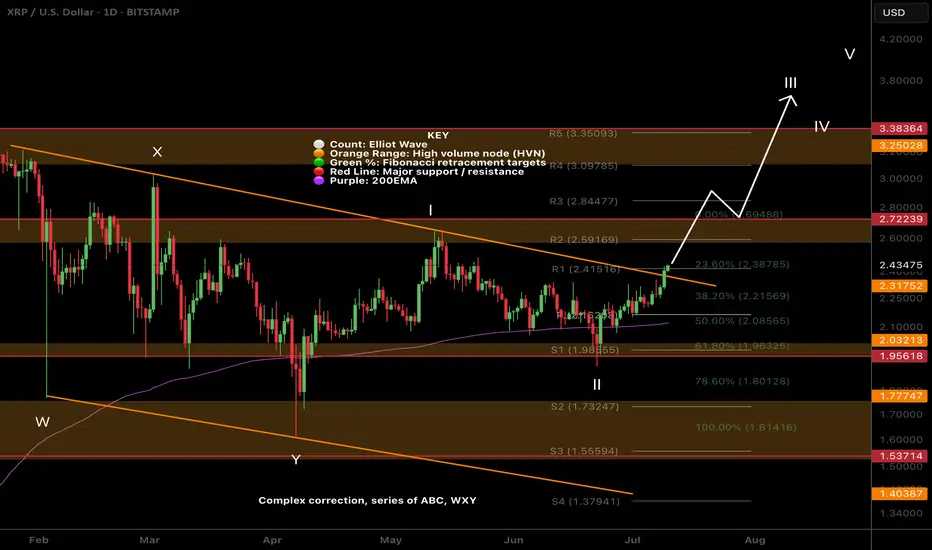
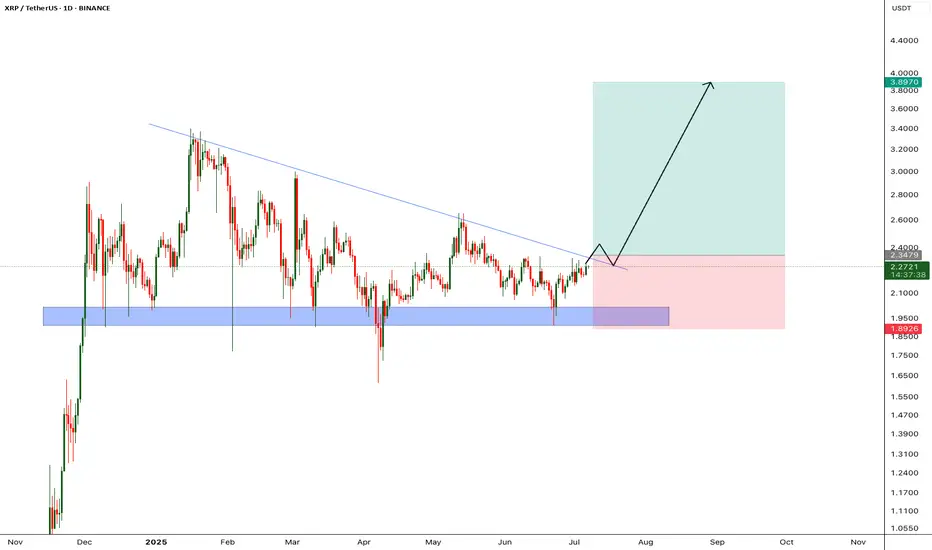
$XRP Bias Change: Bullish Elliot Wave CountCRYPTOCAP:XRP is breaking out the descending resistance causing me to take another look at my WXYXZ corrective Eliot Wave count expecting lower. I have adjusted the count to WXY and a 1-2 new motif wave with a target of $3.8
Price is well above the daily 200EMA and daily pivot after testing both as support including the High Volume Node. Closing above the descending resistance today will be a bullish signal but a retest of that resistance as support before continuing onwards its what to look out for.
Analysis is invalidated below $1.8
Safe Trading
#XRP Update #1 – July 8, 2025🟢 #XRP Update #1 – July 8, 2025
XRP has touched the lower edge of its 20-day ascending trendline and is currently holding above the 200 MA, a positive sign technically.
While there is a resistance zone above, it doesn’t appear too strong. Minor selling pressure might emerge around 2.35, but overall the setup looks promising.
▫️ Entry: 2.260
▫️ TP1: 2.320 (50%)
▫️ TP2: 2.390 (50%)
▫️ Stop: 2.235
▫️ RR Ratio: 5.15
❗️ With a tight stop (~1%) and a potential upside of 5.7%, this setup offers a favorable risk-reward opportunity. If it aligns with your capital and risk tolerance, it may be worth considering.

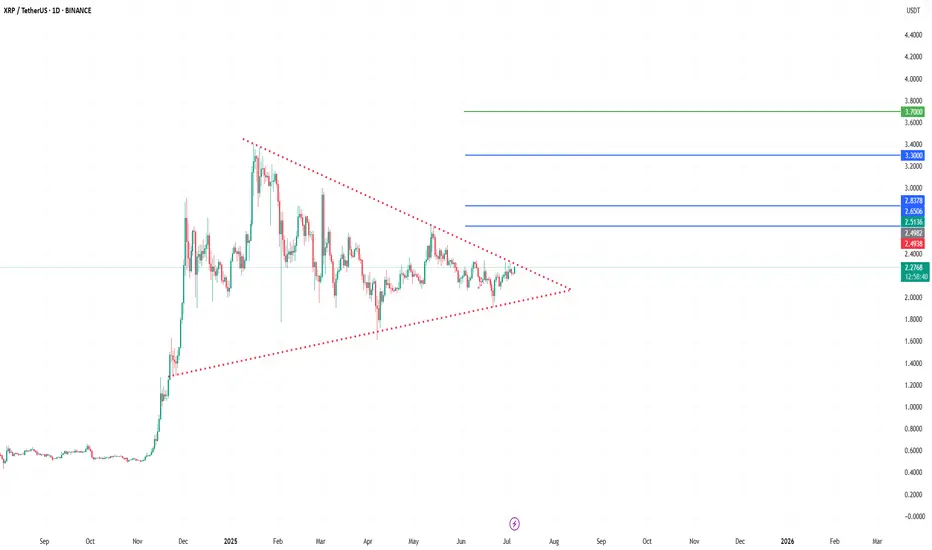
XRP/USDT| Targeting $3.3 to $3.7📝 Description:
XRP has been consolidating inside a large symmetrical triangle on the daily chart since early 2025. Price is now approaching the apex, suggesting a potential breakout move is near.
🔹 Upper trendline resistance: ~$2.49
🔹 Lower trendline support: ~$1.90
🔹 Breakout level to watch: $2.45–$2.50
✅ If a breakout is confirmed with strong volume, potential upside targets include:
🎯 $3.30 – mid-range target
🎯 $3.70 – full breakout objective
A spike in volume will be key to confirming the move. Until the breakout is validated, this setup remains neutral.
📌 This is not financial advice – please do your own research before making any trading decisions.
💬 What’s your target for XRP if this breaks out?
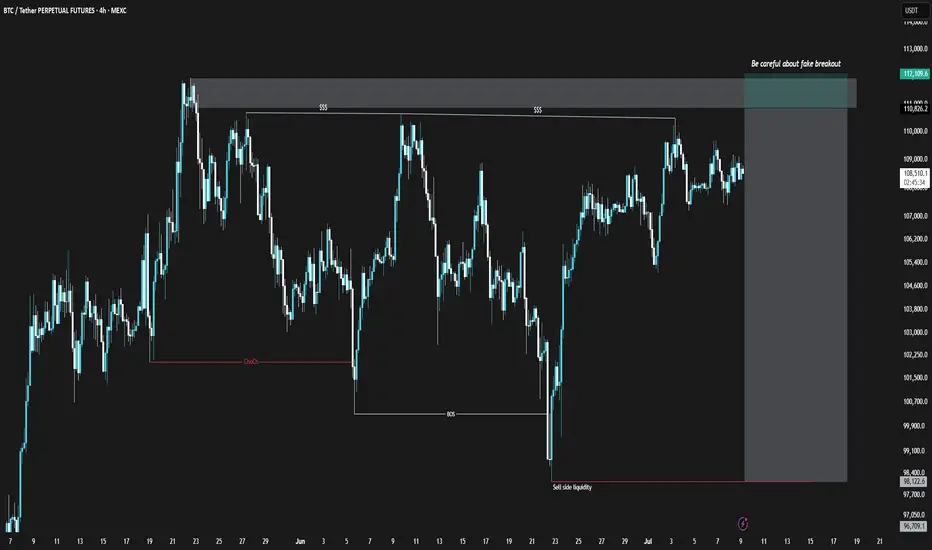
BTCUSDT Short Position (25/Jul/9)Bitcoin, similar to the TOTAL chart, is showing weakness in its bullish momentum. However, unlike TOTAL, the divergence in Bitcoin is clearly noticeable. Additionally, within the marked zone on the Bitcoin chart, there is a possibility of a fake breakout and liquidity grab. I suggest entering only with proper confirmation.
⚠️ This Analysis will be updated ...
👤 Sadegh Ahmadi: GPTradersHub
📅 2025.Jul.9
⚠️(DYOR)
❤️ If you apperciate my work , Please like and comment , It Keeps me motivated to do better
XRP COIN NEXT VIEW Good Day 🌞 Folks i hope all of you are earning well 🥰
Am Still holding my #Xrp🔥🔥 CRYPTOCAP:XRP my next week View on Xrp price soon will jump above $3 so am just holding as of now ❣️🙏🏻 let's see what's next ✌🏻 those who are holding will get great 😃 opportunity to succeed. In below 👇🏻 mentioned chart 📉 you can see my holding trade still waiting for another Rocket 🚀 #xrp

XRP - How they gonna know? They gonna know!Huuuhh XRP blind longs eh? But yeah you can but if i was I wouldn;t

XRP: A Trader's Gambit or an Investor's FortuneXRP at the Crossroads: A Trader's Gambit or an Investor's Fortune?
The digital asset XRP currently finds itself in a fascinating and precarious position, presenting a narrative so divided it could belong to two entirely different assets. For the short-term trader, the charts are painting a picture of tension and potential reversal, a technical puzzle where a wrong move could be costly. For the long-term investor, the horizon holds the promise of a revolutionary technology poised to disrupt a trillion-dollar industry, with price targets that seem almost unimaginable from today's standpoint. This analysis delves into this profound dichotomy, exploring the immediate bearish signals that tempt traders to short, while simultaneously mapping out the ambitious, utility-driven path that could lead XRP to astronomical new heights.
The Short-Term Squeeze: A Technical Tightrope Walk
Observing XRP's recent price action is like watching a high-stakes chess match. The token has demonstrated a textbook reaction to a critical trendline, a move that likely ensnared traders who were too quick to bet on a price collapse. By bouncing precisely where technical theory suggested it might, it "trapped" these early sellers, forcing them to reconsider their positions as the price stabilized and began to creep upward.
Following this maneuver, the price has embarked on a cautious ascent from the $2.20 support zone. As of early July, XRP has managed to climb above the $2.2320 mark and is holding its ground above the 100-hourly Simple Moving Average, both of which are constructive short-term signals. The immediate focus has now shifted to a key resistance level at $2.285. A decisive break above this ceiling could signal that the bulls have taken control, potentially triggering a new wave of buying pressure.
However, a significant hurdle lies in wait. On the hourly chart, a short-term contracting triangle has formed, with its upper boundary creating firm resistance at the $2.280 level. Such patterns are known to be harbingers of volatility; they represent a period of consolidation and coiling energy before the price makes a powerful move in one direction. While a breakout to the upside is possible, the bearish case remains equally compelling.
This bearish outlook is centered on a previously marked supply zone that the price is now approaching. A supply zone is an area on the chart where a glut of sell orders is historically clustered. If the price pushes into this zone without first building a stronger foundation of support by drawing in buying interest (grabbing liquidity) from lower levels, it risks hitting a brick wall. The selling pressure could overwhelm the buying momentum, leading to a swift and strong rejection. For traders anticipating this outcome, it presents a prime opportunity to initiate a short position, betting on a significant price decline. The level of $2.28 is therefore not just a resistance point; it's a critical battleground that will likely dictate the next major directional move.
The Long-Term Vision: The $35 Moonshot Fueled by Global Remittances
To truly understand the fervent belief held by long-term XRP holders, one must look beyond the flickering candles of the hourly charts and focus on the asset's fundamental purpose. The most powerful bullish argument for XRP is not based on technical patterns, but on its potential to fundamentally reshape the global remittance market.
The remittance industry—the process of individuals sending money across borders to their families—is a colossal and ever-growing sector of the global economy. Projections indicate that this market will swell from nearly $800 billion to over $1.06 trillion by 2029. For decades, this system has been notoriously inefficient, characterized by exorbitant fees that eat into the funds sent home and settlement times that can stretch for days, leaving families waiting for critical support.
This is the problem that Ripple, the technology company behind XRP, was designed to solve. By utilizing XRP as a neutral bridge asset, Ripple's payment network can facilitate cross-border transactions in a matter of seconds, not days. The cost of these transactions is a tiny fraction of what traditional banking intermediaries charge. This value proposition of speed and savings is not merely theoretical; Ripple has been actively forging partnerships to implement this technology in key remittance corridors, including those connecting to Mexico, the Philippines, Brazil, and nations in the Middle East.
The audacious price prediction of $35 per XRP stems from a model that quantifies this potential. The logic unfolds as follows: if XRP were to successfully capture a significant portion, say 25%, of the projected $1.06 trillion remittance market by 2029, the network's intrinsic value would be immense. Applying a valuation multiple similar to those of established payment processing giants, the network could be valued at over $500 billion. With a circulating supply of approximately 60 billion tokens, a simple calculation yields a fundamental value of around $8.90 per XRP.
However, the cryptocurrency market is driven by more than just underlying utility; it is heavily influenced by demand, speculation, and investor sentiment. The model accounts for this by applying a "demand premium." If widespread adoption and recognition of XRP's role create a surge in demand, this could act as a multiplier on its fundamental value. A 4x demand premium, a figure not uncommon during crypto bull markets, applied to the $8.90 base valuation, is what brings the target to an eye-watering $35.56. This forecast, while undeniably ambitious, is anchored in the tangible prospect of solving a multi-trillion-dollar real-world problem.
Bridging the Gap: Catalysts for a New Era
The journey from a price of around $2.22 to a potential $35 is long, and its success hinges on several critical factors. A major cloud that long hung over XRP was its legal battle in the United States, which created uncertainty and stifled institutional adoption. However, significant legal victories have provided much-needed regulatory clarity, affirming that XRP itself is not inherently a security. This has been a pivotal de-risking event, opening the doors for financial institutions to begin integrating and utilizing the asset with newfound confidence.
The next major potential catalyst on the horizon is the approval of a spot XRP Exchange-Traded Fund (ETF). Following the successful launch of ETFs for other major cryptocurrencies, many in the industry see an XRP ETF as a logical next step. Such a product would be a game-changer, providing a regulated and easily accessible bridge for a vast pool of capital from traditional finance to flow into the XRP market. It would allow pension funds, asset managers, and retail investors to gain exposure to XRP through their standard brokerage accounts, potentially triggering a massive wave of demand.
Of course, the path is not without its challenges. XRP operates in a competitive environment, with other blockchain projects and even modernizing traditional systems like SWIFT vying for a piece of the cross-border payments pie. Continued innovation, network growth, and the expansion of strategic partnerships will be paramount to securing its market position.
Conclusion: A Dichotomy of Destiny
In its current state, XRP embodies the dual nature of the cryptocurrency market. It is at once a playground for nimble traders, who see the immediate risks and rewards in its tight price consolidation, and a beacon for long-term visionaries, who see the blueprint for a future global financial standard. The bearish case for a short-term rejection from the $2.28 supply zone is technically sound and warrants caution. A failure to break through this level could easily send the price back down to retest lower supports.
Simultaneously, the long-term bullish thesis is one of the most compelling in the entire digital asset space. It is not built on hype alone, but on a clear and demonstrable utility aimed at a vast and inefficient market. The prospect of a $35 XRP is a testament to this potential.
Ultimately, the decision of whether to view XRP as a short-term trade or a long-term investment is a reflection of one's own timeline, risk tolerance, and belief in its underlying technology. XRP is at a critical inflection point, and whether it succumbs to short-term pressures or breaks free to pursue its grander ambitions will be a defining story in the continuing evolution of finance.
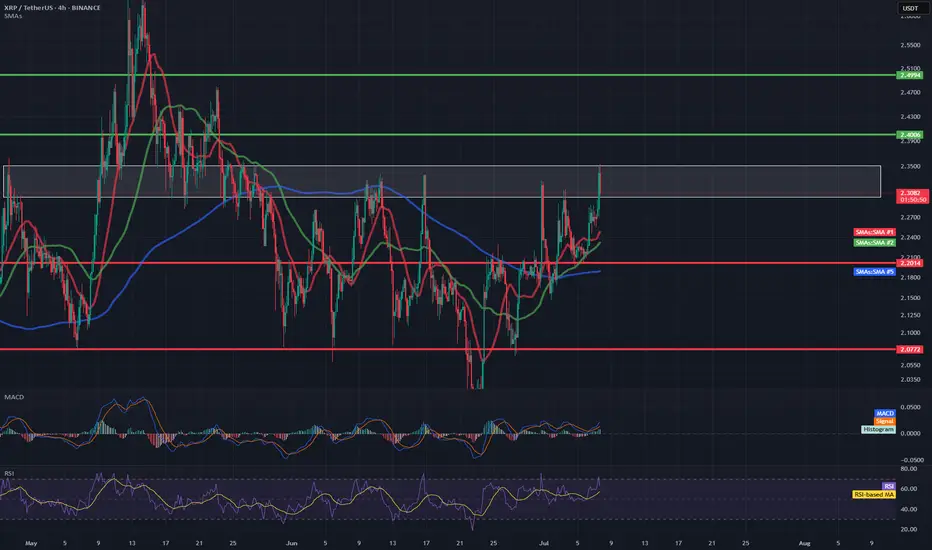
XRP/USDT 4H📊 1. Trend and moving averages
Red line (SMA 10) – short-term, currently rising, which suggests upward momentum.
Green line (SMA 20) – also in the upward trend and below the price – dynamic support.
Blue line (SMA 50/200) – probably SMA 50 or 200 – the price has broken through it from below and is currently above it – this is a pro-growth signal.
📌 Conclusion: In the short and medium term, a reversal of the trend to growth is visible.
📈 2. MACD (Moving Average Convergence Divergence)
The MACD line has crossed the signal line from below, which is a buy signal.
The MACD histogram is rising and is above zero – further confirmation of the upward trend.
📌 Conclusion: The upward momentum is increasing.
💪 3. RSI (Relative Strength Index)
RSI is currently at ~62, which means that:
We are still ahead of the overbought zone (70).
RSI is rising – it suggests bullish buyer pressure.
📌 Conclusion: There is still room for further growth before the market is overbought.
🔍 4. Market structure and resistance/support
The price is in the 2.30–2.35 USDT zone, which previously acted as resistance.
The closest resistance is around 2.38–2.40 USDT – the level from May, where the decline occurred.
The closest support is around 2.20 USDT (in line with the green SMA) and stronger at 2.05–2.10 USDT (earlier consolidations).
📌 Conclusion: Breaking 2.40 opens the way to a test of 2.50 and above.
🧠 Technical Summary
Aspect Rating
Trend (SMA) ✅ Up
MACD ✅ Buy
RSI ⚠️ Near overbought
Resistance/Support ⚠️ Resistance at 2.38–2.40
Movement Potential ✅ To 2.50 or higher
📌 Potential scenarios:
✅ Bullish (uptrend scenario)
A hold above 2.30 and a breakout of 2.40 could give an impulse for further gains towards 2.50–2.60.
Strong confirmation would be an increase in volume.
⚠️ Bearish (correction scenario)
A rejection from 2.38 and a drop below 2.20 could initiate a retest of support at 2.05 or even 1.95.
XRPUSDT Forming Bullish BreakoutXRPUSDT is showing an interesting setup with a bullish breakout potential that could fuel gains of 60% to 70% or more in the coming weeks and months. The recent price action suggests that XRP is breaking out of a long-standing consolidation pattern, with price pushing above a descending trendline and holding well above key support levels. This breakout is attracting both retail traders and big investors who see Ripple’s strong fundamentals and unique use case in the cross-border payment sector as major catalysts for its long-term growth.
The trading volume has remained healthy, signaling strong market participation and increasing confidence that XRP’s next move could be substantial. If momentum continues, traders can expect a potential rally towards major resistance zones, with increased interest from whales likely to accelerate the bullish scenario. Market sentiment around XRP has also improved thanks to positive developments in its legal battles and expanding partnerships, which add further conviction for investors.
XRP’s performance has historically shown that when it moves, it often does so aggressively, rewarding patient holders and active traders alike. This pattern aligns well with broader altcoin market cycles, where XRP tends to outperform during bullish phases. As always, it’s essential to monitor price action around key levels, adjust stop-losses wisely, and stay updated with market news to make the most of this potential run.
✅ Show your support by hitting the like button and
✅ Leaving a comment below! (What is You opinion about this Coin)
Your feedback and engagement keep me inspired to share more insightful market analysis with you!

XRP/USDT – Breakout Confirmed!Hey Traders — if you're into high-conviction setups with real momentum, this one’s for you.
XRP has finally broken out from the massive symmetrical triangle on the 1D timeframe after holding the green support zone like a champ.
This structure has been compressing for months, and with this breakout, momentum could be shifting in favor of the bulls.
Entry: Current Market Price (CMP)
Add More: On dips above $2.20
Targets: $2.60 / $2.95 / $3.40 / $3.80
Stop Loss: $2.05
Leverage: 5x–10x
As long as price stays above the breakout zone, this setup holds strong potential. Keep a close eye for volume confirmation and follow-through.
Let’s see how this plays out. Will update as it unfolds.
XRP - Huge breakout incomingXRP price is retesting it's descending trendline, in the past price got rejected from this trendline multple times, however im expecting price to breakout from this trendline since we almost at the last 2 quarters of bull run.
We will enter the trade after candle closes above the trendline
Entry Price: 2.34
StopLoss: 1.89
TP1: 2.5981
TP2: 2.8543
TP3: 3.2796
TP4: 3.8676
Like and follow.
Cheers
GreenCrypto
#XRP/USDT#XRP
The price is moving within a descending channel on the 1-hour frame, adhering well to it, and is heading towards a strong breakout and retest.
We are experiencing a rebound from the lower boundary of the descending channel, which is support at 2.11.
We are experiencing a downtrend on the RSI indicator that is about to be broken and retested, supporting the upward trend.
We are looking for stability above the 100 Moving Average.
Entry price: 2.16
First target: 2.20
Second target: 2.24
Third target: 2.28
