The Great XRP Escape Plan: Thief Strategy Deployed🌀 XRP/USDT – Thief Trader’s Master Heist Plan: Crack the Vault Before They Catch On! 🧠💰
🔐💸 Operation Code: Ripple Raid 3.9 - Eyes on the Prize, Hands on the Trigger 💥
🌍 Attention Global Market Robbers and Strategic Money Movers!
This ain't just another analysis—this is the Thief Trading Style Blueprint, surgically designed for the XRP/USDT Crypto Market. Whether you're a silent sniper or full-squad raider, this trade setup is your next high-voltage money heist.
🔍 Market Breakdown:
📊 Technical + Fundamental = Robbery Precision
Currently, Ripple (XRP) is showing bullish fuel—charging into our trap-the-bears zone. Volatility is tightening, resistance is trembling, and it smells like liquidity is about to get stolen.
⚠️ Warning: The market’s at a risky cross-zone – overbought with heavy consolidation – where big bears and trapped traders usually play defense. That’s exactly where we strike.
🔓 Entry Gameplan – “Wait, Trigger, Execute”
📈 Entry:
"The heist begins when the candle breaks the high and screams confirmation!"
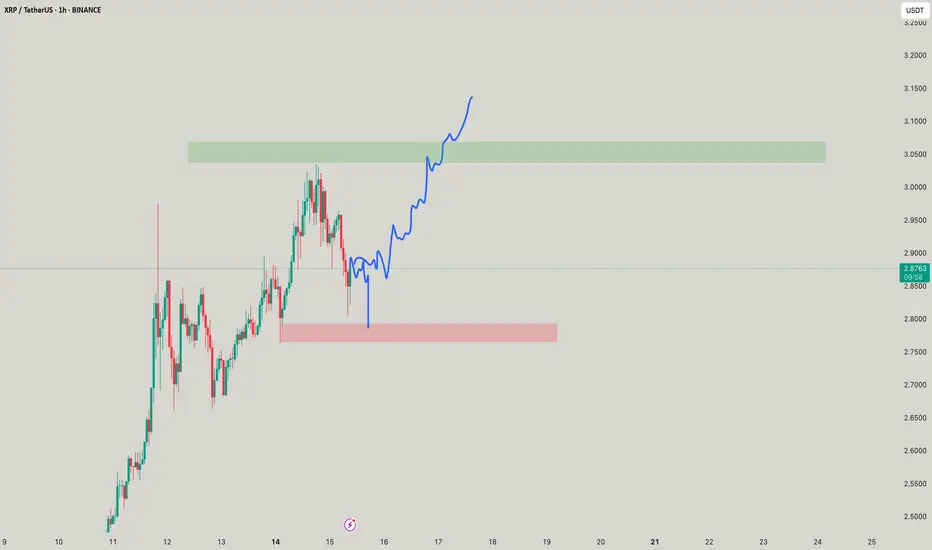
Set Buy Stop Orders above the recent resistance (around 3.1000).
Alternatively, use Buy Limit Orders on pullbacks at key swing levels (15M or 30M timeframes).
We use a multi-layered entry strategy (aka DCA + stacking like a pro thief stacking vaults). Be surgical. Be patient.
📌 Pro Tip: Always set a chart alert at the trigger zone to avoid missing the breakout party.
🛑 Stop Loss – “Breakout First, Then Talk Safety”
🚫 NO SL BEFORE BREAKOUT. Period.
Once price breaks out, then:
🔐 SL = Nearest 4H candle wick swing low (around 2.8000).
But remember, your SL = your risk appetite.
Whether you're placing 1 big order or 10 mini traps, manage it smart.
🎯 Target – "Get Rich, Then Vanish"
🏴☠️ Primary Take Profit Zone:
Target: 3.9000
Or exit anytime you see signs of reversal.
Don't get greedy—get paid.
👀 Scalpers’ Note:
Only play the Long side.
If you're deep-pocketed, dive in straight. If not, ride with swing traders and trail your SL to protect profits.
🔥 Why This Trade is 🔐:
📈 Current price structure, liquidity zones, and momentum favor bulls.
📊 Correlated intermarket signals + on-chain activity + macro backdrop align with XRP strength.
🧠 Smart money accumulation is visible – this is your window before the big breakout.
🚨 News & Position Management Alert:
📢 Stay clear of opening trades during major news events.
Use Trailing Stop-Loss on running positions to lock gains while letting profits fly.
This is not hype. This is precision.
Thief Trader doesn’t guess – we plan, we trigger, we exit.
📌 Final Words:
Whether you're scalping seconds or swinging for days – follow the blueprint. XRP has a vault to crack, and we’re here to rob it clean.
Now go out there, set those traps, and let the market pay you like it owes you.
🧠💸🕶️ Next Heist Plan Coming Soon… Stay Sharp.
Xrpusdtlong

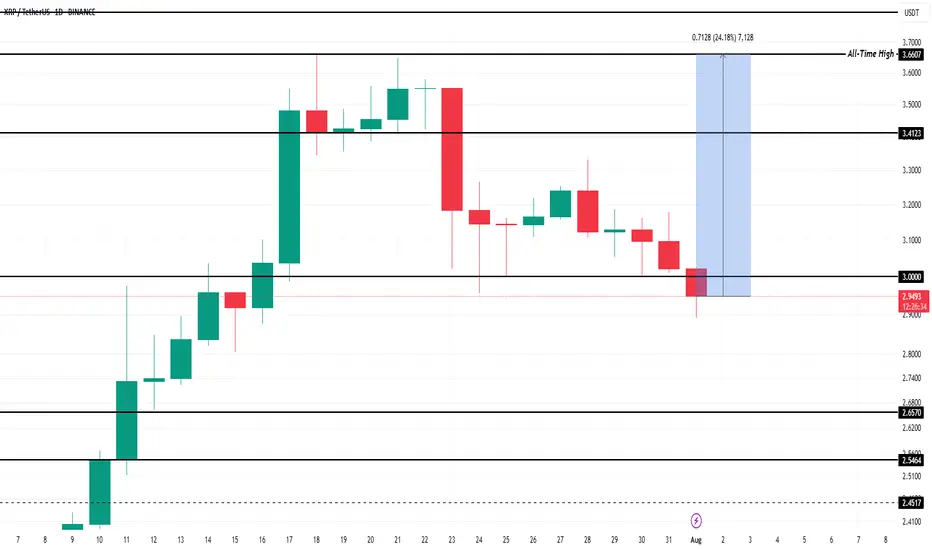
What To Expect From XRP In August 2025?Currently, BINANCE:XRPUSDT is trading at $2.99, slipping through the key support level of $3.00. While the altcoin is still over 22% away from its ATH of $3.66 , the foundation for potential growth remains strong. Historical data has shown that August typically brings bearish momentum for BINANCE:XRPUSDT , with median monthly returns of -6% .
However, given the strong buying activity observed recently and the positive technical indicators, this August might defy the usual trend. If BINANCE:XRPUSDT manages to secure support above $3.41, the altcoin could push towards its ATH once again . Alexis Sirkia, Captain at Yellow Network, discussed with BeInCrypto how XRP’s future could be looking like.
“Institutions that have been in the market for a while are gaining momentum. We're also, in the meanwhile, in a macro environment where funds are doing risk rotation… BINANCE:XRPUSDT is taking its stand with regulation and infrastructure, not hype. That's what will endure in the long run. Short-term flows are fleeting, but the groundwork laid today will define the cycle to follow.”
However, there’s a downside risk. If BINANCE:XRPUSDT fails to reclaim the $3.00 support, the price could fall to $2.65, invalidating the bullish thesis. A drop to this level would mark a four-week low and would likely lead to further selling pressure.
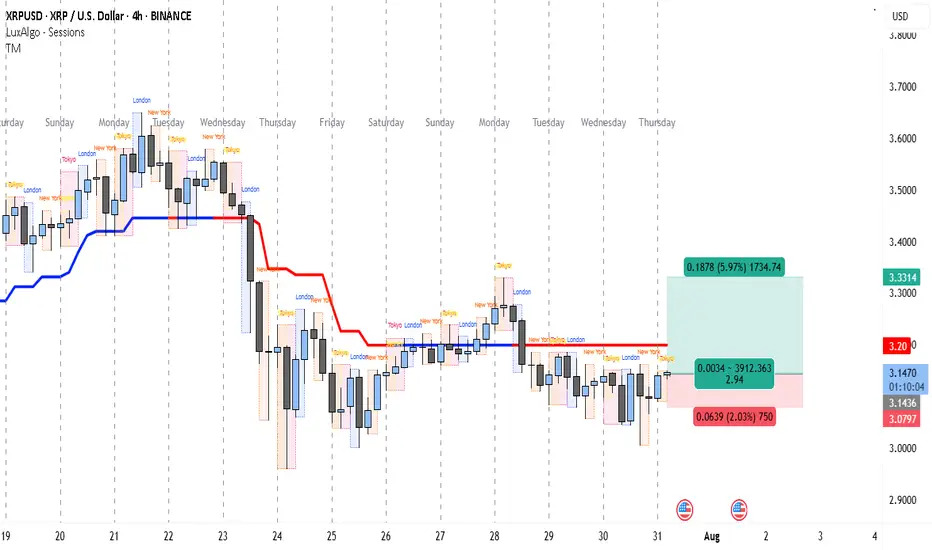
XRP’s 1:3 R:R Setup Could Pay Off FastThe 4-hour chart for XRP/USD indicates a market that has been under selling pressure since the sharp drop around July 23rd, where price broke down from the 3.40+ range. Since then, XRP has been struggling to reclaim higher levels, with the red trend indicator line (likely a moving average or trend-follow tool) acting as a persistent dynamic resistance.
After bottoming near the 3.05 zone on July 25th, the price moved into a sideways consolidation, repeatedly testing both the lower range (around 3.08) and upper range (around 3.20). This tight range suggests accumulation or distribution ahead of a bigger move.
Currently, the chart shows a potential long setup triggered around 3.1450, with a stop loss just below 3.0797 and a take profit target at 3.3314. This setup aims to capture a breakout from the consolidation zone toward the previous resistance area just below 3.35. The risk-to-reward ratio is favorable (close to 1:3), making it an attractive trade for short-term swing traders.
The target level aligns with the price area before the breakdown on July 23rd, where sellers previously gained control. Breaking through that level could signal a short-term trend reversal. However, the price still needs to clear the 3.20 resistance with a strong candle close to confirm bullish momentum.
Trade Setup
• Entry: 3.1450 (current level, inside consolidation support)
• Stop Loss: 3.0797 (below recent swing low)
• Take Profit: 3.3314 (prior resistance zone)
• Risk-to-Reward Ratio: ~1:2.94
• Trade Bias: Short-term long aiming for breakout from consolidation
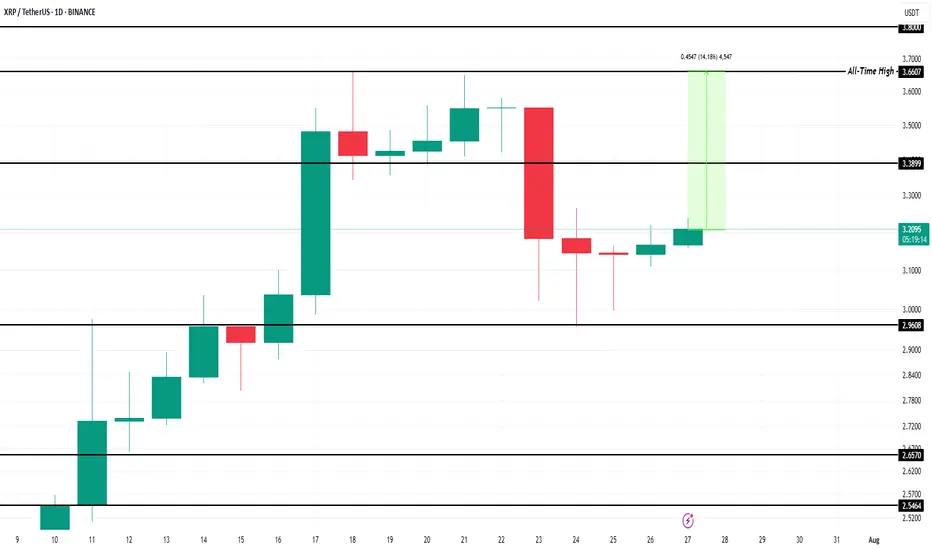
$500 Million XRP Accumulation To Drive 15% Price Rise to ATHBINANCE:XRPUSDT is currently trading at $3.20, which places it 14% away from reaching its ATH of $3.66. The support at $3.38 is crucial, and securing it could lead to further gains.
BINANCE:XRPUSDT has been seeing significant inflows in the past three days. Over 163 million XRP, worth around $519 million , have been accumulated by investors. This buying surge suggests that a wave of optimism is returning to the market, signaling that investors are positioning themselves for a potential price increase.
If BINANCE:XRPUSDT can reclaim support at $3.38 , it will be well-positioned to push past its ATH and reach new highs. This would mark a significant milestone for the altcoin, setting the stage for further price gains.
However, should the investor sentiment shift and selling pressure increase, BINANCE:XRPUSDT could face a decline. If the price falls below $3.00, it could slide to $2.96 or lower , invalidating the bullish thesis.
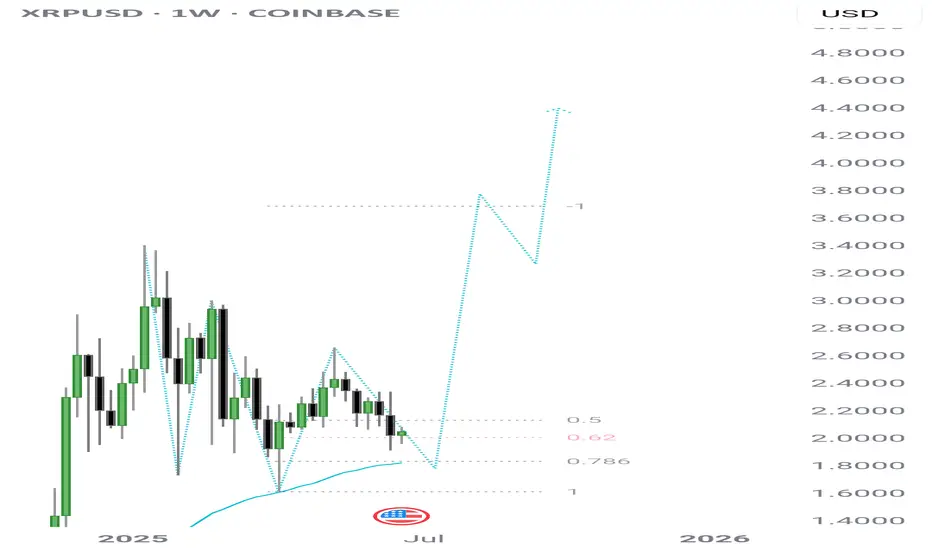
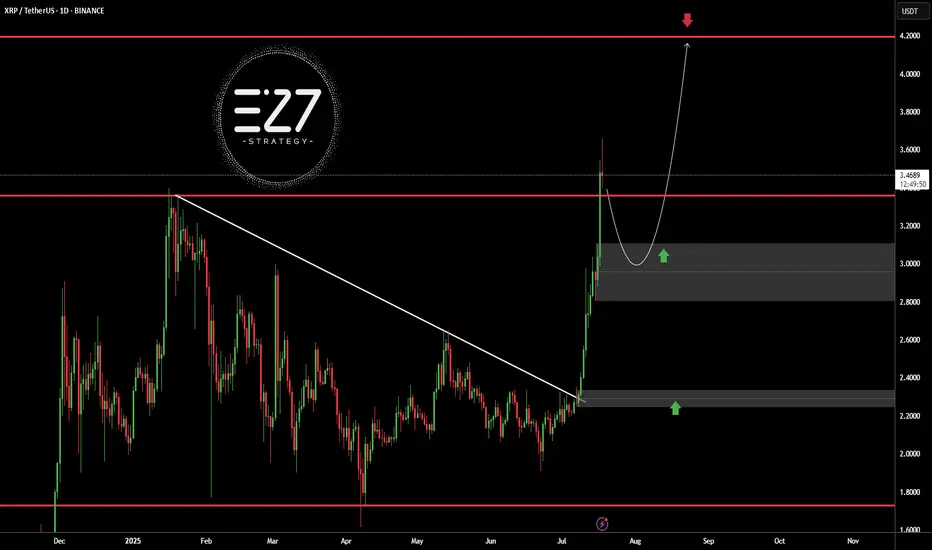
XRPUSDTBINANCE:XRPUSDT broke above its long-term downtrend line and surged to the $3.5000 resistance area, but is now undergoing a correction. The current bullish structure, with a higher high and higher low, suggests the trend remains upward. A pullback toward the $3.0000 demand zone is likely and would be a healthy retracement. Holding this area could trigger a continuation toward the key resistance at $4.2000.
Key Level Price
Main Support $2.2000
Main Resistance $4.2000
Best Buy Range $2.9500 – $3.1500
Best Sell Range $4.1000 – $4.2000
Investment Risk (Buying) Medium
⚠️Please control RISK management
XRP ~ Is this a best trade to take?XRP ~ This beauty is best to be buys at the red nd aim for the greeens!

XRP : Long term analysisHello friends🙌
🔊Considering the great growth that the price has had and has set a new ceiling, be careful because we are at the ceiling and when we are at the price ceiling, we should always expect a price correction...
⚠Now, given the strong upward trend we have, you can buy with risk and capital management, but our suggestion is lower prices for the possibility of a correction and the possibility of a reversal pattern.
So we have identified important support levels for you and we have also identified price targets.
🔥Follow us for more signals🔥
*Trade safely with us*
XRP Price Reversal Likely After $2.81 Billion Selling In 7 DaysBINANCE:XRPUSDT is currently trading at $3.48, only 4% away from its all-time high . Over the past week, exchange wallets saw an influx of nearly 450 million XRP, valued at more than $2.81 billion . This spike in supply indicates that holders are moving their assets to sell, usually a bearish indicator in market cycles.
Despite the proximity, BINANCE:XRPUSDT price is showing signs of weakness and is clinging to the $3.38 support level . Without renewed buying interest, this support may not hold much longer.
If investor selling continues, BINANCE:XRPUSDT could fall through $3.38 and test the $3.00 support . A drop to this level would erase the recent gains and confirm a near-term bearish reversal. The loss of $3.00 could signal a longer consolidation phase or deeper correction.
However, if market participants absorb the sold supply and restore demand, BINANCE:XRPUSDT could rebound quickly . In this scenario, the altcoin might surpass $3.66, breach $3.80, and aim for $4.00 . Such a move would invalidate the bearish outlook and set a new all-time high.

XRP - Probable Trade!!! Very Yet!This trade is very probable and very to your extend beyond your imagination! Wait and watch!

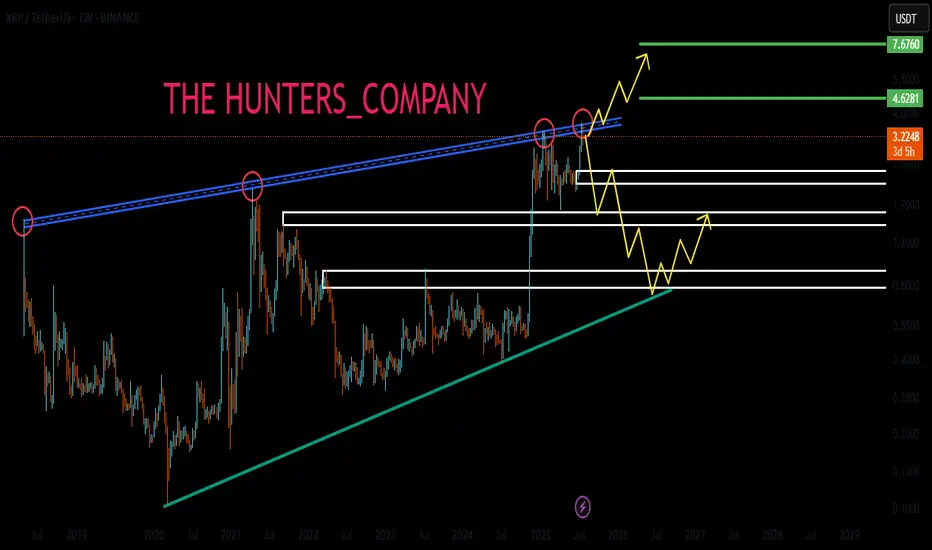
$XRPUSDT LONG TERM SETUP for SPOT !!CRYPTOCAP:XRP has officially broken out of its long-standing descending channel on the daily timeframe.
This is a major structure breakout and opens the door for a big move, but patience is key. Wait for a clean retest before entering the trade.
Trade Setup:
Entry (Ideal Retest Zone): $2.53 – $2.75
Stop Loss: Below $2.38
Resistance/Support Zones:
Immediate Support: $2.53
Resistance Levels: $4.29 / $7.53 / $11.98 / $18.00
Targets (Long-Term):
TP1: $4.29
TP2: $7.53
TP3: $11.98
TP4: $18.00
Potential Profit: Over 500%+ if it plays out fully
This is a long-term breakout structure — don’t rush. Wait for confirmation on the pullback.
DYOR | Not Financial Advice
Setupsfx_ | XRPUSDT: Time For Strong Bullish Price Distribution!As previously described, the price bullish reversal did exactly that. The price has moved nicely, and this may be just the beginning of a bigger move. Long-term, we believe XRP will hit a record high, possibly even surpassing $4.
Please use accurate risk management while trading XRP.
Good luck and trade safely!
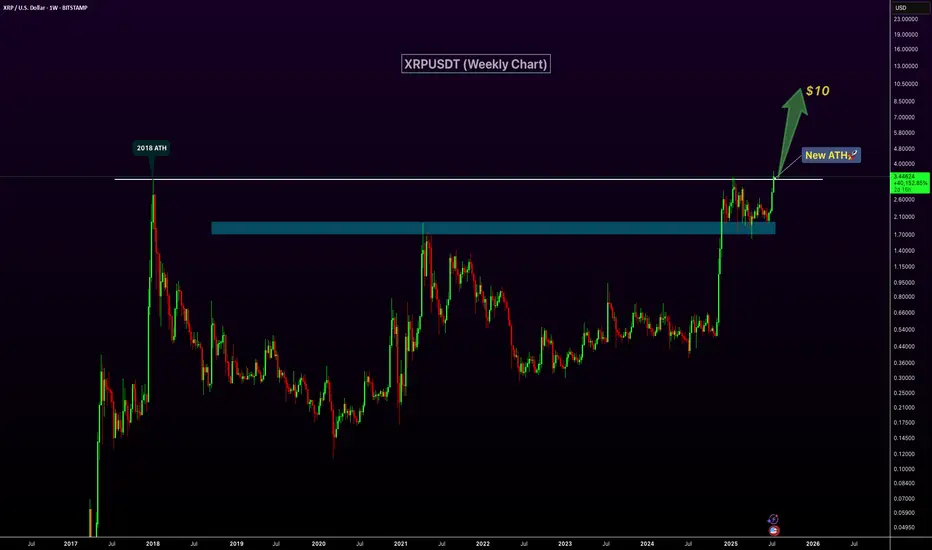
XRP Breaks 2018 High – New ATH Confirmed!XRP has officially broken above its 2018 peak, signaling a major bullish breakout and printing a new all-time high on the weekly chart. The previous resistance zone around $2.6–$3 has now flipped into strong support, confirming the strength of this move. With increasing volume and momentum behind the rally, XRP appears well-positioned for continued upside. The next key psychological target lies at $10, and current price action suggests a clear path toward that level. If bullish sentiment continues, this breakout could mark the beginning of a significant new uptrend.
Make WAYYYY for !!! ~~ XRPPP!! ~$3.1?XRP as suggests moves if it doesnt breaks the red box or just pukes below, eitherways looks strong enough
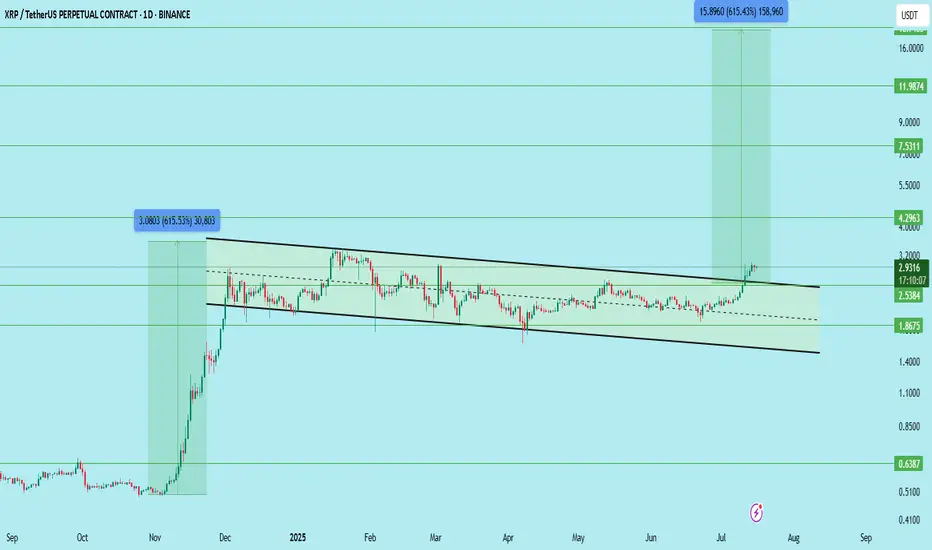
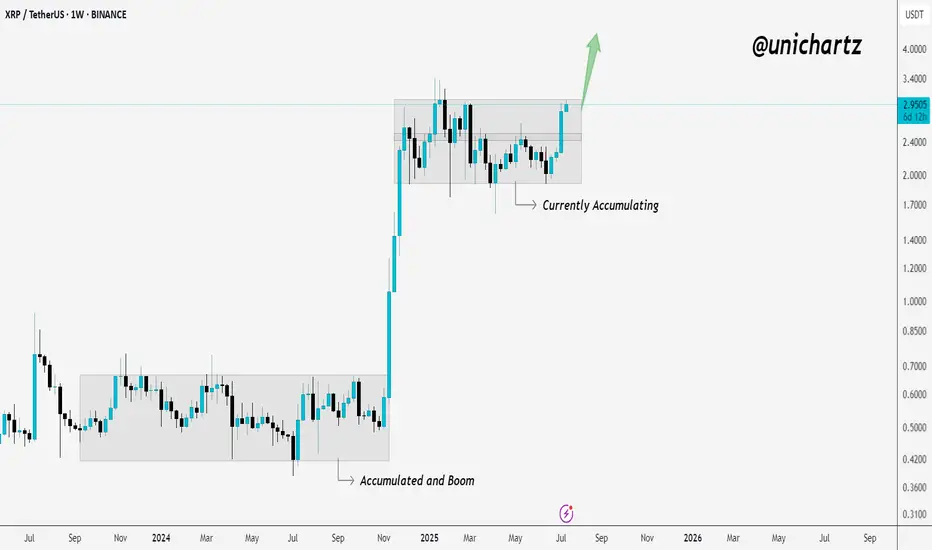
Accumulation Ending? XRP Showing Signs of BreakoutXRP is in the process of breaking out of its weekly accumulation range.
The last time we saw this kind of structure — it led to a massive move.
Now, price is pushing toward the top of the zone again… and momentum is picking up.
If it closes strong above this level, it could trigger the next big leg higher.
Stay alert — this could be the start of something big!
XRPUSDT Breaks Out of Bullish Flag - Big Moves Ahead!BINANCE:XRPUSDT has broken out of a classic bullish flag pattern on the weekly chart, signaling a strong continuation to the upside. This textbook setup is known for its high success rate, and the breakout suggests the potential for significant gains if momentum continues.
The CRYPTOCAP:XRP community remains strong, with long-term holders showing confidence and resilience. With the current market structure and support from loyal investors, there’s a real possibility for the price to double from this breakout zone.
The strategy is simple. Buy and hold for the long term. But as always, traders must manage risk carefully and use a proper stop loss. Let the flag fly high. CRYPTOCAP:XRP could be ready for a major pump from this level.
BINANCE:XRPUSDT Currently trading at $2.43
Buy level : Above $2.4
Stop loss : Below $1.9
Target : $5
Max leverage 3x
Always keep stop loss
Follow Our Tradingview Account for More Technical Analysis Updates, | Like, Share and Comment Your thoughts

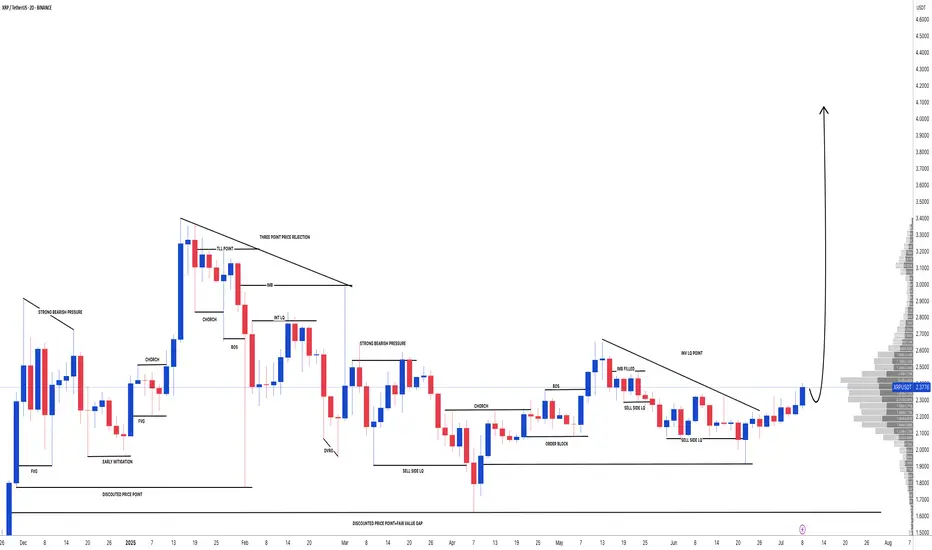
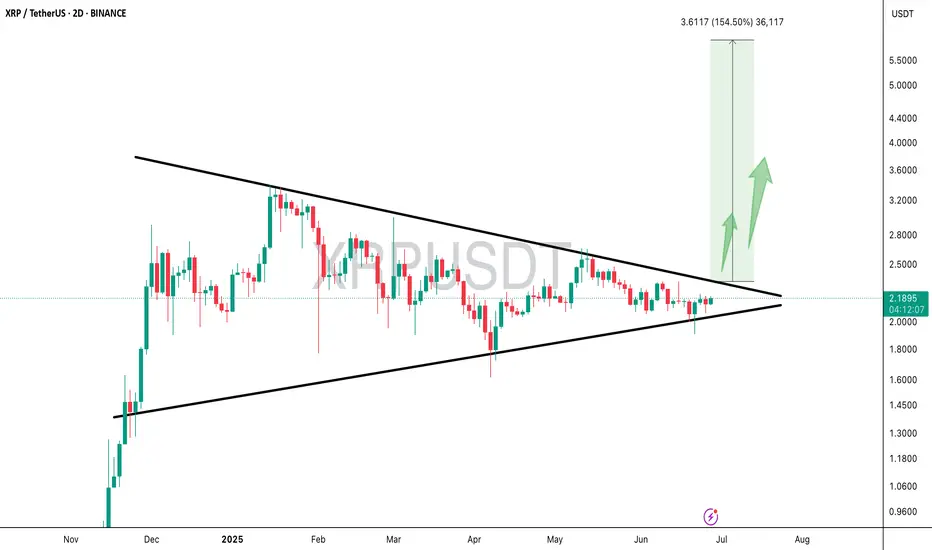
XRP Technical Analysis – Massive Breakout in Play!After months of tight consolidation inside a symmetrical triangle, XRP/USDT has finally broken out with strong bullish momentum on the daily timeframe.
🔹 Chart Pattern: Symmetrical Triangle
🔹 Breakout Confirmation: Daily candle closed above the descending trendline resistance
🔹 Support Zone: ~$2.00 – $2.20 (Held multiple times since April)
🔹 Breakout Level: ~$2.48 – $2.50
🔹 Next Resistance Levels:
▫️ $2.62 – Minor horizontal resistance
▫️ $3.39 – Major resistance from previous highs
▫️ $4.92 – Long-term macro target (measured move from triangle)
🧠 Why does this breakout matter?
✅ Strong Volume: Breakout happened with increased volume – a sign of genuine breakout
✅ Multi-month Base: The longer the consolidation, the stronger the breakout
✅ Support Respect: XRP respected the demand zone repeatedly, showing accumulation
✅ Momentum Building: A clean break could trigger trend-following bots and new buyers

XRP - How they gonna know? They gonna know!Huuuhh XRP blind longs eh? But yeah you can but if i was I wouldn;t

XRPUSDT Forming Bullish BreakoutXRPUSDT is showing an interesting setup with a bullish breakout potential that could fuel gains of 60% to 70% or more in the coming weeks and months. The recent price action suggests that XRP is breaking out of a long-standing consolidation pattern, with price pushing above a descending trendline and holding well above key support levels. This breakout is attracting both retail traders and big investors who see Ripple’s strong fundamentals and unique use case in the cross-border payment sector as major catalysts for its long-term growth.
The trading volume has remained healthy, signaling strong market participation and increasing confidence that XRP’s next move could be substantial. If momentum continues, traders can expect a potential rally towards major resistance zones, with increased interest from whales likely to accelerate the bullish scenario. Market sentiment around XRP has also improved thanks to positive developments in its legal battles and expanding partnerships, which add further conviction for investors.
XRP’s performance has historically shown that when it moves, it often does so aggressively, rewarding patient holders and active traders alike. This pattern aligns well with broader altcoin market cycles, where XRP tends to outperform during bullish phases. As always, it’s essential to monitor price action around key levels, adjust stop-losses wisely, and stay updated with market news to make the most of this potential run.
✅ Show your support by hitting the like button and
✅ Leaving a comment below! (What is You opinion about this Coin)
Your feedback and engagement keep me inspired to share more insightful market analysis with you!

#XRP/USDT#XRP
The price is moving within a descending channel on the 1-hour frame, adhering well to it, and is heading towards a strong breakout and retest.
We are experiencing a rebound from the lower boundary of the descending channel, which is support at 2.11.
We are experiencing a downtrend on the RSI indicator that is about to be broken and retested, supporting the upward trend.
We are looking for stability above the 100 Moving Average.
Entry price: 2.16
First target: 2.20
Second target: 2.24
Third target: 2.28

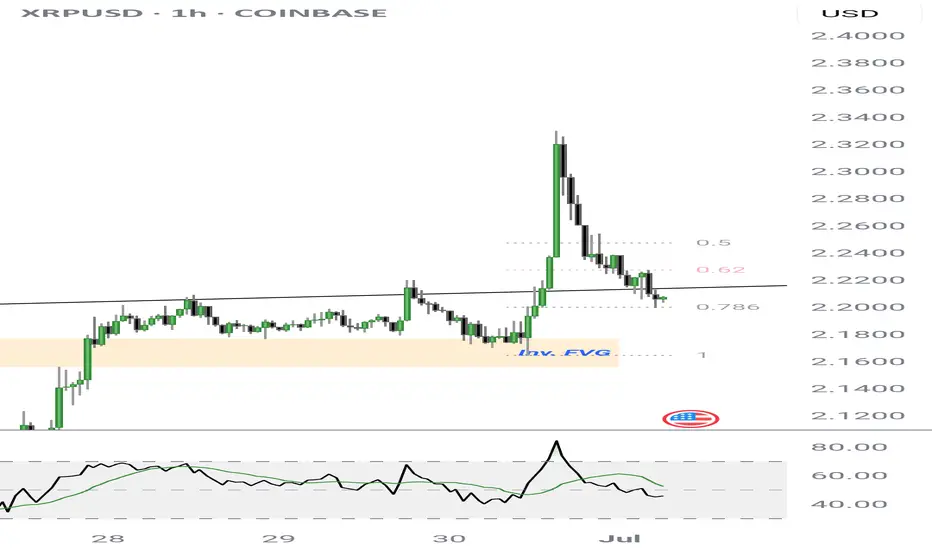
XRP - calm before the stormWe've got our bullish reversal sitting at the Golden Ratio price of $2.20. Fed Chairman Jerome Powell speaks today with many speculating that this will be the meeting that sends the markets soaring.
With over 17 ETFs, SWIFT update, Banks offering crypto services, BIS, XRPL EVM side chain, and many more catalyst. This could be the beginning to the largest bull run witnessed in our lifetime.
Have profits targets, an exit strategy, and plan for long-term reinvestments that will continue to make you money.
LOCK IN 🔐
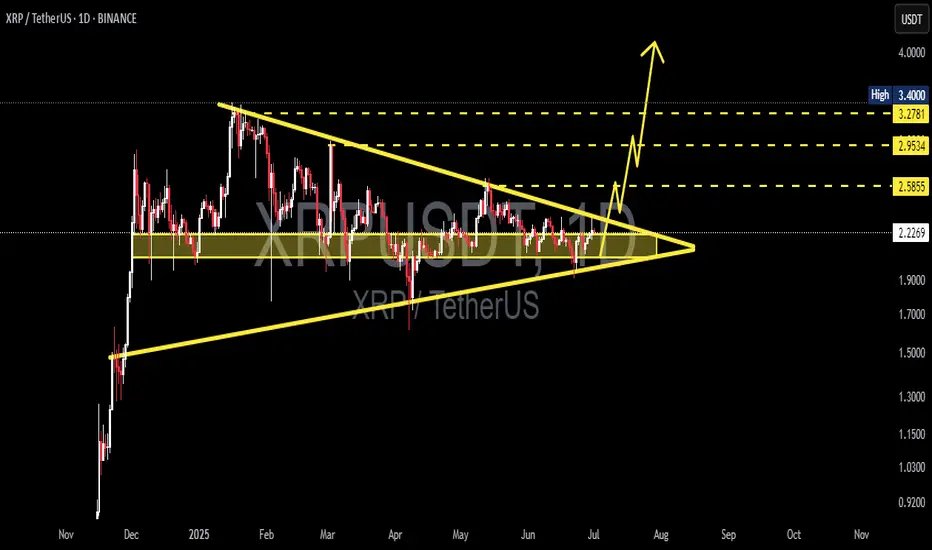
XRP/USDT Poised for Breakout from Symmetrical Triangle!Pattern Identified: Symmetrical Triangle
The symmetrical triangle is a consolidation pattern formed by a series of lower highs and higher lows, converging into a triangle shape. It reflects market indecision and often precedes a significant breakout, either upward or downward, depending on momentum and volume.
🔍 Pattern Description:
Upper Resistance Line (Descending): Connecting the lower highs since February 2025.
Lower Support Line (Ascending): Connecting the higher lows since December 2024.
Consolidation Zone: Price has been moving sideways within the triangle, indicating accumulation.
Critical Breakout Level: Around $2.23 — the price is currently testing this resistance.
📈 Bullish Scenario:
If the price successfully breaks above the upper triangle resistance with strong volume:
Target 1: $2.5855 (previous minor resistance)
Target 2: $2.9534 (key historical resistance)
Target 3: $3.2781
Maximum Target: $3.40 (local previous high and psychological level)
Breakout Confirmation: A daily candle close above $2.30 with significant volume could signal a long entry.
📉 Bearish Scenario:
If the price fails to break out and instead breaks down below the lower trendline:
Support 1: $2.00 (psychological & horizontal support)
Support 2: $1.85
Major Support: $1.55 (strong historical demand zone)
Breakdown Confirmation: A daily close below the lower triangle boundary with high volume would signal further downside.
📌 Summary:
XRP is nearing the apex of a symmetrical triangle — a major move is imminent.
A confirmed breakout could trigger a rally towards $3.40.
A breakdown may lead to a drop toward $1.55.
Recommendation: Wait for confirmation before entering long or short positions.
#XRP #XRPUSDT #CryptoBreakout #SymmetricalTriangle #XRPAnalysis #Altcoins #TradingView #TechnicalAnalysis #BullishCrypto #CryptoSignal
Breakout loading on $XRPBreakout loading on CRYPTOCAP:XRP 🚀
Accumulating heavily here as the price coils inside a massive triangle.
Q3 could be explosive, chart points to a breakout toward $4.60
Retweet if you're BULLISH !!
XRPI'm expecting a $1.80 tap before we take off.
We should begin moving up around the second week of July, after peace talks with Iran end. LOCK IN. 🔐