Will XRP’s Rally Spark the 2025 Altseason & Hit $5?XRP has been on fire since the start of 2024, surging 70% to a 7-year high. The Ripple vs. SEC lawsuit and speculation surrounding Trump’s presidency have fueled optimism. Now, another bullish catalyst has entered the mix—the SEC acknowledging Grayscale’s XRP ETF filing.
Key Bullish Drivers for XRP:
📌 SEC Acknowledges XRP ETF Filing – Buying pressure pushed XRP past $2.5, signaling growing confidence.
📌 Whales Move $430M in XRP – Large holders making strategic moves, often a precursor to major price action.
📌 Ripple vs. SEC Lawsuit Nears Closure – A favorable outcome could act as a massive bullish trigger.
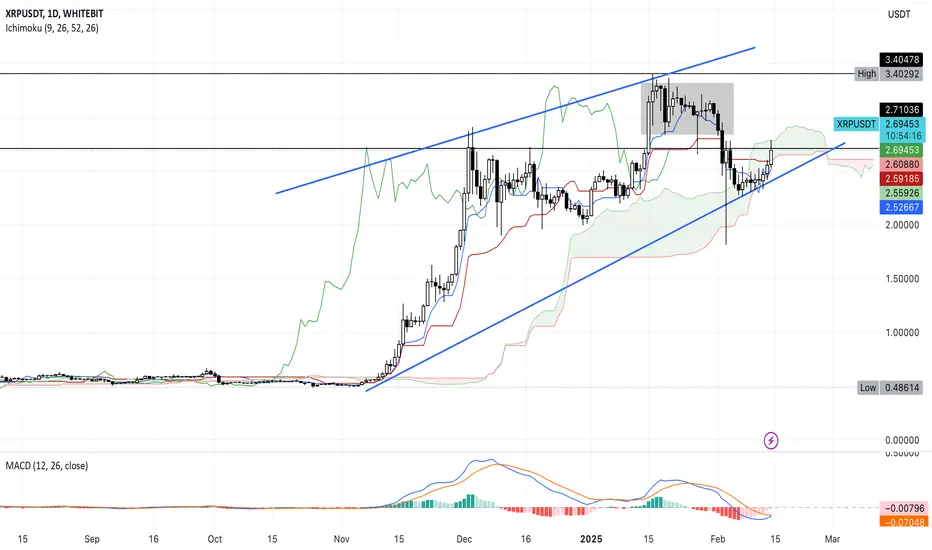
Technical Analysis – Can XRP Break $5?
📈 MACD Signals Bullish Continuation – Momentum remains in favor of an uptrend.
📉 Ichimoku Cloud & -DI Trigger Bearish Concerns – Selling pressure lingers, slowing momentum.
📉 Volume Decline – A breakout above $2.80 resistance is needed to confirm the next leg up.
Price Targets for 2025:
📌 Bullish Breakout → $4+ 🚀
📌 Full Rally → $5 ATH Target 🌕
With an XRP ETF approval potentially in play and the lawsuit nearing closure, XRP could lead the next altseason, propelling prices to new highs. Will it break past $5 in 2025? 👀
Xrpusdtlong
XRPUSD Still Bullish? SeekingPips XRP Ripple Long Term BUY ONLYIs XRP still a BUY?
🟢SeekingPips🟢 says keep it SIMPLE.
✅️If one was accumulating XRP Ripple for the LONG TERM and liked it at $3 why do you not like it NOW?✅️
ℹ️ Like I said before EVERYONE WAITS for the PULLBACK but when it turns up TRADERS/INVESTORS get SCARED to enter at these LOWER PRICES and some EVEN go SHORT and TRADE AGAINST their OWN BIAS.
💡It is a strange phenomenon but its VERY TRUE.
Do what the 1% do and you will be OK.
XRP/USDT 1H: Strong Momentum – Targeting $2.80?XRP/USDT 1H: Analysis
🚀 Follow me on TradingView if you respect our charts! 📈 Daily updates!
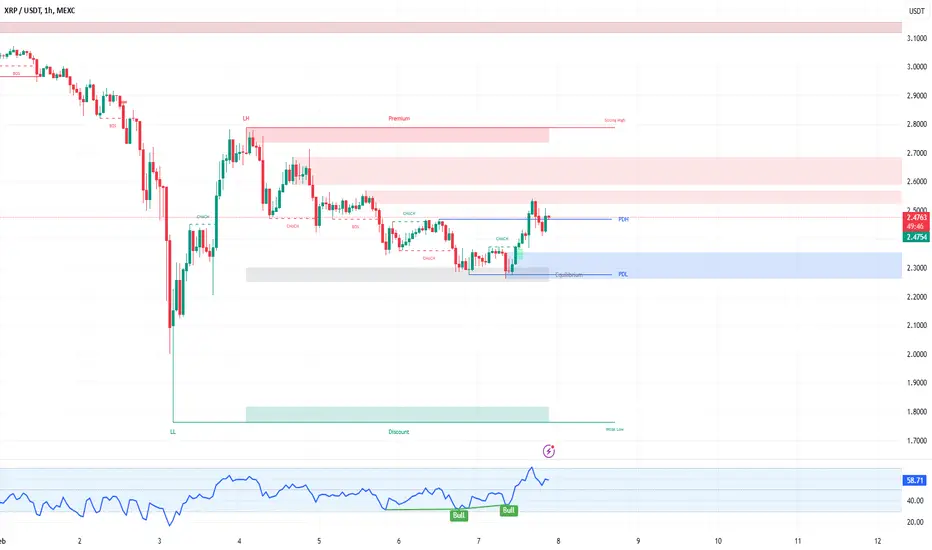
Current Market Structure:
Bullish breakout above $2.40 resistance, confirming upward momentum.
Price at $2.48, with RSI at 59.44, indicating strength but not yet overbought.
Smart Money Concepts:
Accumulation seen in the $2.30-$2.40 zone, forming a clear Order Block (OB).
Liquidity likely being engineered for a push toward premium levels.
Key Levels:
Support: $2.30 (Point of Interest - POI).
Resistance: $2.60, $2.80 (premium zone).
Stop Loss: Below $2.28 (recent low).
Targets:
T1: $2.60 (first resistance level).
T2: $2.80 (premium zone).
Hidden Divergence:
Bullish hidden divergence on RSI supports continuation to the upside.
Risk Score:
8/10 – Strong setup with clear risk-to-reward and well-defined invalidation.
Market Maker Intent:
Smart Money likely accumulating within the demand zone for a move to the premium zone.
Key levels at $2.60 and $2.80 could serve as magnet areas for liquidity grabs.
Recommendation:
Long entry favorable at current price ($2.48).
Maintain tight stops below $2.28 to minimize risk.
Watch for price action near $2.60 for potential reaction before further upside.
Confidence Level:
8/10 – Strong bullish structure with Smart Money accumulation signals.
🚀 Follow me on TradingView if you respect our charts! 📈 Daily updates!
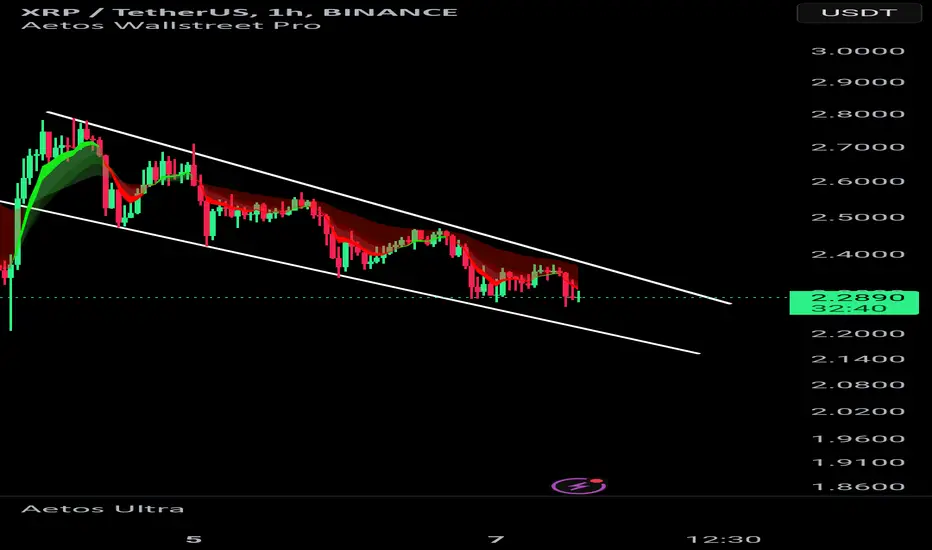
XRP Is Warming Up Will This Breakout Ignite a Rally ?XRP is currently trading at 2.30, moving within a descending channel formation. This pattern is typically bullish, suggesting that a breakout may occur soon. The price has been respecting the channel boundaries, making lower highs and lower lows, but momentum is showing signs of potential reversal.
A critical support level lies at 2.25, where buyers may step in to prevent further downside. If this level holds and the price forms a bullish candlestick pattern, such as an engulfing candle or strong green close, it could indicate the start of an upward move. On the upside, the key breakout level is at 2.42, where a decisive 1H candle close above this level would confirm bullish momentum.
Using Fibonacci retracement from the recent high of 2.70 to the swing low of 2.25, important levels align with structural resistance. The 0.382 retracement around 2.40 to 2.42 coincides with the upper boundary of the descending channel, making it the first confirmation zone. The 0.5 level at 2.48 is a mid-range resistance, while the 0.618 level at 2.55 to 2.57 serves as a strong bullish target if the breakout occurs. Additionally, the 1H 50 EMA is positioned near 2.35 to 2.38, acting as dynamic resistance that, once reclaimed, would further validate the bullish move.
Momentum indicators suggest that the market is at a crucial juncture. The RSI is currently below 50, indicating weak momentum, but if it moves above 55 to 60, it would confirm a shift in trend strength. Volume has been decreasing, which often precedes a breakout, meaning a sudden surge in volume above 2.40 would validate buyer interest and increase the probability of a sustained upward move.
For a trade setup, the ideal long entry would be upon confirmation of a bullish candlestick pattern, especially if accompanied by a breakout above 2.42. The first target would be 2.48, aligning with the Fibonacci 0.5 level, followed by 2.55 to 2.60, where further confirmation of bullish momentum is expected. A stop-loss should be placed below 2.25 to mitigate the risk of fakeouts and potential downside continuation.
If the price successfully breaks above 2.42 and sustains momentum, it could lead to a rally toward 2.60 and beyond. However, if support at 2.25 fails, the price could retrace further toward 2.20 to 2.15 before finding stability. It is crucial to wait for a proper breakout confirmation before entering a trade to avoid unnecessary risks.
Price Is NOT RANDOM! Do You Agree? • SeekngPips • TIME & PRICE!⚠️Do you still thing price is RANDOM❓️
🌍 "You Don't need to know where the market is going to next to make money in the markets" ✅️
Were the famous words from the late and great MARK DOUGLAS 1948-2015
🟢SeekingPips🟢 agrees with the above statement very much, however what is ALSO true is that identifying key 📈PRICE LEVELS on a CHART📉 in ADVANCE BEFORE TIME and PRICE meet improves any trading edge.🚥

XRP Weak Hands Selling! XRPUSD Cheap BUY? Ripple Long Bargain? XRP Weak Hands Selling! XRPUSD Cheap BUY? Ripple Long Bargain?
ℹ️ The thing is everyone talks about BUYING the 🥳DIP but the fact is that when the DIPS turn up the traders WITHOUT A PLAN often do 😕NOTHING or EVEN WORSE do the 😨OPPOSITE and chase the MOMENTUM DOWN. 😱
⚠️The Question Is Which Trader Are You❔️
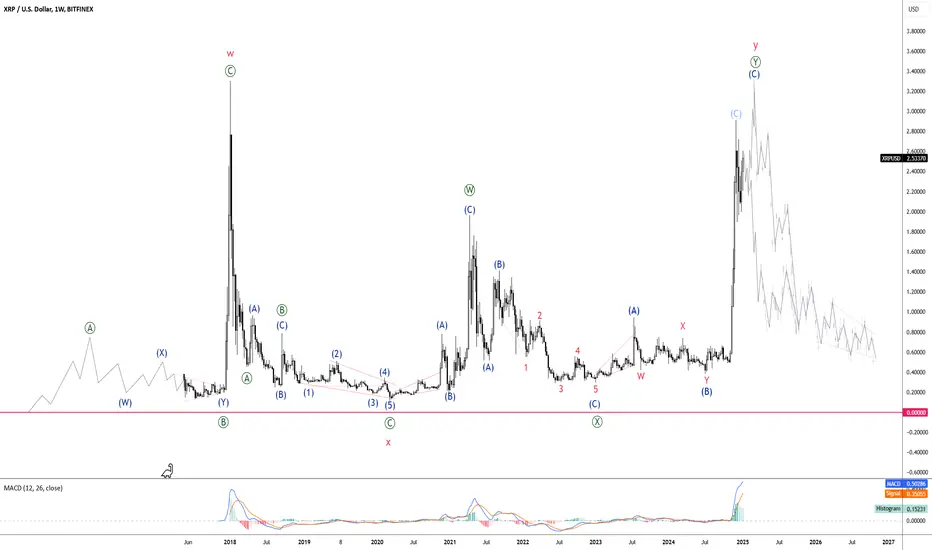
XRPUSDT: Ellio analysisHello Friends. According to the chart we see the 4th wave of 5 and 1-2 of wave 5: so completed I expected continued to formed wave 3-4-5 of wave 5: , to reach 3.8 and 4 $

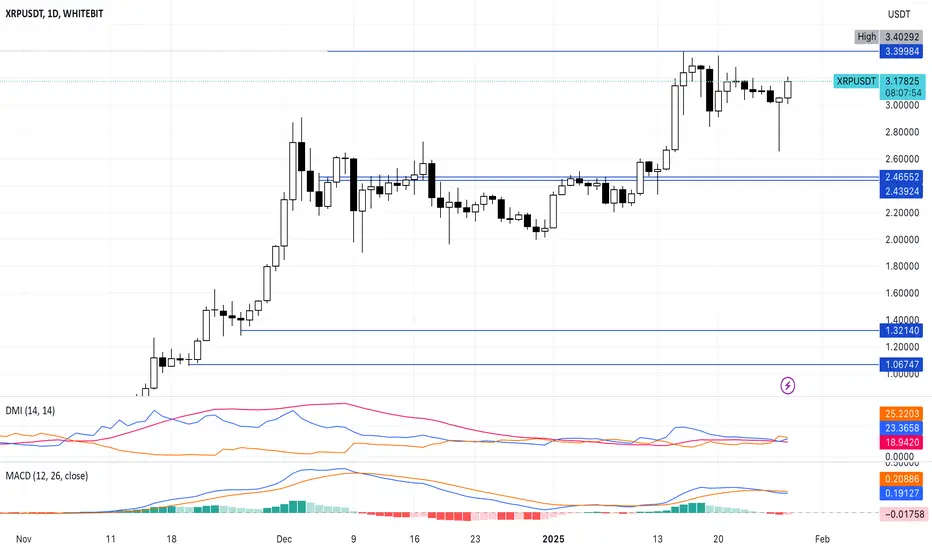
XRP Holds Strong Amid Market Correction – Next Stop $3.50?Despite broader market corrections, XRP remains resilient, gaining over 1% in the past 24 hours and surging 55.15% in the last 30 days. With a YTD return of +34.51%, XRP currently holds the title of the best-performing altcoin among the top 25 projects.
Technical indicators continue to favor bullish momentum. The 50/200-day EMA shows growing buying pressure, while the RSI hovers near overbought levels, signaling sustained demand. If XRP maintains its position above $3, it could build momentum toward its next resistance at $3.50.
However, if bearish pressure increases, XRP may retest its support at $2.75 before another attempt at an upward move. For now, all eyes are on whether XRP can break through key resistance or face short-term consolidation.
With strong technical support and continued investor confidence, XRP could be gearing up for another bullish push. Will it hold above $3 and make a run for $3.50?
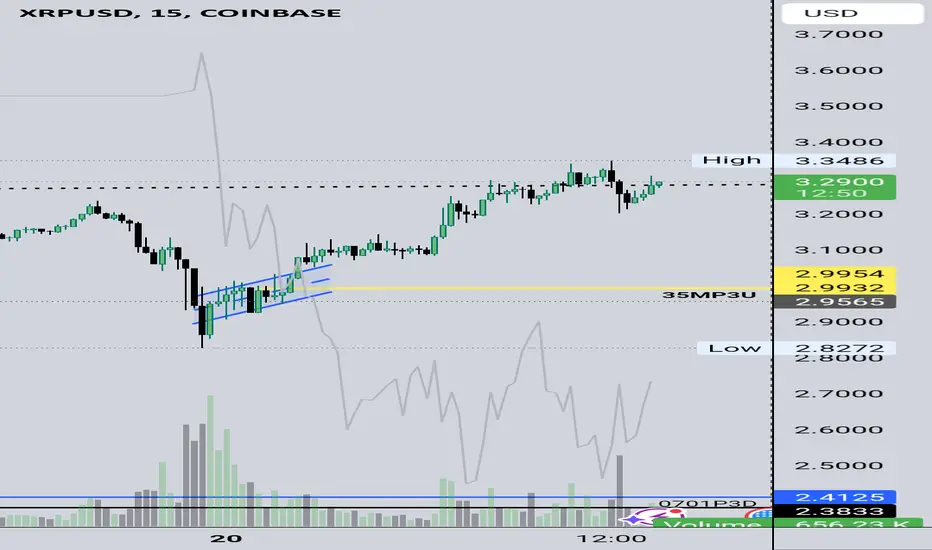
Massive Whale Activity Fuels Bullish Hopes for XRP RallyThe crypto market is shaking off selling pressure sparked by the launch of DeepSeek, an innovative AI model that hit the AI sector hard. Amid this turbulence, XRP has rebounded impressively, recovering from a dip below $2.7 to climb 10% in the last 24 hours, trading at $3.15. Notably, this surge comes as trading volumes drop by 18%, hinting at passive bearish pressure and setting the stage for a potential breakout.
XRP continues to trade within a bullish pattern, supported by massive whale activity. Recent data reveals that whales accumulated nearly 120 million XRP during the dip, with 25 million XRP purchased on Upbit and moved to unknown wallets. This accumulation underscores growing confidence among major players, aligning with bullish market sentiment.
Technical indicators further support the bullish case. XRP’s MACD and DMI are primed for a bullish crossover, signaling momentum for a breakout. The ADX remains low, suggesting that the bulls are in an accumulation phase, while the on-balance volume is incrementally rising, confirming strong buying interest.
The Chaikin Money Flow indicator, heavily above zero, signals strength in the ongoing rally. XRP is currently consolidating near the 0.786 FIB level at $2.77. A breakout above this zone could see the token surpass the 1 FIB level, targeting a new all-time high at the 1.2 FIB level of $4.18.
With whale activity, bullish technicals, and improving market sentiment, XRP is positioned for a strong breakout. Will this rally push XRP to new heights? The next few days could be pivotal.
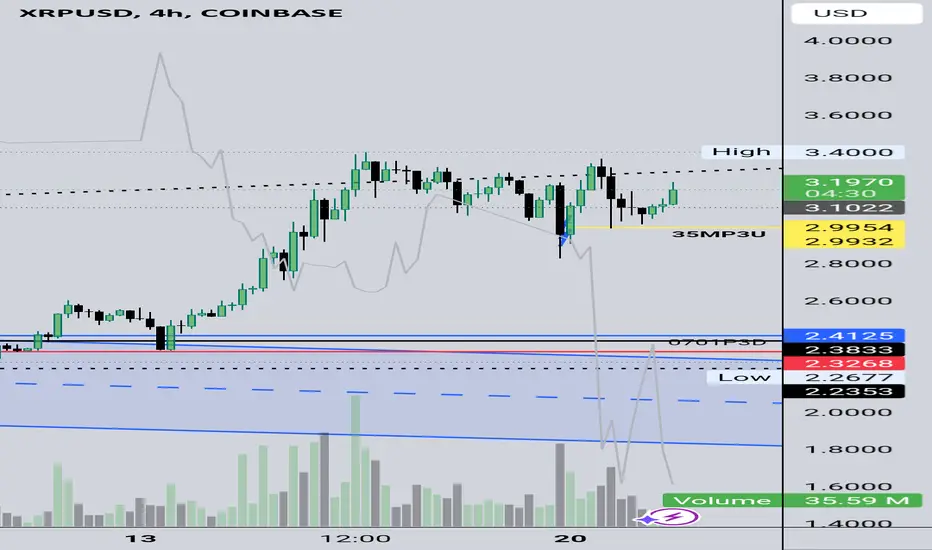
XRP in Bull-ChannelXRP/USDT Analysis 📊🔥
🔹 XRP is moving within a bullish channel on the 4-hour timeframe, showing positive signs for a continuation of the uptrend.
📌 Key Levels:
Strong Support: 💪 $2.68 (critical level for potential bounce if correction happens).
Major Resistance: 🚀 $3.70 (next target for breakout).
📈 Trend Analysis:
A significant pump was seen in the previous move, and the price is now in a consolidation phase.
Breaking out of the triangle pattern could define the next trend direction:
An upward breakout targets the $3.70 resistance 🟢.
A downward move could retest the $2.68 support 🔴.
✨ Suggestion:
Wait for a breakout confirmation and trade accordingly. Keep an eye on how the market reacts to the support and resistance levels. 📌

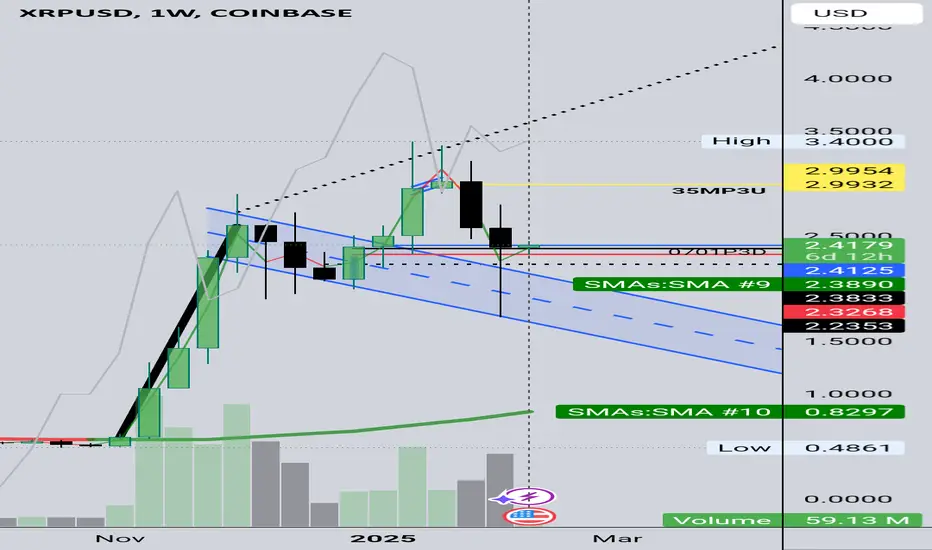
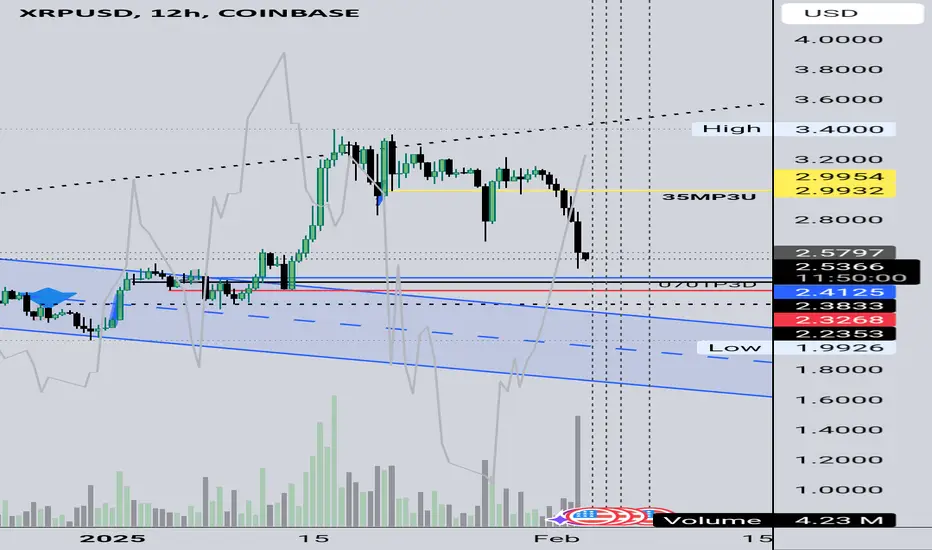
XRP Big Picture Grinding HIGHER? XRPUSDT Buy Long only for Us! XSeeking Pips likes XRP HIGHER STILL!
Yes price has stalled somewhat but ✅️HIGHER TIMEFRAMES still call for $4 xrp MINIMUM TARGET in our opinion.
As Stated on our shared analysis last week on 15/01/25 🟢SeekingPips🟢 thinks below $5 XRPUSD REMAINS A BARGAIN as a LONG TERM HOLD.👌
Daily Chart BULL FLAG remains in play and SeekingPips continues to see BULLISH REACTIONS on our LOWER timeframe CHARTS and PRICE LEVELS we have identified and shared until now.
🔴 SUBSCRIBE NOW🔴 & Receive Our Latest Chart Analysis...
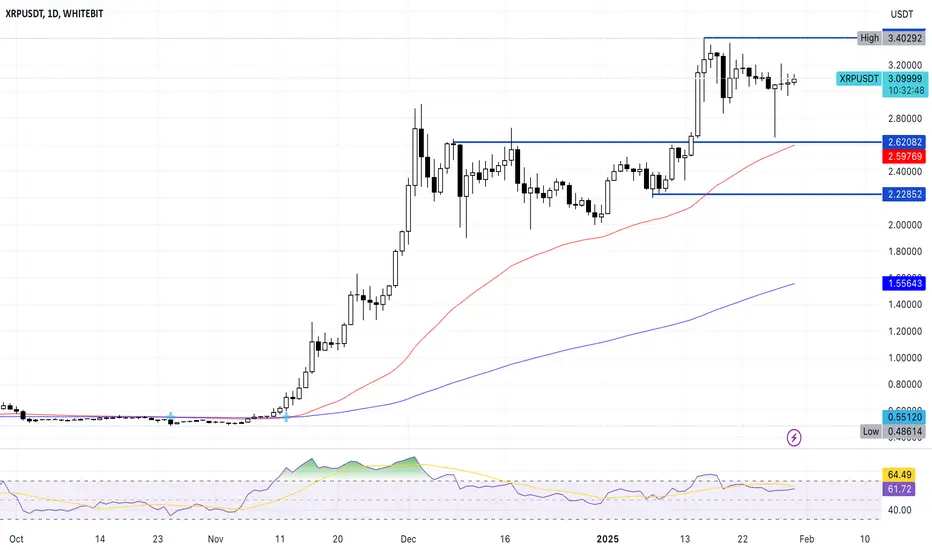
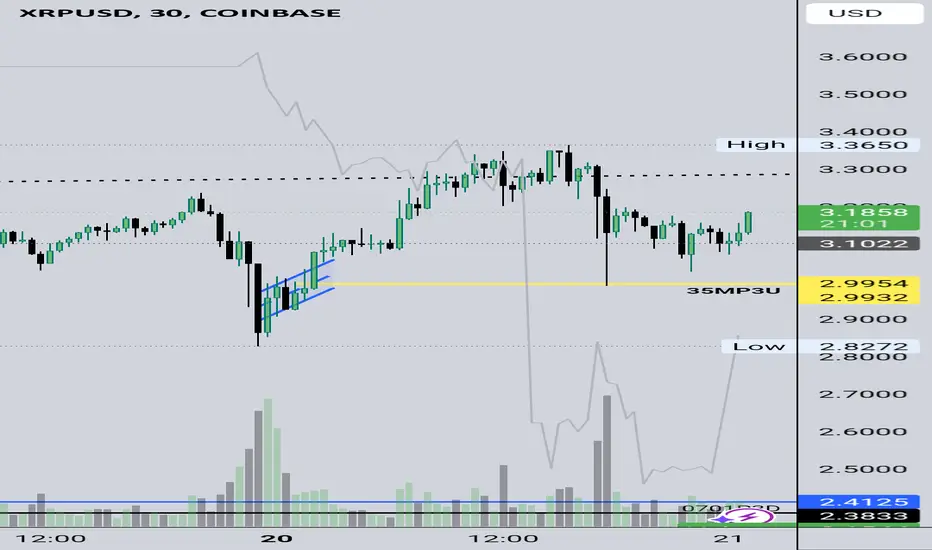
XRP Drops 9% from All-Time High Amid Profit-Taking WaveXRP has slipped 9% from its recent all-time high of $3.41, now trading at $3.09. This decline is largely attributed to intensified profit-taking, as on-chain metrics reveal heightened selling activity among investors.
The Network Realized Profit/Loss (NPL) indicator, a key metric that measures the difference between the price at which assets were last moved and their current market value, shows persistently positive values. This signals that a significant number of XRP holders are cashing in their profits, increasing market supply and putting downward pressure on the token’s price.
When NPL is positive, it means more traders are selling at a profit than at a loss. This creates an imbalance between supply and demand, leading to potential price drops if buying activity doesn’t match the sell-off.
At its current price of $3.09, XRP risks further declines if the profit-taking trend continues. Analysts predict a potential drop to $2.45, where strong support could stabilize the price. Conversely, if selling slows and demand picks up, XRP might regain momentum and aim for another attempt at its all-time high.
With XRP holding its place as the third-largest cryptocurrency, its next moves are being closely monitored. Will profit-takers rule the market, or can bulls reclaim control? The coming days could determine XRP’s near-term fate.

SeekingPips XRP levels like magic! XRPUSD Ripple Next Move?✅️Another example of picture perfect levels from 🟢SeekingPips🟢.
Like SUBSCRIBE & Boost Our Posts now and stay in the know!
Xrp BUY XRPUSD LONG Did You TAKE IT? SEEKINGPIPS Gave It On A PThis mornings trigger was very easy a clear did you get involved?
🟢Trading should be just like that
"if X then this if Y then that"
🟢Keep it SIMPLE thats how you make trading easier.
✅️ BOOST, LIKE & FOLLOW SeekingPips NOW
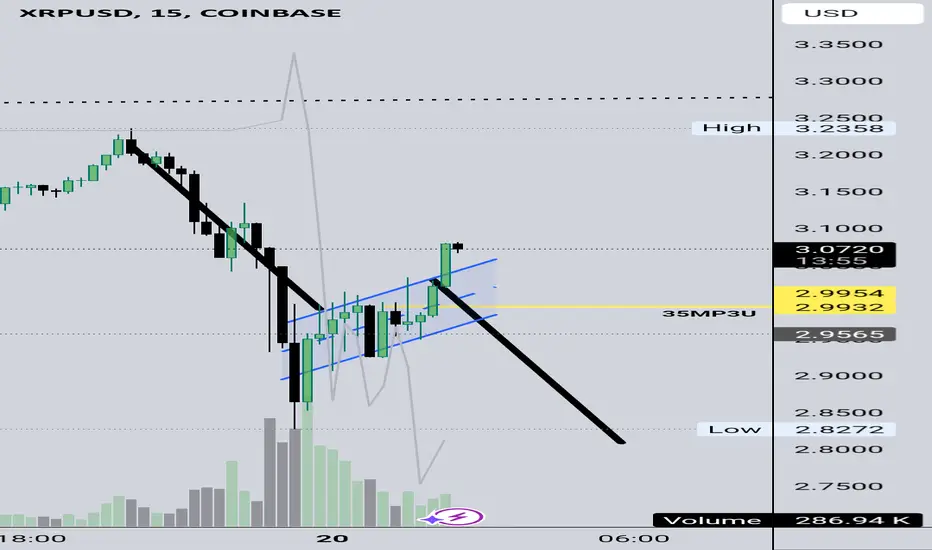
XRP Longs ONLY XRPUSD BUYS - Daily Bull Flag Still Good?🟢You know by now SeekingPips is looking for any opportunities to add to our XRP holdings.
🟡Yellow line is current line in the sand.
Needs to hold $3 otherwise an equal move down on this timeframe still leaves the Daily Bull Flag Valid.📈
📉LIKE, BOOST & SUBSCRIBE NOW 👍
XRP . Ready For Last Round
XRPUSDT :
If the price can hold the channel and break the trend to the upside,
we will see a good move to the top of the channel.
So We will wait for it.
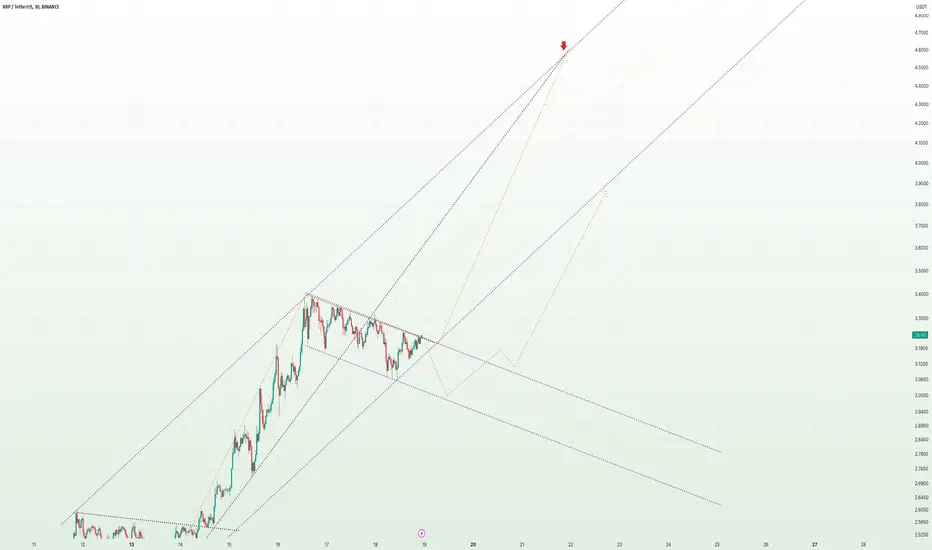
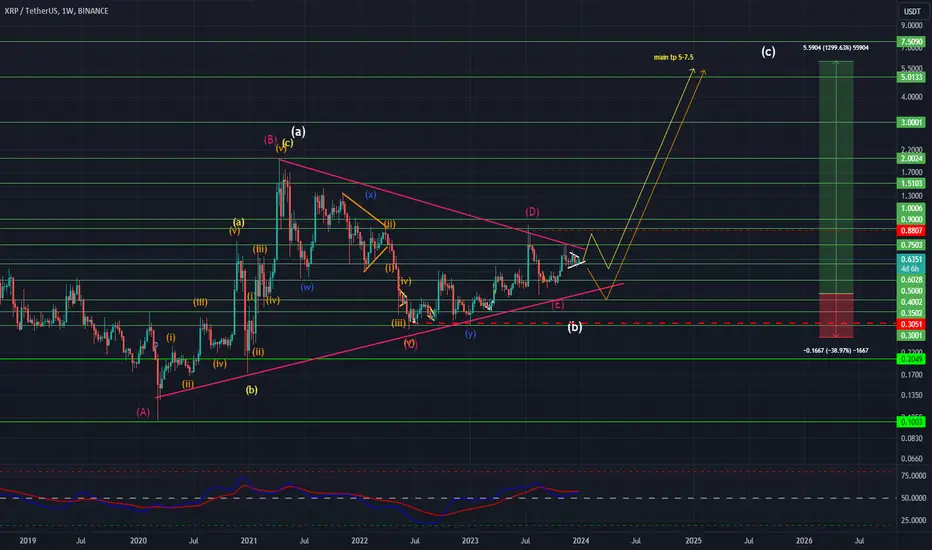
XRPUSDT Elliott Waves Analysis (Investment Idea)Hello friends.
Please support my work by clicking the LIKE button👍(If you liked). Also i will appreciate for ur activity. Thank you!
Everything on the chart.
Main(investment) target zone: 5 - 7.5$
Cancellation of setup - consolidation under ~0.3
RR: 1 to ~30
risk is justified
Good luck everyone!
Follow me on TRADINGView, if you don't want to miss my next analysis or signals.
It's not financial advice.
Dont Forget, always make your own research before to trade my ideas!
Open to any questions and suggestions
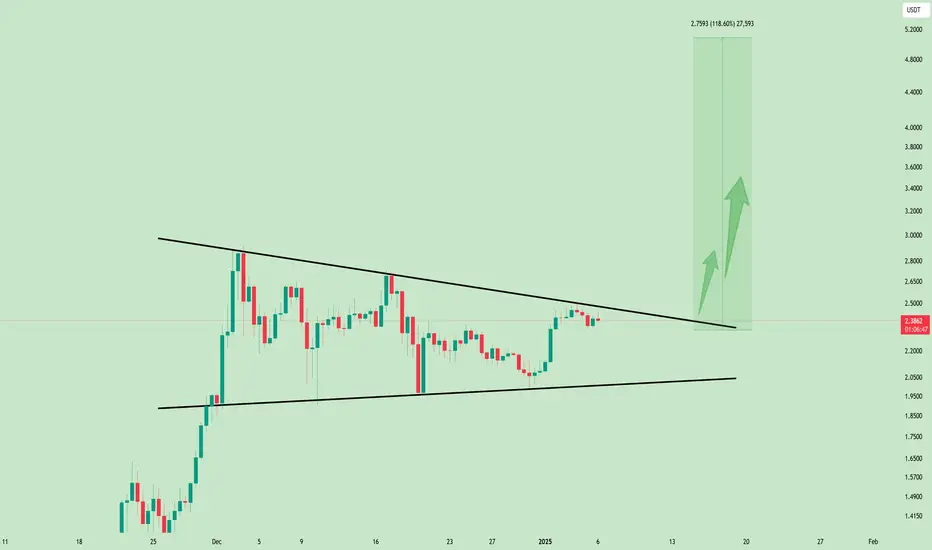
#XRP is forming a symmetrical triangle pattern! #XRP is forming a symmetrical triangle pattern!
We expect a strong bounce once it breaks out. 🚀
Keep an eye on this setup—it could be a great opportunity!
DYOR, NFA
#Crypto #BullRun2025 #Altseason
XRPUSD GLOBAL WAVE MAPBLA BLA BLA
Overall Trend:
The chart shows that XRP/USDT experienced a sharp rally in November, followed by a consolidation phase within a descending channel from December through early 2025.
2. Support and Resistance Levels:
Key Support Levels:
XRPUSDT: Not Impressed Despite the Volume SpikXRPUSDT: Not Impressed Despite the Volume Spike 📉
XRPUSDT not looking good to me.
Here’s the breakdown:
Volume Surge: A 50% increase in daily volume—sounds exciting, right?
Overall Trend: Unfortunately, the chart doesn’t look promising. Buyers aren’t stepping up as expected.
I’ll be cautious here—sometimes volume spikes without real strength can be a trap. Let the market show its hand before diving in!
Play smart, stay sharp, and follow for more insights. 🚀
Let me tell you, this is something special. These insights, these setups—they’re not just good; they’re game-changers. I've spent years refining my approach, and the results speak for themselves. People are always asking, "How do you spot these opportunities?" It’s simple: experience, clarity, and a focus on high-probability moves.
Want to know how I use heatmaps, cumulative volume delta, and volume footprint techniques to find demand zones with precision? I’m happy to share—just send me a message. No cost, no catch. I believe in helping people make smarter decisions.
Here are some of my recent analyses. Each one highlights key opportunities:
🚀 RENDERUSDT: Strategic Support Zones at the Blue Boxes +%45 Reaction
🎯 PUNDIXUSDT: Huge Opportunity | 250% Volume Spike - %60 Reaction Sniper Entry
🌐 CryptoMarkets TOTAL2: Support Zone
🚀 GMTUSDT: %35 FAST REJECTION FROM THE RED BOX
🎯 ZENUSDT.P: Patience & Profitability | %230 Reaction from the Sniper Entry
🐶 DOGEUSDT.P: Next Move
🎨 RENDERUSDT.P: Opportunity of the Month
💎 ETHUSDT.P: Where to Retrace
🟢 BNBUSDT.P: Potential Surge
📊 BTC Dominance: Reaction Zone
🌊 WAVESUSDT.P: Demand Zone Potential
🟣 UNIUSDT.P: Long-Term Trade
🔵 XRPUSDT.P: Entry Zones
🔗 LINKUSDT.P: Follow The River
📈 BTCUSDT.P: Two Key Demand Zones
🟩 POLUSDT: Bullish Momentum
🌟 PENDLEUSDT.P: Where Opportunity Meets Precision
🔥 BTCUSDT.P: Liquidation of Highly Leveraged Longs
🌊 SOLUSDT.P: SOL's Dip - Your Opportunity
🐸 1000PEPEUSDT.P: Prime Bounce Zone Unlocked
🚀 ETHUSDT.P: Set to Explode - Don't Miss This Game Changer
🤖 IQUSDT: Smart Plan
⚡️ PONDUSDT: A Trade Not Taken Is Better Than a Losing One
💼 STMXUSDT: 2 Buying Areas
🐢 TURBOUSDT: Buy Zones and Buyer Presence
🌍 ICPUSDT.P: Massive Upside Potential | Check the Trade Update For Seeing Results
🟠 IDEXUSDT: Spot Buy Area | %26 Profit if You Trade with MSB
📌 USUALUSDT: Buyers Are Active + %70 Profit in Total
🌟 FORTHUSDT: Sniper Entry +%26 Reaction
🐳 QKCUSDT: Sniper Entry +%57 Reaction
📊 BTC.D: Retest of Key Area Highly Likely
This list? It’s just a small piece of what I’ve been working on. There’s so much more. Go check my profile, see the results for yourself. My goal is simple: provide value and help you win. If you’ve got questions, I’ve got answers. Let’s get to work!

XRPUSD Weekly & Daily Charts Are Key XRP RIPPLE this WEEKEND...🟢Regardless of your LONG or SHORT term bias or position the higher timeframes will be key in any decision going forward.
🟢As we come into the end of the week tomorrow will mark the first full trading week of 2025 bringing W1 to a close.
🟢Today's D1 close will be key also.
Has price finally broken out od the DAILY CHART BULL FLAG?
ℹ️Remember stick to your own plan, at the end of the day that is the obly thingvthat matters.
Have a GREAT WEEKEND!✌️

XRP LONG SeekingPips riding thr wave BUY XRPUSD Having a PLAN is the FIRST step sticking to it is the SECOND
SeekingPips in for the long run XRP BULL

XRP’s Bullish Momentum Builds: Will It Break the Flag?XRP/USDT is consolidating well near the upper range of a bull flag pattern, demonstrating impressive strength in an otherwise highly volatile market, where most coins are down by 10-20%.
This resilience is a clear sign of bullish momentum. If the price successfully breaks and sustains above the shaded resistance zone, we could see a sharp and significant upward move.
DYOR, NFA
