WTI Under Attack – Rob the Market with This Bear Setup🛢️💣 WTI Oil Short Raid: Bearish Heist Activated! 💣🛢️
📉 Thief Trader’s Limit-Layered Attack Plan 🔐
💥 Attention Market Robbers & Chart Breakers! 💥
We're about to break into the XTIUSD / US Oil Spot vault — Bearish style.
🚨 The Setup:
This ain’t your average breakout — we’re talking high-precision, multi-layered entries on a downside raid.
🧠 Thief Trader Strategy: Drop limit orders at key zones like trip wires. Let price walk into your trap.
🎯 Plan:
🧱 Entry: Any level after MA resistance confirmation.
Layer multiple limit orders — DCA-style — after trend shows weakness.
🛑 Stop Loss: 66.300 🔒
Protect your vault. Place SL just above major 4H rejection zone.
🎯 Target: 60.000 💰
Profit at exhaustion level. This is where bulls cry, and we cash out.
🧠 Robbery Logic Backed By:
COT Data 📊
Crude Oil Inventories 🛢️
Macro + Sentiment Flows 🌐
Technical MA Break + Retest Patterns 🎯
🔥 Why this isn’t a random short?
Because thieves do research — not guesswork.
Bulls have overextended. Oil’s price is reacting to strong supply pressure and weakening demand outlook.
⚠️ Risk Note:
No entry without trend confirmation.
No blind shots — place alerts and wait for the setup.
This is a sniper job, not a shotgun spray.
💬 Join the Robbery Crew
Smash that ❤️ & Boost if you're riding with the thieves!
Drop your charts, entries, or sniper shots in the comments 💬
We rob together. We win together.
🔔 Follow for more heist plans – next market break-in coming soon.
💰 Rob Smart. Trade Sharp. Exit Clean. 🏴☠️
Xtiusdshort

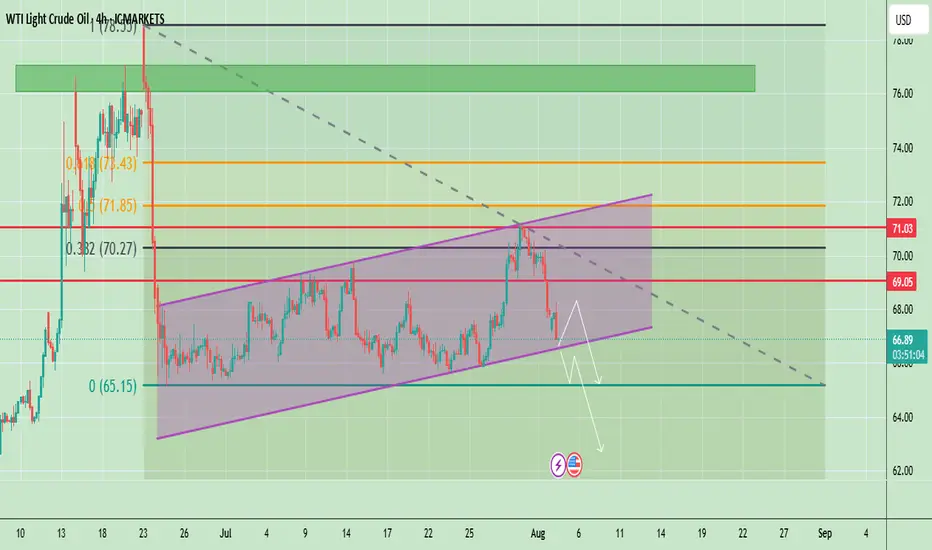
Oil at Key Support – Bounce or Breakdown?Crude oil is trading around $66.94, showing a bearish correction after failing to hold above $69.05. The chart shows price respecting an ascending channel but currently testing its lower boundary. The recent drop signals weakening bullish momentum, and a confirmed break below the channel could accelerate selling pressure toward lower levels.
📈 Potential Scenarios
- Bullish Rebound: If price holds above the channel support (~$66.00–$66.50) and breaks back above $69.05, it may target $71.03 and possibly $72.00.
- Bearish Breakdown: A confirmed close below $66.00 can accelerate the downside toward $65.00, with extended targets near $63.50–$62.00.
📊 Key Technical Highlights
- Price rejected from the channel top and is now testing lower support.
- Key resistance zones: $69.05 (immediate), $71.03 (major).
- Key support zones: $66.00 (channel), then $65.00–$63.50 (breakdown targets).
- Momentum indicators show weakening buying pressure, favoring cautious trading.
🔑 Key Levels to Watch
- Resistance: $69.05 → $71.03 → $72.00
- Support: $66.00 → $65.00 → $63.50
🧭 Trend Outlook
- A short-term relief bounce is possible, but failure to reclaim $69.05 keeps sellers in control.
- Breaking below the channel would shift the overall outlook to bearish for August.
Note
Please risk management in trading is a Key so use your money accordingly. If you like the idea then please like and boost. Thank you and Good Luck!
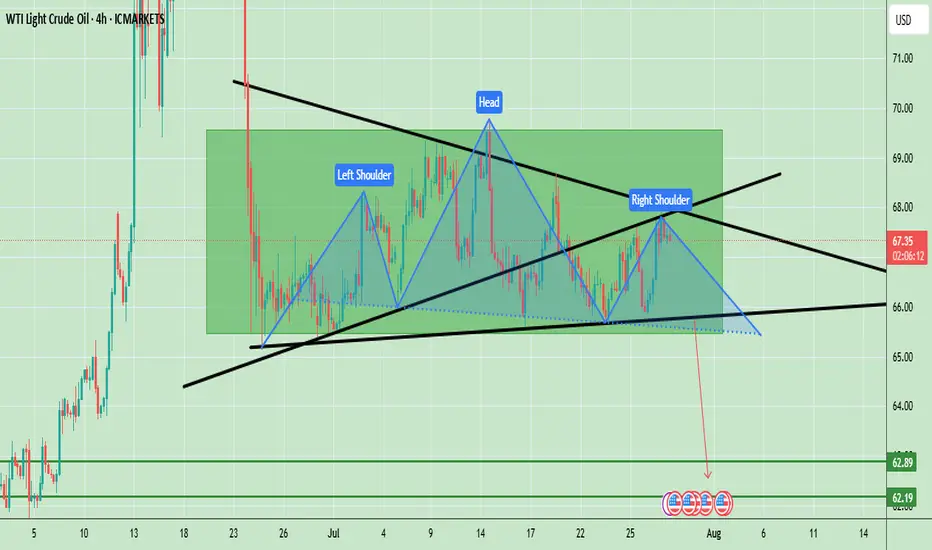
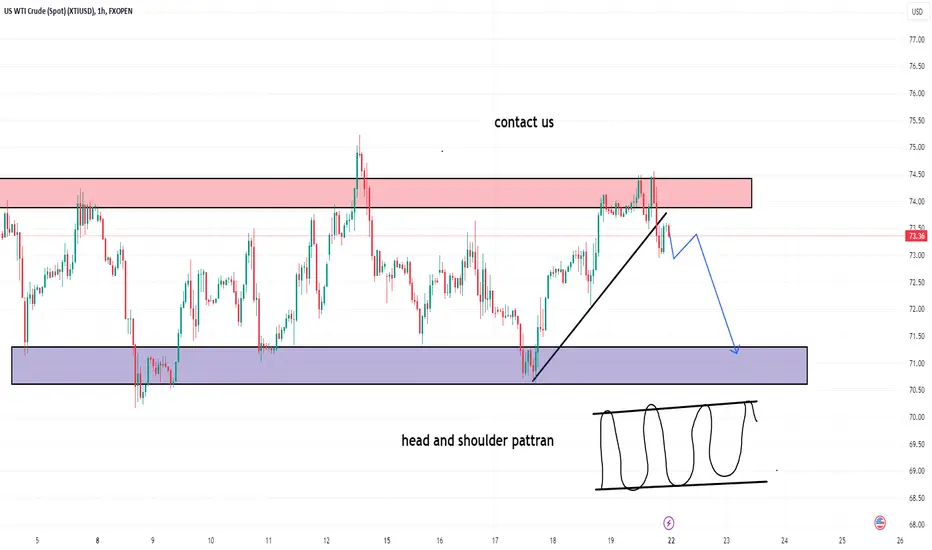
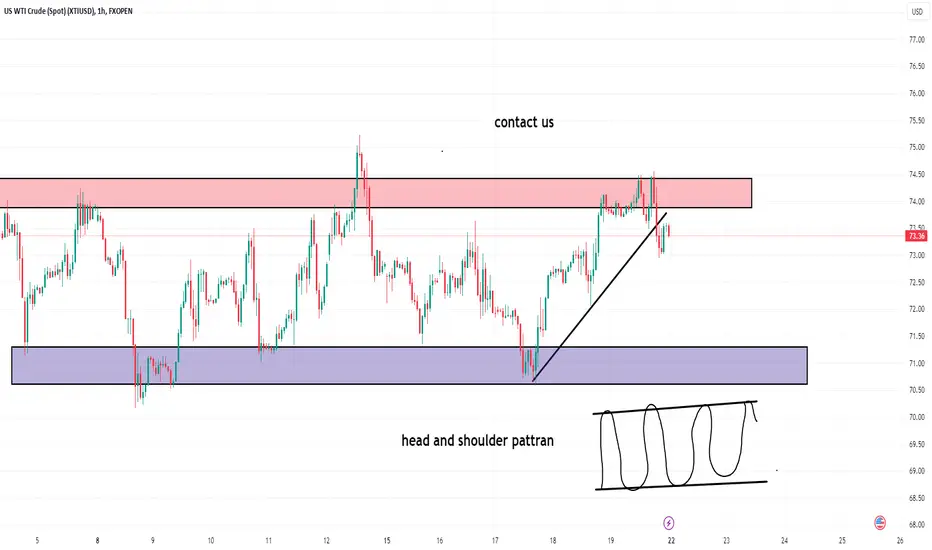
Oil Prices Form Bearish Head & Shoulders – Key Neckline in FocusWTI crude oil is showing a clear Head and Shoulders (H&S) pattern, which is a strong bearish reversal signal. The left shoulder formed in early July, followed by a higher peak forming the head in mid-July, and finally the right shoulder near the current levels, which is lower than the head. The neckline is positioned around $66.00, acting as a key support level. Currently, the price is trading at $67.34, hovering slightly above this neckline, indicating that the market is at a critical decision point. A confirmed break below the neckline could accelerate bearish momentum, targeting the $62.20 – $62.80 zone based on the pattern’s measured move. However, if the neckline holds, a possible bounce toward $68.50 – $69.00 could occur, but overall bias remains bearish unless the price can break and sustain above $69.00.
Key Price Levels:
- Resistance: $68.50 – $69.00
- Neckline Support: $66.00
- Bearish Target (if confirmed): $62.20 – $62.80
Note
Please risk management in trading is a Key so use your money accordingly. If you like the idea then please like and boost. Thank you and Good Luck!
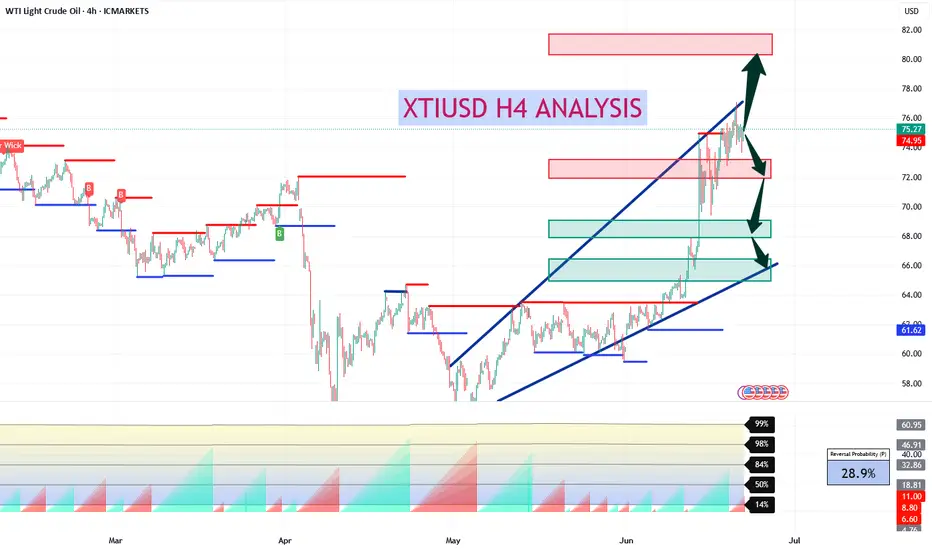
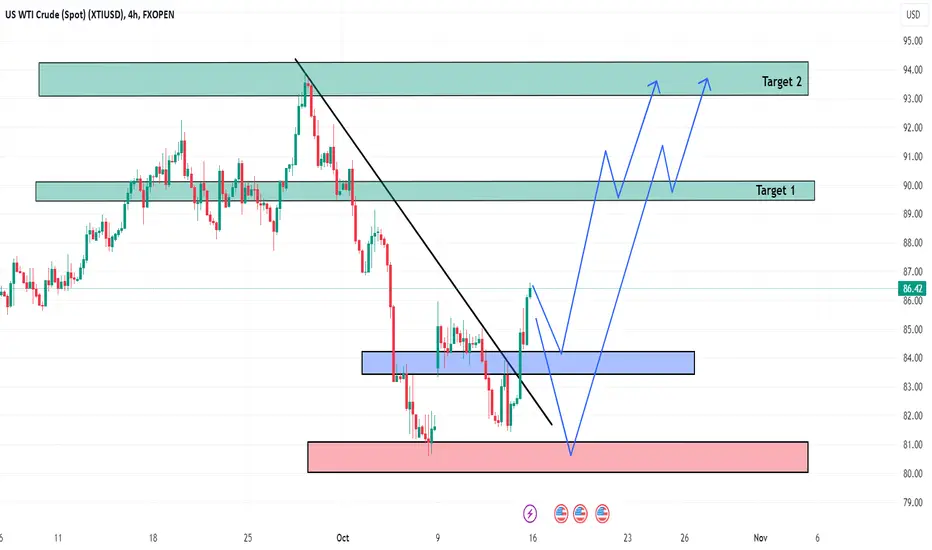
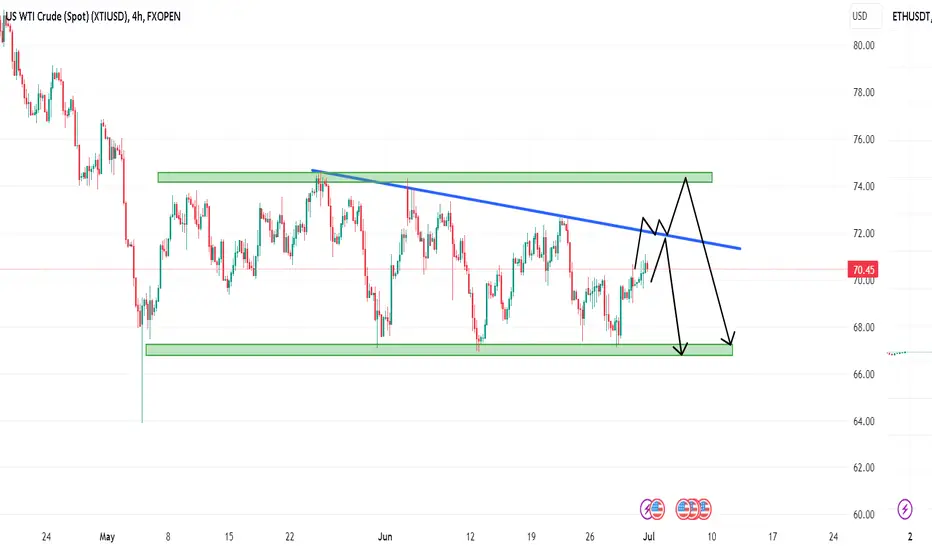
XTIUSD H4 AnalysisXTIUSD Showing a bearish Flag. If it breaks this zone above, Most probably can fly upto 81.00 and higher. If no, Can rally between 72, 68 or even 66. Trading Analysis from 23-06-25 to 27-06-25. Take your risk under control and wait for market to break support or resistance on smaller time frame. Best of luck everyone and happy trading.🤗
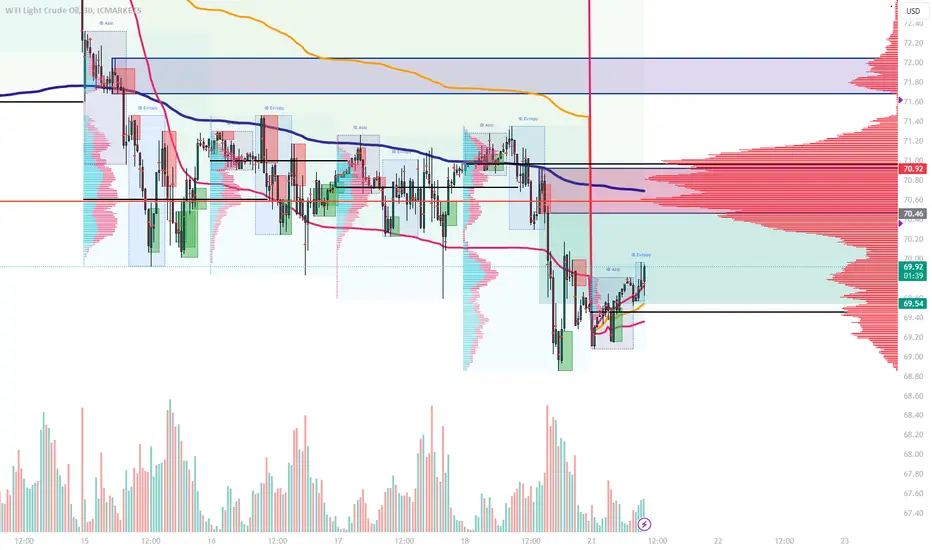
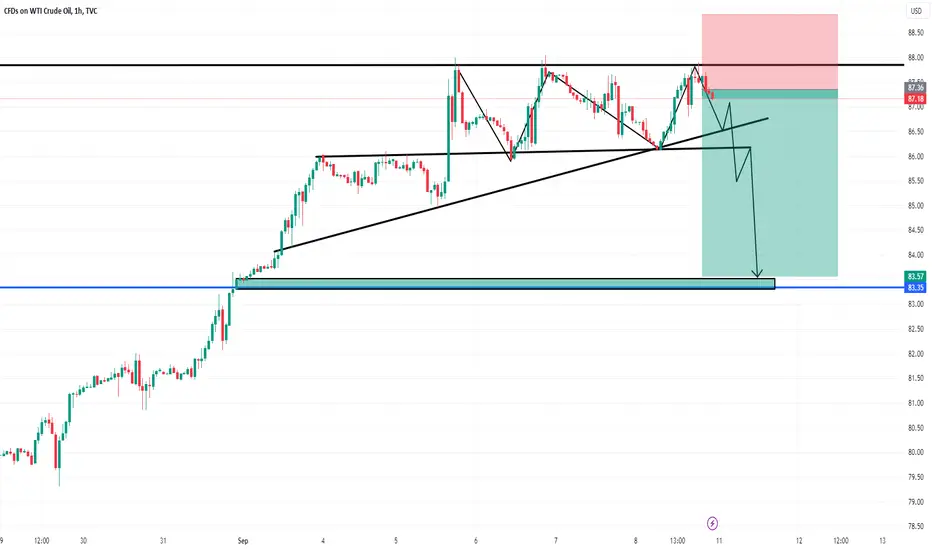
XTIUSD 30m previewICMARKETS:XTIUSD Oil broke the rotation and is heading down, I look for short positions and here is an example of such a short
US-Oil will further push upside After Testing TrendlineHello Traders
In This Chart XTIUSD HOURLY Forex Forecast By FOREX PLANET
today XTIUSD analysis 👆
🟢This Chart includes_ (XTIUSD market update)
🟢What is The Next Opportunity on XTIUSD Market
🟢how to Enter to the Valid Entry With Assurance Profit
This CHART is For Trader's that Want to Improve Their Technical Analysis Skills and Their Trading By Understanding How To Analyze The Market Using Multiple Timeframes and Understanding The Bigger Picture on the Charts

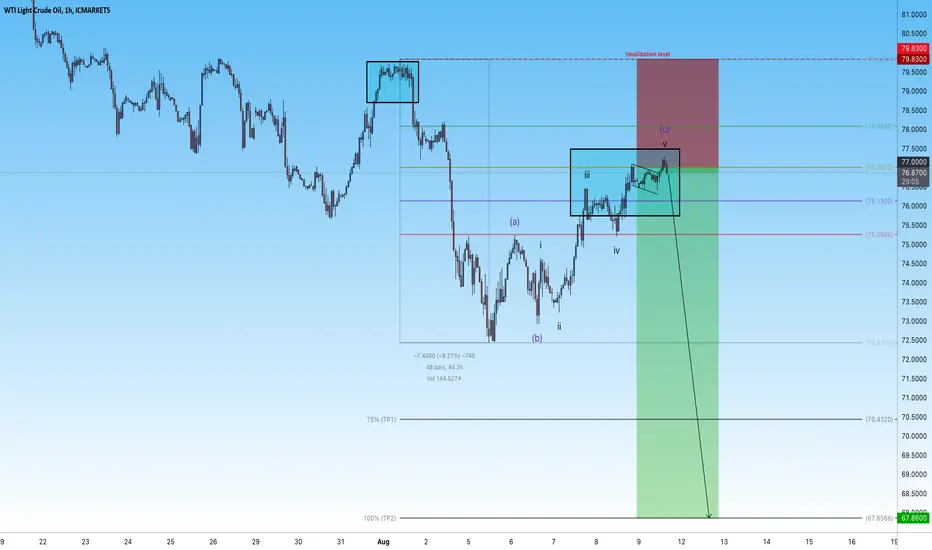
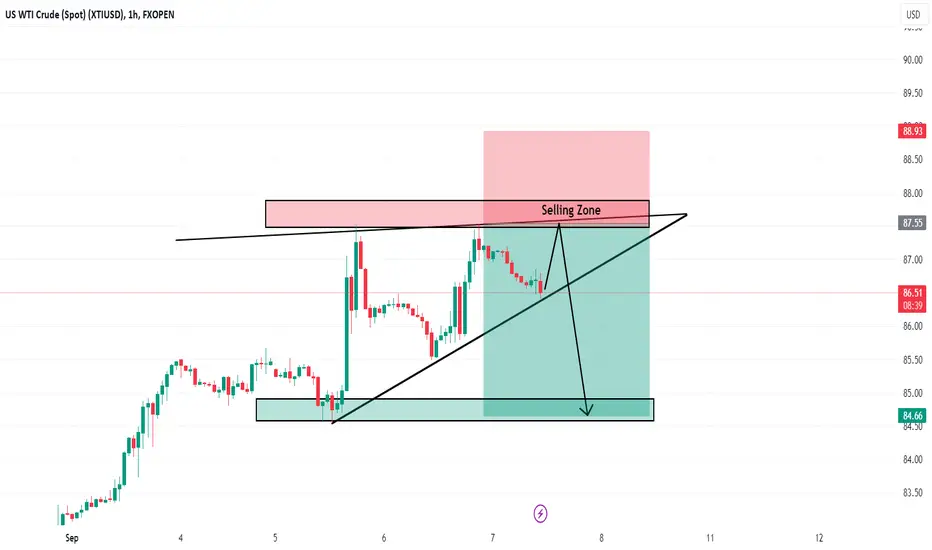
XTIUSD SELLHi fellow traders, XTIUSD is ready to make a move lower from the blue box after completing the ABC correction. Target the 67.86 level. Good luck and trade safe!
XTIUSD( US OIL ) LONG term Trade AnalysiHello Traders
In This Chart XTIUSD HOURLY Forex Forecast By Forex Planet
today XNGUSD analysis 👆
🟢This Chart includes_ (XTIUSD market update)
🟢What is The Next Opportunity on XTIUSD Market
🟢how to Enter to the Valid Entry With Assurance Profit
This Video is For Trader's that Want to Improve Their Technical Analysis Skills and Their Trading By Understanding How To Analyze The Market Using Multiple Timeframes and Understanding The Bigger Picture on the Charts.
XTIUSD( US OIL ) LONG term Trade Analysi
Hello Traders
In This Chart XTIUSD HOURLY Forex Forecast By Forex Planet
today XNGUSD analysis 👆
🟢This Chart includes_ (XTIUSD market update)
🟢What is The Next Opportunity on XTIUSD Market
🟢how to Enter to the Valid Entry With Assurance Profit
This Video is For Trader's that Want to Improve Their Technical Analysis Skills and Their Trading By Understanding How To Analyze The Market Using Multiple Timeframes and Understanding The Bigger Picture on the Charts.
XTIUSD( US OIL ) LONG term Trade AnalysisHello Traders
In This Chart XTIUSD HOURLY Forex Forecast By Forex Planet
today XNGUSD analysis 👆
🟢This Chart includes_ (XTIUSD market update)
🟢What is The Next Opportunity on XTIUSD Market
🟢how to Enter to the Valid Entry With Assurance Profit
This Video is For Trader's that Want to Improve Their Technical Analysis Skills and Their Trading By Understanding How To Analyze The Market Using Multiple Timeframes and Understanding The Bigger Picture on the Charts.
XTIUSD( US OIL ) LONG term Trade AnalysisNov 9
Hello Traders
In This Chart XTIUSD HOURLY Forex Forecast By Forex Planet
today XNGUSD analysis 👆
🟢This Chart includes_ (XTIUSD market update)
🟢What is The Next Opportunity on XTIUSD Market
🟢how to Enter to the Valid Entry With Assurance Profit
This Video is For Trader's that Want to Improve Their Technical Analysis Skills and Their Trading By Understanding How To Analyze The Market Using Multiple Timeframes and Understanding The Bigger Picture on the Charts.

XTIUSD ( US OIL ) LONG term Trade Analysis Hello Traders
In This Chart XTIUSD HOURLY Forex Forecast By Forex Planet
today XNGUSD analysis 👆
🟢This Chart includes_ (XTIUSD market update)
🟢What is The Next Opportunity on XTIUSD Market
🟢how to Enter to the Valid Entry With Assurance Profit
This Video is For Trader's that Want to Improve Their Technical Analysis Skills and Their Trading By Understanding How To Analyze The Market Using Multiple Timeframes and Understanding The Bigger Picture on the Charts.

XTIUSD ( US OIL ) LONG term Trade AnalysisHello Traders
In This Chart XTIUSD HOURLY Forex Forecast By Forex Planet
today XNGUSD analysis 👆
🟢This Chart includes_ (XTIUSD market update)
🟢What is The Next Opportunity on XTIUSD Market
🟢how to Enter to the Valid Entry With Assurance Profit
This Video is For Trader's that Want to Improve Their Technical Analysis Skills and Their Trading By Understanding How To Analyze The Market Using Multiple Timeframes and Understanding The Bigger Picture on the Charts.
XTIUSD( US OIL )LONG term Trade AnalysisHello Traders
In This Chart XTIUSD HOURLY Forex Forecast By Forex Planet
today XNGUSD analysis 👆
🟢This Chart includes_ (XTIUSD market update)
🟢What is The Next Opportunity on XTIUSD Market
🟢how to Enter to the Valid Entry With Assurance Profit
This Video is For Trader's that Want to Improve Their Technical Analysis Skills and Their Trading By Understanding How To Analyze The Market Using Multiple Timeframes and Understanding The Bigger Picture on the Charts.
XTIUSD( US OIL )LONG term Trade AnalysisSep 7
Hello Traders
In This Chart XTIUSD HOURLY Forex Forecast By Forex Planet
today XNGUSD analysis 👆
🟢This Chart includes_ (XTIUSD market update)
🟢What is The Next Opportunity on XTIUSD Market
🟢how to Enter to the Valid Entry With Assurance Profit
This Video is For Trader's that Want to Improve Their Technical Analysis Skills and Their Trading By Understanding How To Analyze The Market Using Multiple Timeframes and Understanding The Bigger Picture on the Charts.
XTIUSD( US OIL )LONG term Trade AnalysisHello Traders
In This Chart XTIUSD HOURLY Forex Forecast By Forex Planet
today XNGUSD analysis 👆
🟢This Chart includes_ (XTIUSD market update)
🟢What is The Next Opportunity on XTIUSD Market
🟢how to Enter to the Valid Entry With Assurance Profit
This Video is For Trader's that Want to Improve Their Technical Analysis Skills and Their Trading By Understanding How To Analyze The Market Using Multiple Timeframes and Understanding The Bigger Picture on the Charts.
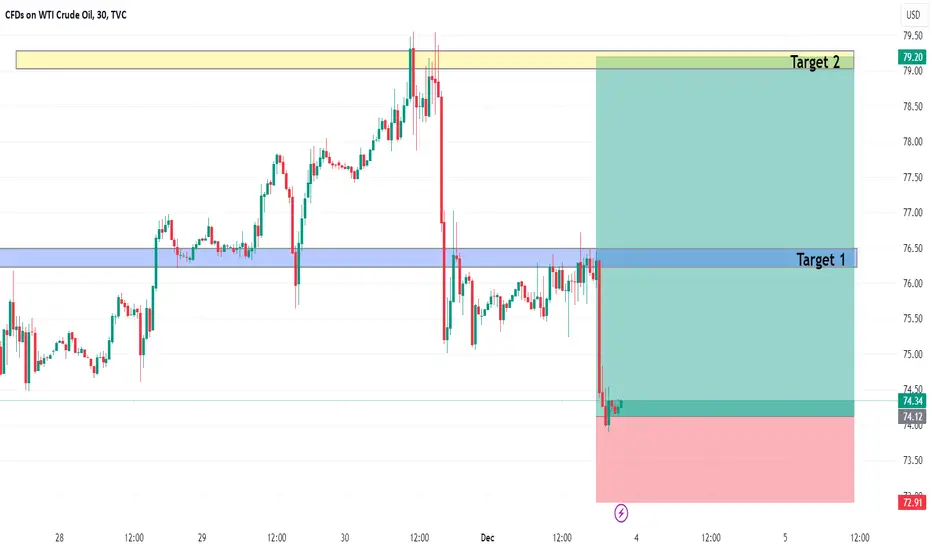
OIl Short In this short analysis, we will examine the recent price movement of oil within the range of $78.5 to $79 with a focus on the potential for a price reversal. We will explore key technical indicators, market sentiment, and other factors that suggest a possible shift in the oil's direction.
Price Movement Overview:
The oil market has seen a recent uptrend as the price climbed from $78.5 to $79. However, the current price range indicates a potential turning point, suggesting the possibility of a price reversal.
Technical Indicators:
Resistance Level: The $79 price level has acted as a significant resistance point in the recent past. Repeated failures to break above this level could signal a lack of bullish momentum and an increased probability of a reversal.
Overbought Conditions: If the price surge from $78.5 to $79 has been rapid and significant, technical indicators like the Relative Strength Index (RSI) or Stochastic Oscillator might signal overbought conditions. An overbought market often precedes a reversal as traders take profits, leading to a downward price correction.
Market Sentiment:
Market sentiment plays a crucial role in price reversals. As traders and investors become wary of the extended rally and potential resistance at $79, profit-taking and cautious approaches might be observed, adding selling pressure to the market.
Fundamental Factors:
Demand-Supply Balance: An analysis of the supply-demand dynamics could reveal potential imbalances in the oil market. If the demand outlook weakens or if there are signs of oversupply, it could influence traders' expectations for a price reversal.
Global Economic Indicators: The health of the global economy can impact oil prices. Any negative economic data or uncertainties could lead investors to reevaluate their positions, potentially triggering a reversal.
Caution for Traders and Investors:
For traders seeking a potential reversal, closely monitoring key technical levels and trendlines will be essential. Confirmation of a reversal signal through technical indicators and candlestick patterns can provide a stronger basis for making trading decisions.
Conclusion:
The oil price movement from $78.5 to $79 indicates the potential for a reversal as the market approaches a critical resistance level and may experience profit-taking and cautious sentiment. However, traders should be cautious and use additional technical and fundamental analyses to confirm a reversal before making trading decisions.
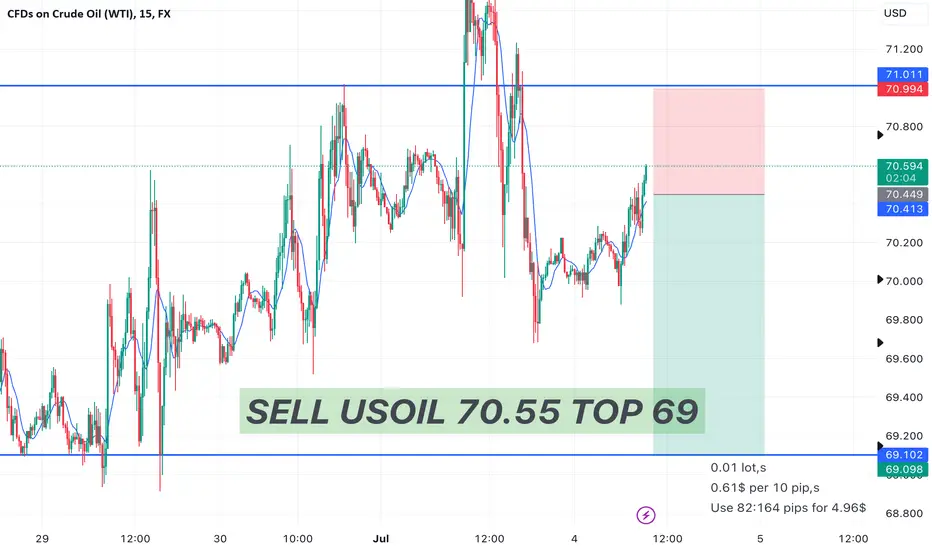
USOIL Day Trade Short 70.55 Top 69TVC:USOIL
USOIL SELL 70.55 TOP 69
The economy is slowing down and oil need is also reducing. The resistance is at 70.6 and Very strong resistance at 71. So it can go down and long term perspective oil will go down until and unless OPEC makes the production cuts in the oil.
XTIUSD ( US OIL ) LONG term Trade AnalysisHello Traders
In This Chart XTIUSD HOURLY Forex Forecast By Forex Planet
today XNGUSD analysis 👆
🟢This Chart includes_ (XTIUSD market update)
🟢What is The Next Opportunity on XTIUSD Market
🟢how to Enter to the Valid Entry With Assurance Profit
This Video is For Trader's that Want to Improve Their Technical Analysis Skills and Their Trading By Understanding How To Analyze The Market Using Multiple Timeframes and Understanding The Bigger Picture on the Charts.
XTIUSD ( US OIL ) LONG term Trade Analysis Hello Traders
In This Chart XTIUSD HOURLY Forex Forecast By Forex Planet
today XNGUSD analysis 👆
🟢This Chart includes_ (XTIUSD market update)
🟢What is The Next Opportunity on XTIUSD Market
🟢how to Enter to the Valid Entry With Assurance Profit
This Video is For Trader's that Want to Improve Their Technical Analysis Skills and Their Trading By Understanding How To Analyze The Market Using Multiple Timeframes and Understanding The Bigger Picture on the Charts.

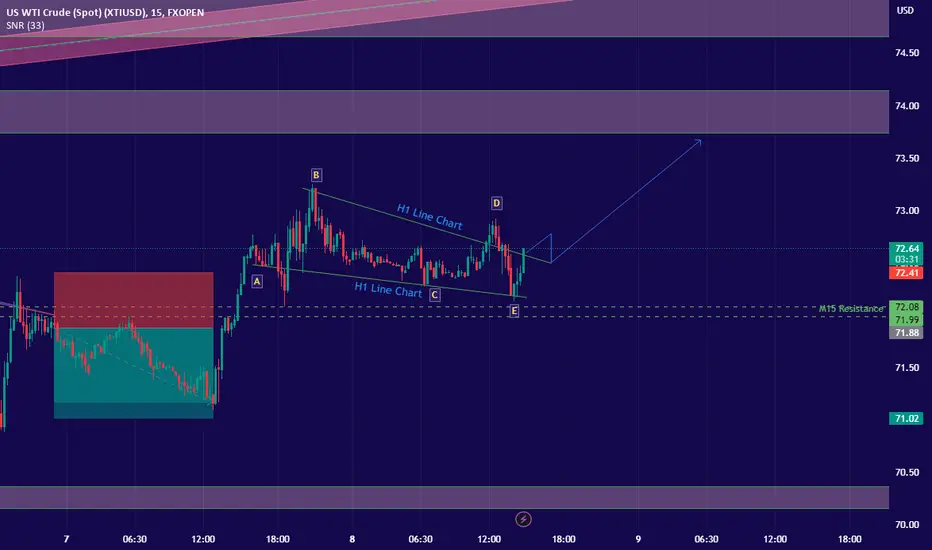
XTIUSD BuyAs we have seen in gold that gold has formed a triangle patteren and now if we see at Crude Oil its also forming this wedge and has complete its E wave after completion of ABCD now it will be going Upwards so we will buying this commodity after it breaks 72.89 level and price sustain there then it will be a bullish move to 73.74 price level so we wil be waiting for price action while am posting this idea seems like there is a Bullish engulfing or morubozu is forming On H1 time frame so we will until we get a clear Price action too..
XTIUSD CRUDOIL USOIL Latest AnalysisHI TO ALL
THIS IS AHMAD DOIN TRADING FROM LAST 9 YEARS AND GIVING TEACHING FROM LAST 3 YEARS AND THIS IS GOOD AND PERFECT ANALYSIS
this is specially to my friend
*** FRAZ ***
THIS IS 16 march 2023 crude oil

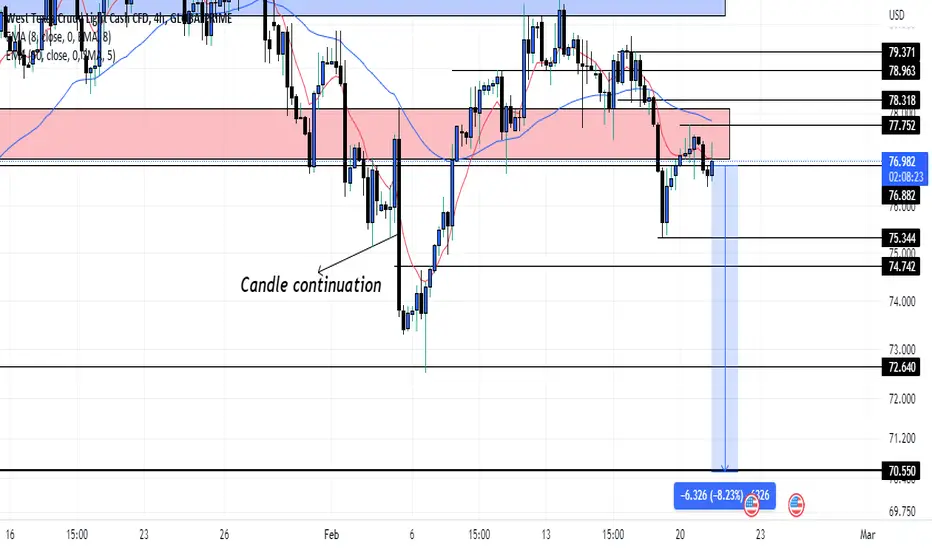
XTIUSD...SELL (8% Drawdown)From last weeks market expected a sell on Xtiusd. Price formed a range between$ 80.1 and $77. Looking forward to a strong sell on XTIUSD to continue the 4H candle on Friday 3rd feb, during the NY session. A strong bearish/ bullish candle always has a momentum it follows.
NB: a complete reversal off my rejection zone ( Red Box)