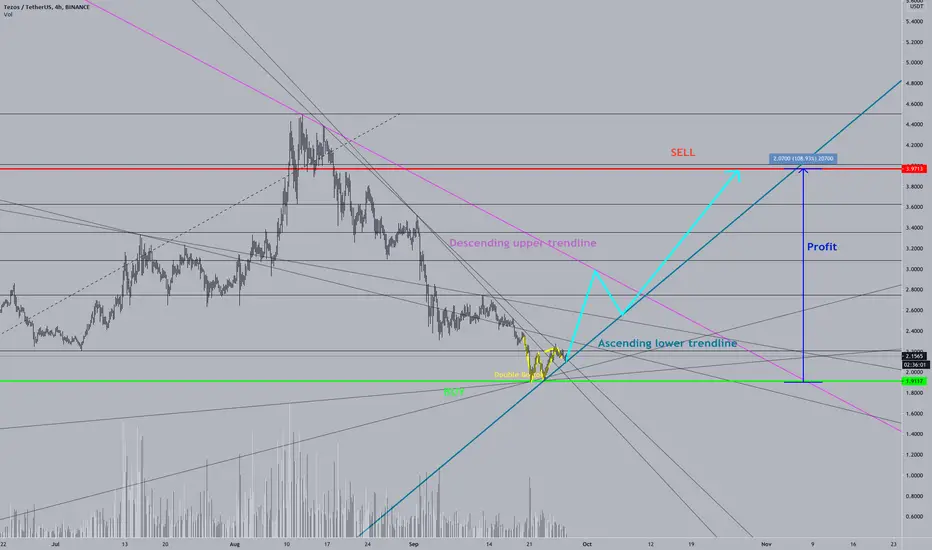
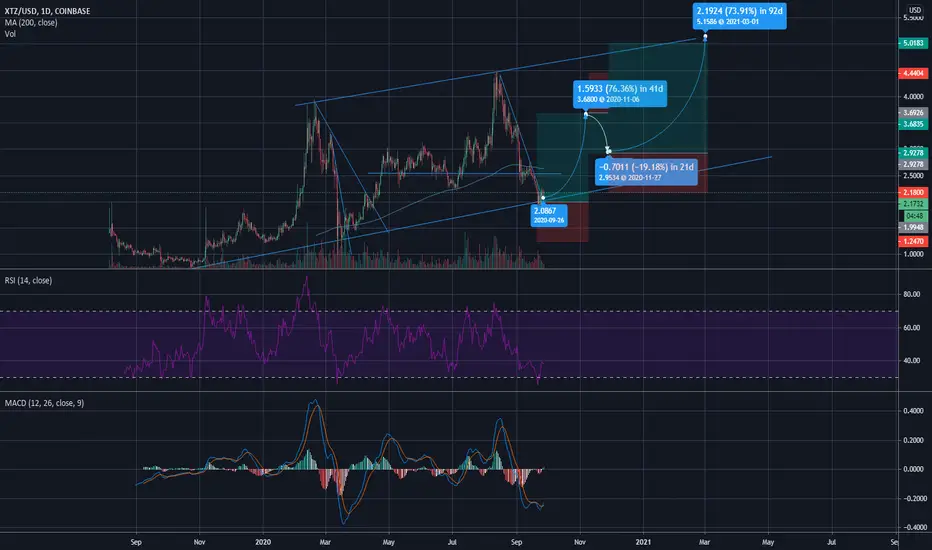
XTZ/USD {Parallel channel Analysis}Hi every one
no need to say something , chart is speaking it self .
Remember that the trend is our friend and we have to take his hand and go with him.
Traders, if you like this idea or have your opinion about it, write in the comments. We will be happy
Things can change...
The markets are always changing and even with all these signals, the market changes tend to be strong and fast
Thank you for seeing idea . please support us
Good luck.
XTZUSD

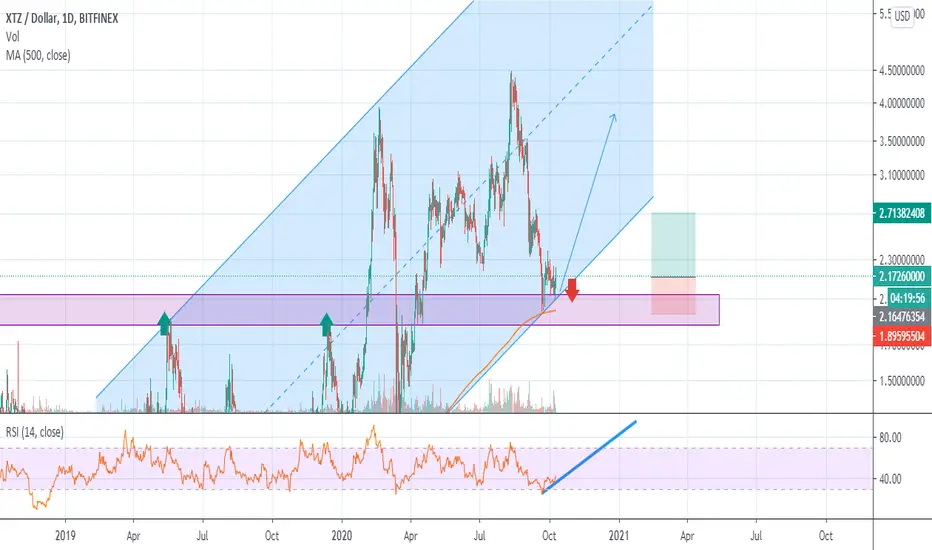
Tezos trading range XTZ is trading in a rising trend channel, and is now nearing it's support zone.
The green box is a good place to set buy orders for a potential move to the 0.382 fib, which coincides whit the upper trend channel line.
Tezos is a looser longXTZ broke so many hodlers hearts, so I decide to long this little coin to previos highs.
Stops and target prices are on the map, please enjoy =^_^=

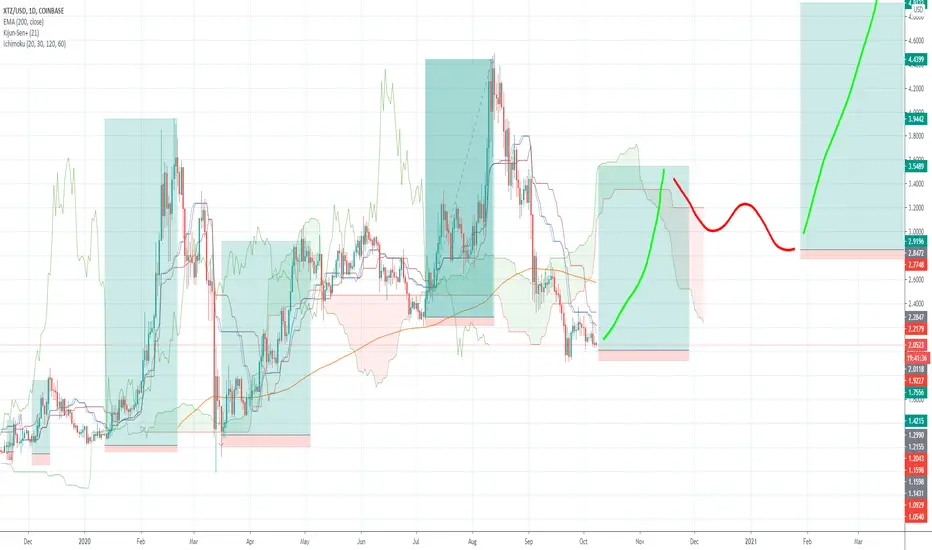
Expecting XTZ to continue following the same patternXTZ closing in on a massive 2 month consolidation after making new ATHs. Looking back, we have seen this pattern repeatedly, and will be looking for another big upside from these levels to new ATH once again.
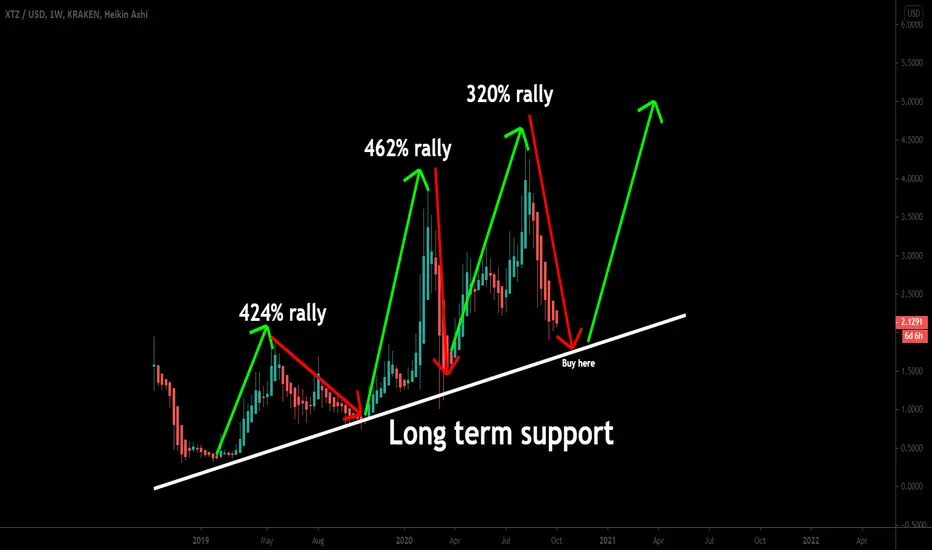
It can be the best buying opportunity at this supportPrice action of XTZ has found a very long term support on weekly chart. And this time priceline is again moving down towards this support.
On daily chart the priceline is moving within a down channel. The moon phases indicator is showing new dark moon appeared above support of channel and new full moon is at the resistance. The priceline is likely to be rejected by the resistance.
On short term 4 hour chart a perfect down trend can be seen.
On more short term hourly chart the priceline was moving in an up channel but broke down the support of this channel as well.
Conclusion:
On short term charts the priceline is turned bearish. On daily chart it is likely to move down after being rejected by the resistance of the channel. On long term weekly chart there is more cushion to drop more up to the support of long term support. Therefore when Tezos will be at the long term support that can be the best buying time.
XTZUSDT moving down to Supports @ 1.9, 1.6-1.7 & 1.2As stated in my previous post, XTZUSDT did not stay above the diagonal lines and wasn't supported by the rings either, so bulls failed to hold. Currently XTZUSDT is heading down to 1.9 support, and may consequently move down to support rings at 1.6/1.7 and possibly move to 1.2 support if bears win! #TradeCarefully

Tezos! Finally. XTZUSDHere's looking at XTZUSD. After a number of false starts (?X waves) we, I believe, are looking at another impulse in the making. Gaining higher highs, and consistently in positive momentum. There are many, many fractals that will see themselves paint themselves out in the next coming days or weeks. As usual- FibGoals are our golden goals. NFA.
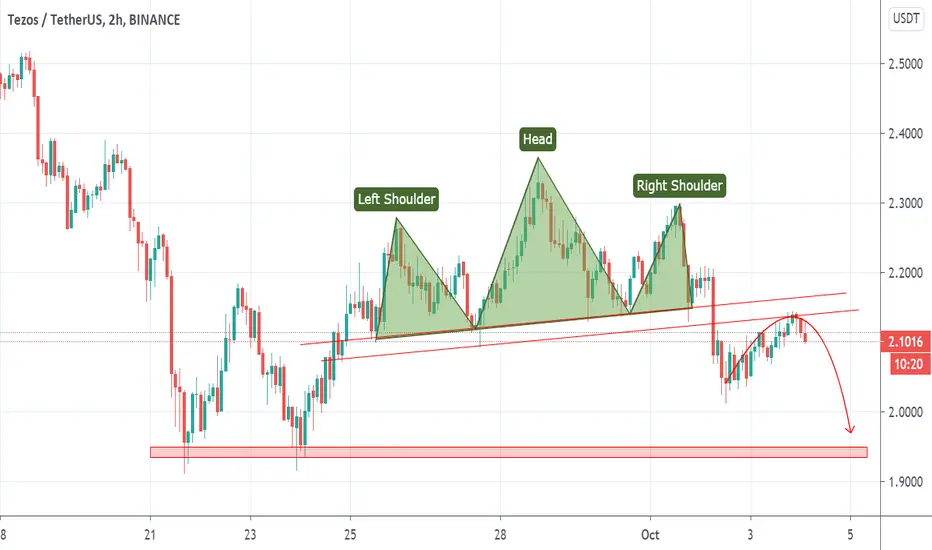
Xtz Results Cheers....
Check My Old Analysis, I Told U To Watch The Neckline, If Price Brecks The Neckline Then Go For Short.Now Target. Achieved,
Chart Works Nicely...

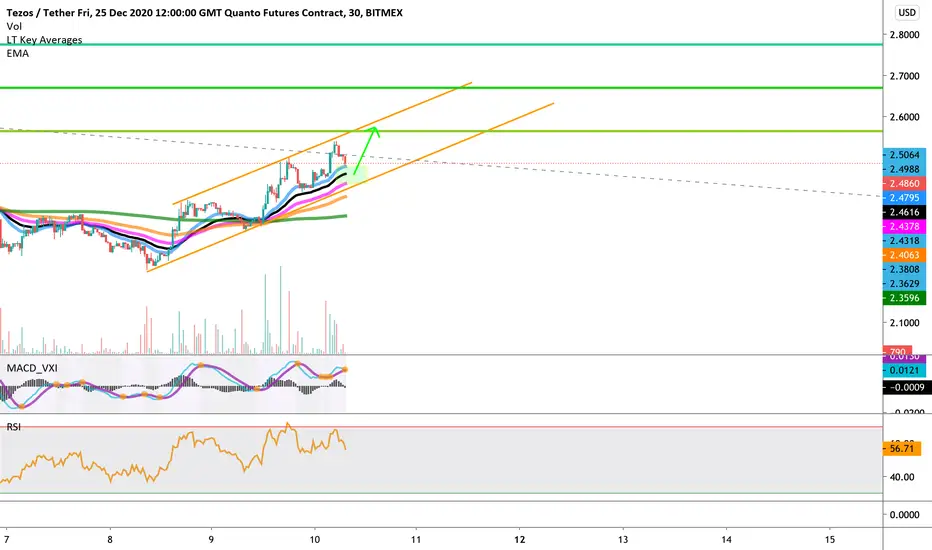
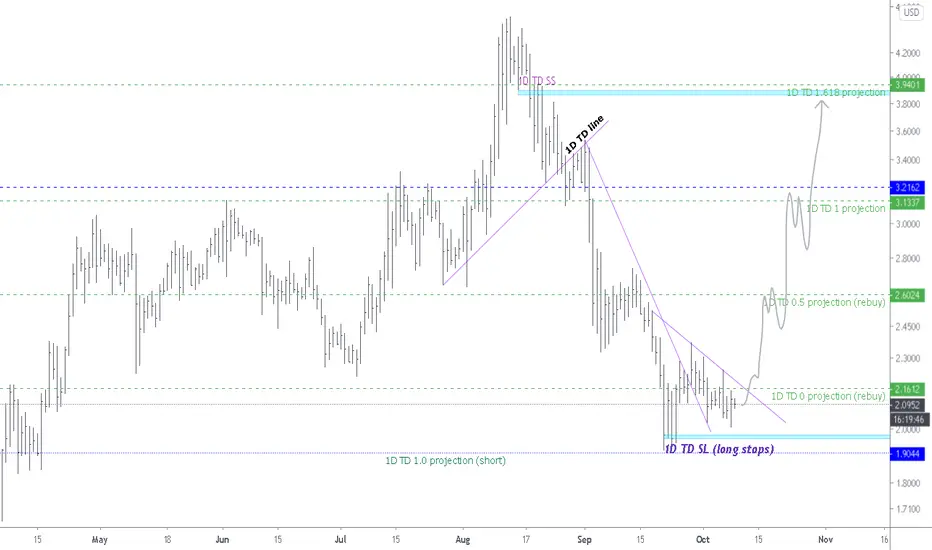
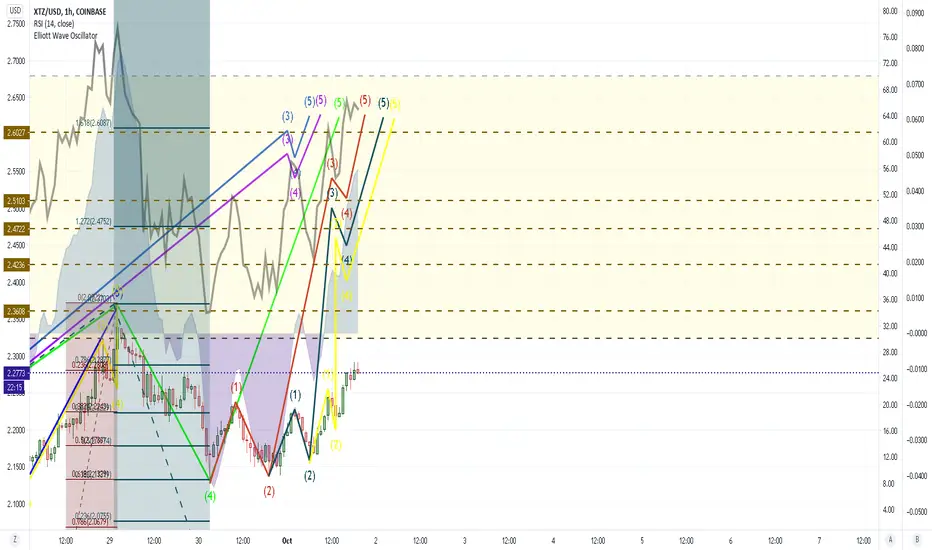
XTZUSD Elliot Wave AnalysisWe are in the ABC correction waves stage. B is considered over. I am waiting for a rise for C wave. First Target: Around 2.52.
----- > If it falls below 1.92, the count is broken


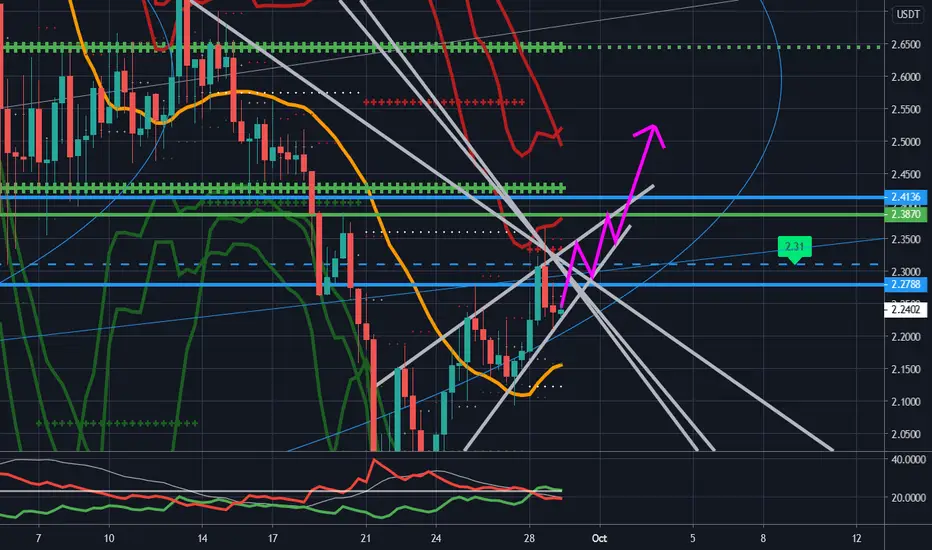
XTZUSDT, ACCENDING TRIANGULAR CHANNEL FORMED...IF XTZUSDT CAN BREAK ABOVE THE DIAGONAL RESISTANCE THEN IT MAY BE SUPPORTED BY THE FIB RING AND FAN AND HEADING UP TO THE NEXT RESISTANCE POINT 2.7xxx, ELSE IT MAY GO DOWN TO 2.0-2.2 FOR A RETEST CONFIRMATION OF STRONG SUPPORT! TRADE CAREFULLY!
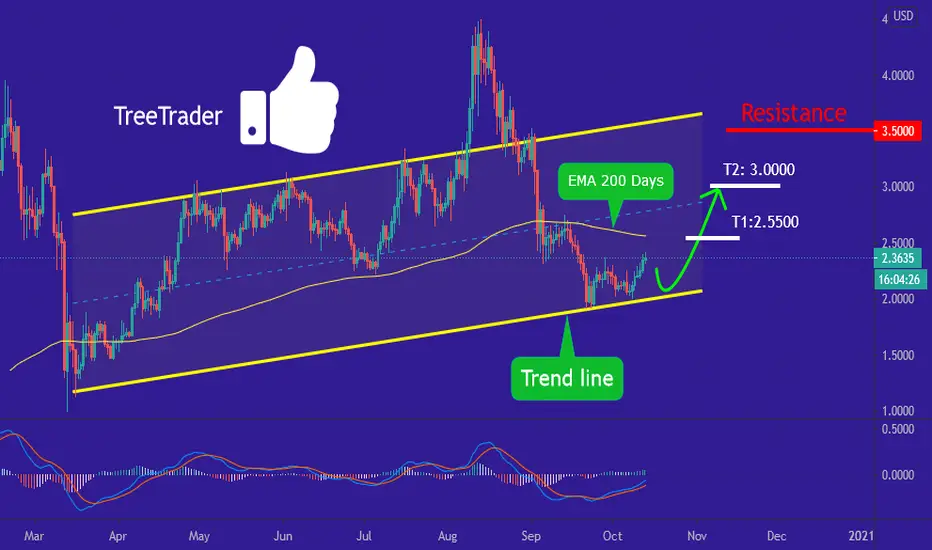
XTZ 20% tradeHello, traders
XTZ is testing the short-term resistance line, and if we break that level the next target will be the next important resistance level!
Based on the distance from 100 MA we believe the price will come back to test that line as resistance in the short term.
Bullish Diverce RSR
Good luck.


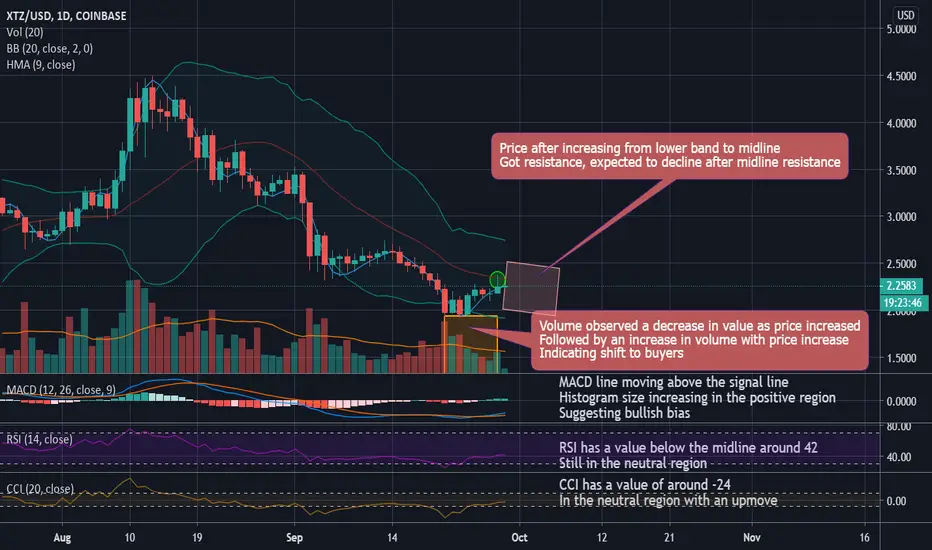
XTZUSD to see a slight downtrend(1D) | Midline rejectionMarket in last 1 week
XTZUSD saw an uptrend after getting lower band support reaching midline
Price volatility was very high. The market moved ~23.41%, between $2.36 and $1.91
Today’s Trend analysis
XTZUSD expected to see a slight downtrend as the price after trading between midline and lower band got midline rejection
Price at time of publishing: $2.27
XTZ’s market cap: $1.71 Billion
Oscillator indicators are mostly neutral. RSI at 42
Moving average indicators are biased towards a downtrend. Ichimoku Cloud is neutral and Hull MA indicates a buying opportunity
Volume indicators saw a decrease in volume as price increased followed by increase in volume with price increase
Price expected to see a slight downtrend as the price after trading between midline and lower band got midline rejection. Most of the Oscillator indicators are neutral. MACD line moving above the signal line with histogram size increasing in the positive region, suggesting a bullish bias. RSI at 42, below the midline in the neutral region. CCI is around -24, in the neutral region with an upmove. Another interesting point to notice here is that volume saw a decrease in volume as price increased followed by increase in volume with price increase indicating a shift to buyers.
----------------------------------------------------------------------------------------
The analysis is based on signals from 28 technical indicators, out of which 17 are moving averages and remaining 11 are oscillators. These indicator values are calculated using 1 D candles.
DM to get details of the above analysis and list of indicators & their values used to arrive at the above conclusion.
Note: Above analysis would hold true if we do not encounter a sudden jump in trade volume .
----------------------------------------------------------------------------------------
If you find the analysis useful, please like and share our ideas with the community!
- Mudrex
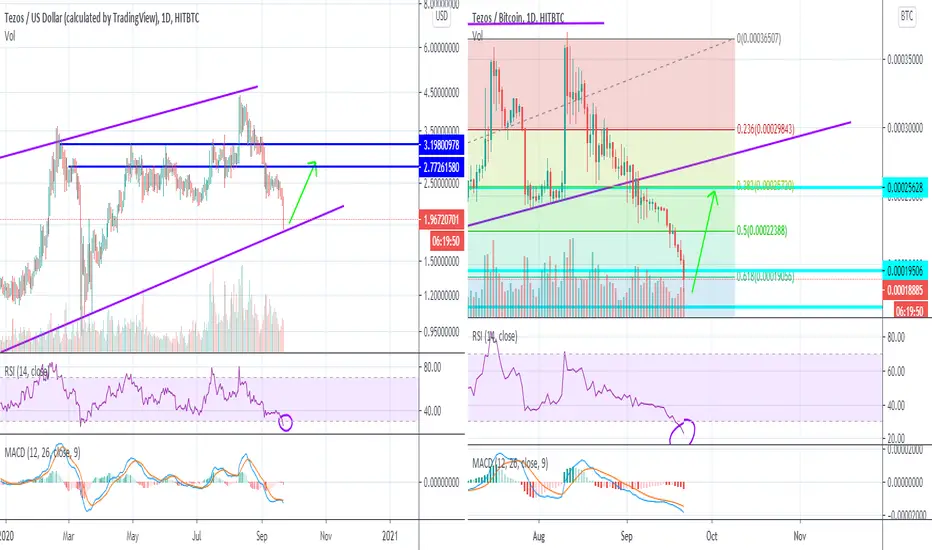
Tezo's extremely oversoldOn the XTZUSD chart, we are hitting this MAJOR trendline. I imagine this will hold as support and we will move higher from here. You can also see that RSI is extremely oversold which would also indicate a move off this $2 area.
If we coincide this with the XTZBTC cross, we can see that RSI is also very oversold here and hitting this .618 fib line. this should also produce a bounce.
Tezos's has now gone down almost 50% in just a month. It's definitely oversold.
Look for bounces targetting this $3 area. Once we get there we can see if it's due for a much larger run up in the near term.
Cheers,
-Sherem
Tezos next cycle planIf history repeats itself. If bitcoin can go above 20k within this time period or Tezos starts defi hype, then the moon in the limit. If not, we will be trading within this channel and I will be getting my sell button ready every time we cross 70 on the RSI and buy on the way down to increase my stack. Tezies til we bezies boiz.
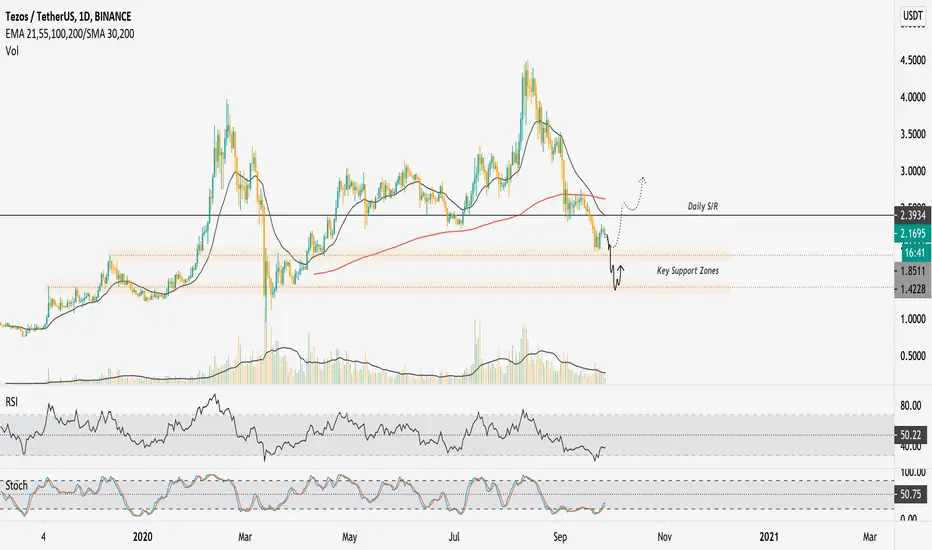
XTZ/USDT | Trend Analysis | Key Levels | Oversold Bounce Todays Analysis – XTZ/USDT – finding support at a structural level with an oversold bounce.
Points to consider:
- Strong Downtrend
- Bearish PA
- Oscillators below 50
XTZ has found support after an impulse sell within this steep downtrend, further continuation into daily resistance is probable.
However, price action is looking weak and bearish. Even with a relief rally, price will need to reclaim daily s/r and consolidate above the 21 EMA at the least to signify trend reversal.
Failing to hold this support, price is likely to have further continuation into the $1.4 support level – a good place for long-term accumulation IMO.
Oscillators are below 50, this indicates weakness in the market as we continue to tread into oversold conditions.
Overall, in my opinion, further price development will indicate the direction of the next impulse.
If you’ve read this far - thank you for following my work!
And as always,
Focus on you, and the money will too!
+100% Profit with XTZ by the end of October 2020? (Updates)Updates on my old idea (LEVEL 0.786 almost always works with XTZ).
The chart is looking good. I am even more confident right now.
* You owe me a coffee if this prediction works.