XVG/USDT — Symmetrical Triangle at Apex: Breakout?Pattern & Overview
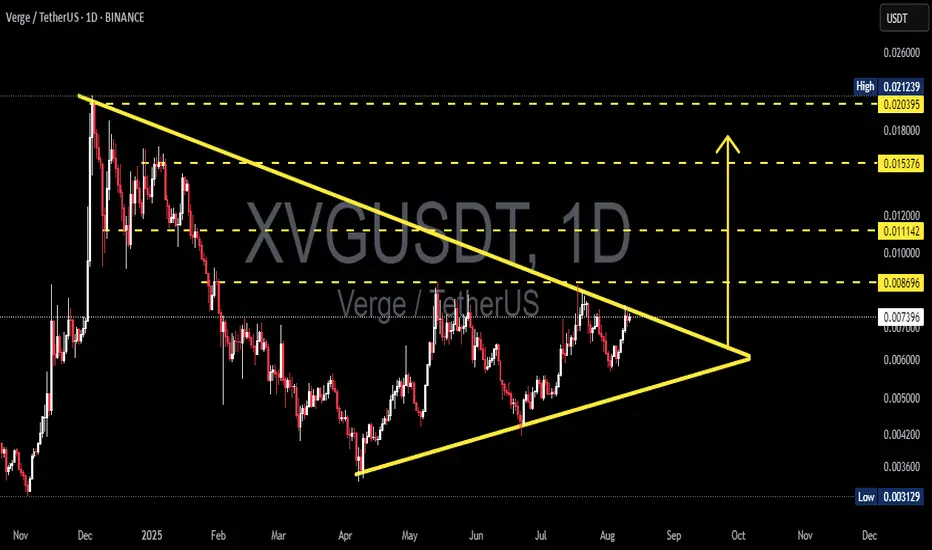
The XVG/USDT daily chart is forming a symmetrical triangle — descending resistance from the Dec 2024 high and ascending support from the April 2025 low. Price is now around 0.00743 USDT, nearing the apex, indicating reduced volatility and an increased chance of a sharp breakout soon.
Pattern characteristics:
Higher lows (rising support line) suggest accumulation.
Lower highs (descending resistance) indicate continued supply overhead.
Volume usually contracts within the pattern; a valid breakout is often confirmed by a volume spike.
---
Key Levels (marked on chart)
Resistances / potential upside targets: 0.008696 (immediate), 0.011142, 0.015376, 0.020395, up to ~0.02124 (high).
Critical supports / breakdown levels: ascending trendline (~0.005–0.0055 zone) and historical low at 0.00313.
---
Bullish Scenario (confirmation & targets)
Confirmation: daily close above the descending resistance + increased buy volume. Ideally, wait for a daily close above 0.0080–0.0087 (breakout zone) before adding positions.
Measured targets (from current ~0.007428):
Target 1: 0.008696 → +≈17.1%
Target 2: 0.011142 → +≈50.0%
Target 3: 0.015376 → +≈107.0%
Example trade plan:
Conservative entry: after daily close > 0.0087.
Conservative stop: below breakout retest / under 0.0066 → stop ≈ -11.15%; R:R to Target 1 ≈ 1.5:1, to Target 2 ≈ 4.5:1.
Aggressive entry: buy now (~0.00743), stop below ascending trendline (~0.0055) → stop ≈ -25.96%; R:R to Target 1 ≈ 0.66:1 (higher risk).
---
Bearish Scenario (confirmation & targets)
Confirmation: daily close below the ascending trendline (~0.005–0.0055 zone) with increased sell volume. If confirmed, price could drop toward:
First support: 0.0050 → ≈-32.7% from current price.
Strong support: 0.0042 → ≈-43.5%.
Worst-case retest of historical low: 0.00313 → ≈-57.9%.
Short/Cut-loss strategy: wait for a confirmed close below support, then enter on a pullback/retest with stop above the retest level.
---
Risk Management
Symmetrical triangles can have false breakouts — always wait for confirmation (daily close + volume).
Limit risk per trade (e.g., 1–2% of capital). Adjust position size based on stop distance.
Take profits in stages: e.g., 30–50% at first resistance, another 30% at second resistance, trail the rest.
Keep an eye on news, listings, or on-chain events — crypto reacts strongly to short-term fundamentals.
> XVG is forming a contracting symmetrical triangle on the daily chart. Higher lows vs. lower highs — price is approaching the apex.
Bullish: daily close above 0.0080–0.0087 with volume → targets 0.0087 / 0.0111 / 0.0154 (+17% / +50% / +107% approx).
Bearish: daily close below rising support (~0.005–0.0055) → possible drop to 0.005 / 0.0042 / 0.00313 (-26% to -58% approx).
Wait for confirmation, manage your risk, and scale out profits. 📉📈
#XVG #Verge #XVGUSDT #Crypto #TechnicalAnalysis #Triangle #Breakout #Altcoins #RiskManagement
Xvganalysis
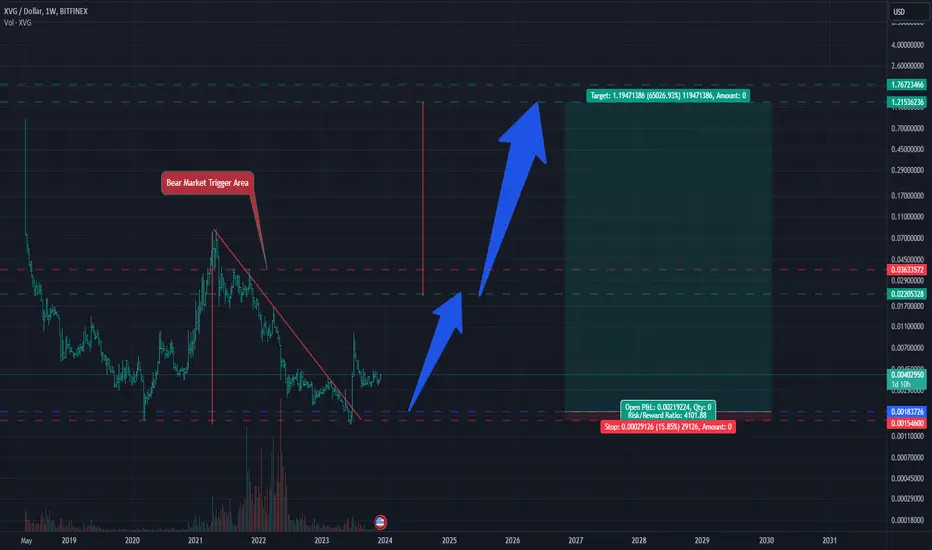
XVG showing a very impressive investment opportunityHi Everyone;
today we have one of the best risk to reward Investment opportunity
it is more than 4100 times the risk and the chart is look very promising.
I expect breaking the previous bear market key point will clear the way to the final target
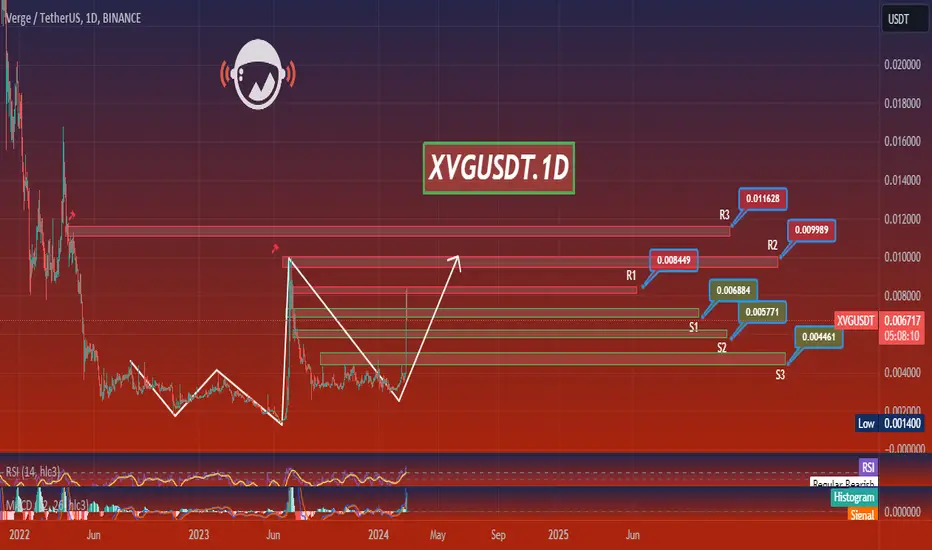
XVGUSDT.1DBased on the provided market data, the XVG is currently trading at 0.0069 USDT. The 4-hour indicators suggest a bullish trend, with the Relative Strength Index (RSI) at 75.33, which is above the typically overbought level of 70. This could indicate that the market is currently overbought, and a price correction might be imminent. The Moving Average Convergence Divergence (MACD) is also positive, suggesting a bullish momentum.
The daily indicators show a similar trend, with an RSI of 91.92, which is significantly overbought, and a positive MACD. The 7-day indicators, however, show a slightly less bullish trend, with an RSI of 76.31 and a smaller MACD.
The current price is below the 4-hour, daily, and 7-day Bollinger Bands upper limit, indicating that the market is not overextended. The fact that the current price is closer to the resistance levels than the support levels suggests a bullish sentiment in the market.
However, it's important to note that the RSI is significantly overbought on both 4-hour and daily timeframes, and near the overbought level on a 7-day timeframe. This could suggest that the market is due for a correction, and the price may fall to closer to the support levels in the near future.
In conclusion, while the market is showing a strong bullish trend, the overbought RSI levels suggest that a price correction may be imminent. It's important to watch the market closely for any signs of a reversal. As always, it's crucial to use this analysis alongside your own research and consider other factors such as news events and market sentiment before making any trading decisions.
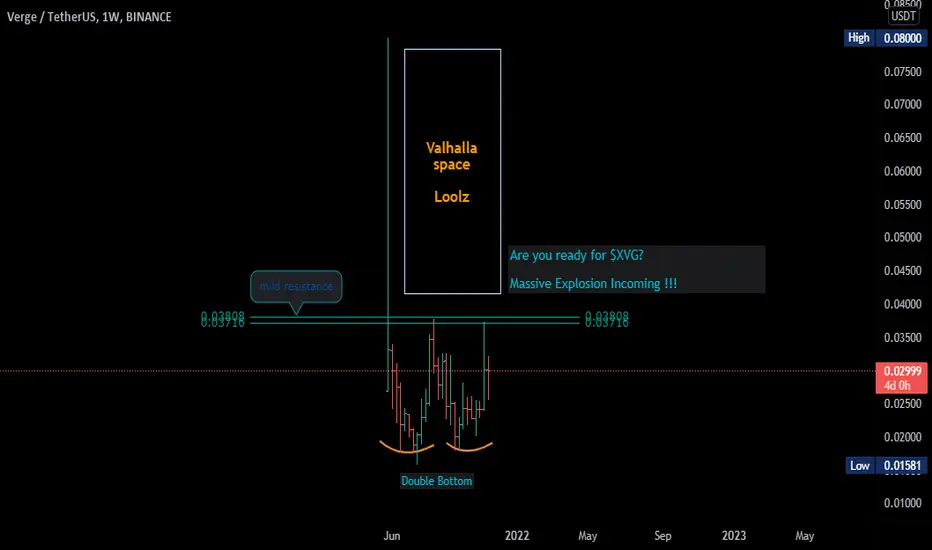
XVG To Blow Our Minds 🚀🚀XVGUSDT | Weekly:
Verge Currency is a decentralized open-source cryptocurrency which offers various levels of private transactions. It does this by obfuscating the IP addresses of users with Tor and by leveraging stealth transactions making it difficult to determine the geolocation of its users
Verge (XVG) is an open-source, decentralized cryptocurrency that claims to offer completely anonymous transactions by obfuscating the location and the Internet Protocol (IP) address of the transacting participants.
✔️ Double bottom
✔️ Daily Cup and Handle in progress
✔️ All time high yet to hit again .
Are you guys ready for this explosion?
Follow 🚶 @CryptonKidd for daily unbiased analysis , with 98% success rate
If Break 1 Zone We Can See 8 Cent1st and 2nd zones are powerful resistances. If 1st zone breaks we can see 2nd zone testing. If 2nd zone breakout happens we can see much bigger blown.

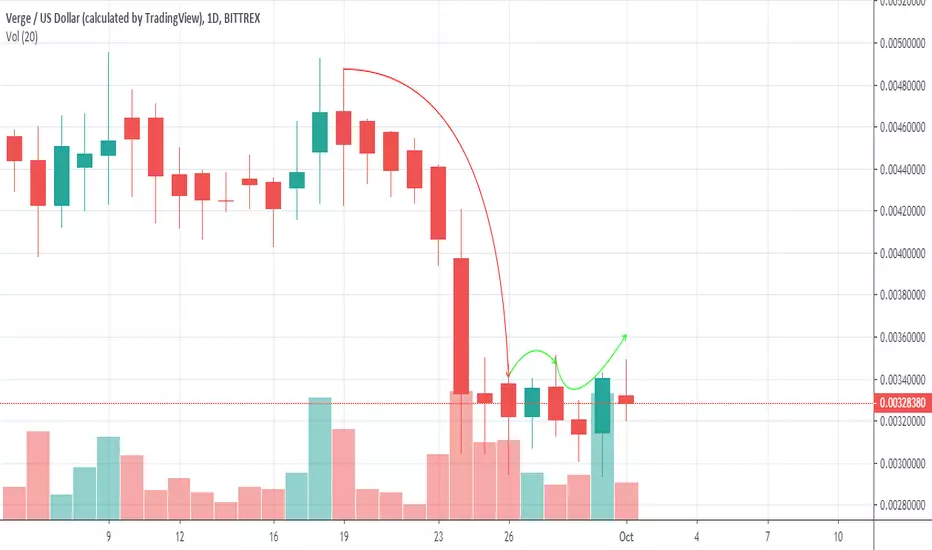
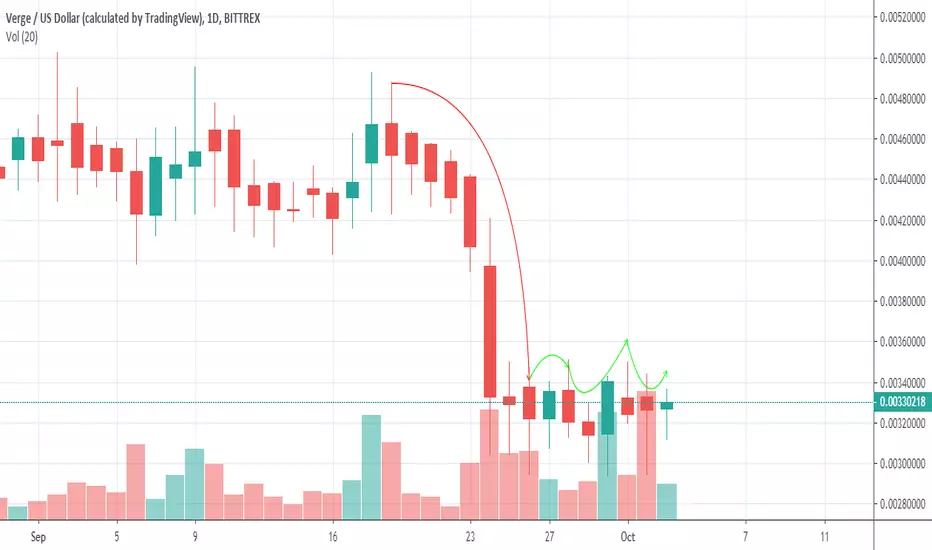
Price is Moving down after 15% IncreaseThe cash is floating between the estimation of the money is drifting between the value scope of $0.003100 to $0.003300 for the most part. On the first of October, the cash even contacted the cost of $0.003456 at 09:59 UTC and this expansion in the incentive by 18.39%. The cash remained around the worth some time however after some time the money again began to diminish.
Prior to this, the estimation of the cash was exchanging underneath the gauge in the market and on 26th September the money was exchanging at the estimation of $0.002973 at 16:30 UTC. Following two days the money was expanded by 15.66% and the worth stretched around $0.003439 at 10:50 UTC on 28th September. Be that as it may, the worth again definitely dropped by 14.32% on Monday, 30th September. The money arrived at a low estimation of around $0.002943 at 07:15 UTC.
News Source: TheCoinRepublic
XVG Will Bears turn to Bulls?The cash has experienced good and bad times in the market a week ago. The money began with this week with $0.004269 at 10:24 UTC and the market capitalization of the cash is $68,097,074 on Monday 22nd September. On Tuesday, the money drifting between the estimations of $0.0039 to $0.0041, anyway the cash experience bearish weight on Wednesday and the money's worth reach up to the estimation of $0.003293 at 10:24 UTC.
On Thursday, the estimation of cash again began to wait between the value scope of $0.0031 to $0.0034 and on Friday, the money worth was somewhat steady around the estimation of $0.0032. On Saturday, the money arrived at the estimation of $0.003529 at 16:24 and the market capitalization of the cash was $56,329,212, however the money doesn't remain there for long. Then again, the money esteems again began to exchange between the scope of $0.0031 to $0.0033 on Saturday and Sunday.
Verge Price Analysis and Technical Analysis: As we notice that the cash is moving with the bullish development in the market, yet the money can't break out the SMA of 10-day and 20-day. The moving midpoints are indicating solid sell flag in the market. The estimation of RSI is 36 and it is indicating neither green nor red sign and stays nonpartisan. Then again, MACD of the 12 and 26 levels are in the red zone and the sell sign is on.
News Source: TheCoinRepublic