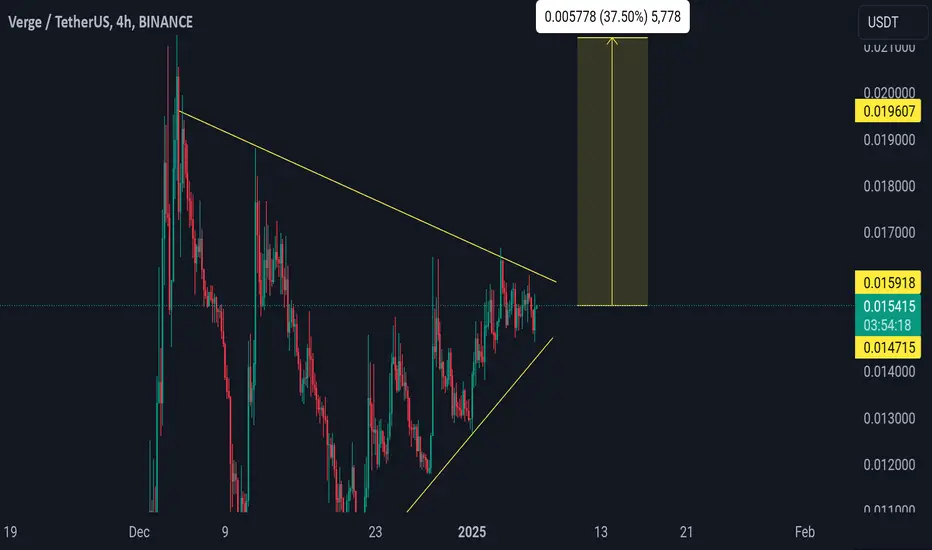
XVG/USDT — Symmetrical Triangle at Apex: Breakout?Pattern & Overview
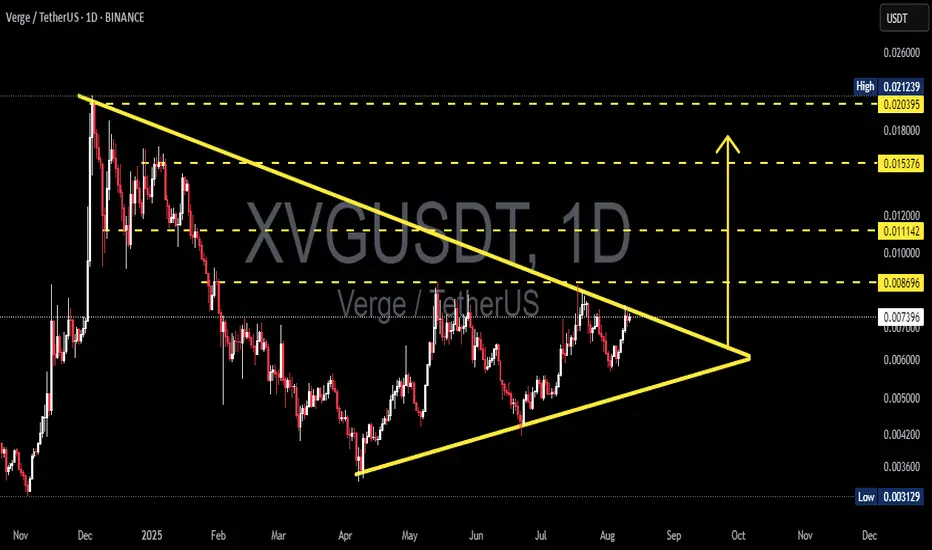
The XVG/USDT daily chart is forming a symmetrical triangle — descending resistance from the Dec 2024 high and ascending support from the April 2025 low. Price is now around 0.00743 USDT, nearing the apex, indicating reduced volatility and an increased chance of a sharp breakout soon.
Pattern characteristics:
Higher lows (rising support line) suggest accumulation.
Lower highs (descending resistance) indicate continued supply overhead.
Volume usually contracts within the pattern; a valid breakout is often confirmed by a volume spike.
---
Key Levels (marked on chart)
Resistances / potential upside targets: 0.008696 (immediate), 0.011142, 0.015376, 0.020395, up to ~0.02124 (high).
Critical supports / breakdown levels: ascending trendline (~0.005–0.0055 zone) and historical low at 0.00313.
---
Bullish Scenario (confirmation & targets)
Confirmation: daily close above the descending resistance + increased buy volume. Ideally, wait for a daily close above 0.0080–0.0087 (breakout zone) before adding positions.
Measured targets (from current ~0.007428):
Target 1: 0.008696 → +≈17.1%
Target 2: 0.011142 → +≈50.0%
Target 3: 0.015376 → +≈107.0%
Example trade plan:
Conservative entry: after daily close > 0.0087.
Conservative stop: below breakout retest / under 0.0066 → stop ≈ -11.15%; R:R to Target 1 ≈ 1.5:1, to Target 2 ≈ 4.5:1.
Aggressive entry: buy now (~0.00743), stop below ascending trendline (~0.0055) → stop ≈ -25.96%; R:R to Target 1 ≈ 0.66:1 (higher risk).
---
Bearish Scenario (confirmation & targets)
Confirmation: daily close below the ascending trendline (~0.005–0.0055 zone) with increased sell volume. If confirmed, price could drop toward:
First support: 0.0050 → ≈-32.7% from current price.
Strong support: 0.0042 → ≈-43.5%.
Worst-case retest of historical low: 0.00313 → ≈-57.9%.
Short/Cut-loss strategy: wait for a confirmed close below support, then enter on a pullback/retest with stop above the retest level.
---
Risk Management
Symmetrical triangles can have false breakouts — always wait for confirmation (daily close + volume).
Limit risk per trade (e.g., 1–2% of capital). Adjust position size based on stop distance.
Take profits in stages: e.g., 30–50% at first resistance, another 30% at second resistance, trail the rest.
Keep an eye on news, listings, or on-chain events — crypto reacts strongly to short-term fundamentals.
> XVG is forming a contracting symmetrical triangle on the daily chart. Higher lows vs. lower highs — price is approaching the apex.
Bullish: daily close above 0.0080–0.0087 with volume → targets 0.0087 / 0.0111 / 0.0154 (+17% / +50% / +107% approx).
Bearish: daily close below rising support (~0.005–0.0055) → possible drop to 0.005 / 0.0042 / 0.00313 (-26% to -58% approx).
Wait for confirmation, manage your risk, and scale out profits. 📉📈
#XVG #Verge #XVGUSDT #Crypto #TechnicalAnalysis #Triangle #Breakout #Altcoins #RiskManagement
Xvgusdtbuy
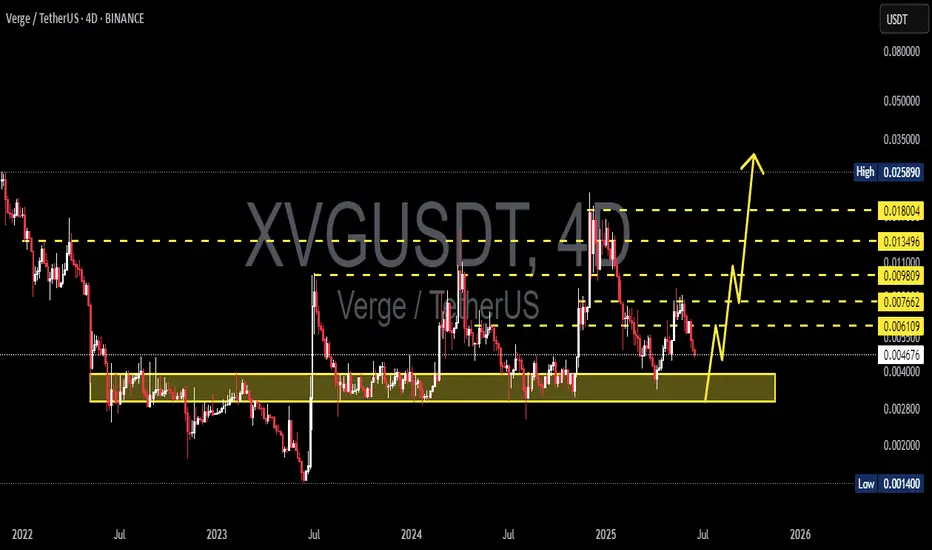
XVGUSDT 4D AnalysisXVG ~ 4D Analysis
#XVG Buy back on retest of this support block with short term target of at least 20%+ from this support.
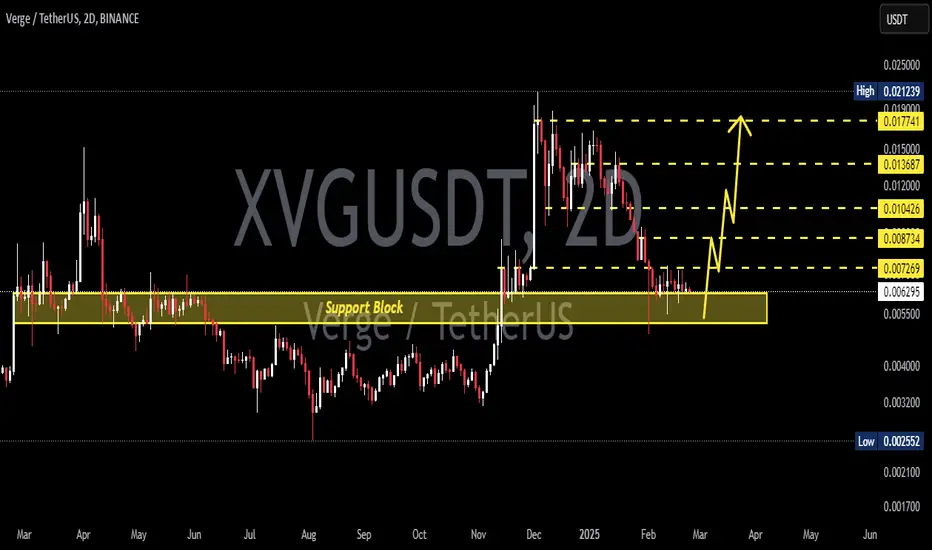
XVGUSDT 2DXVG ~ 2D Analysis
#XVG Buy gradually from here with a short -term target of at least 15%+. This is the previous accumulation area.

XVGUSDT 2DXVG ~ 2D Analysis
#XVG Support blocks that you might be able to consider to start buying back from here. with a minimum target of 15%+
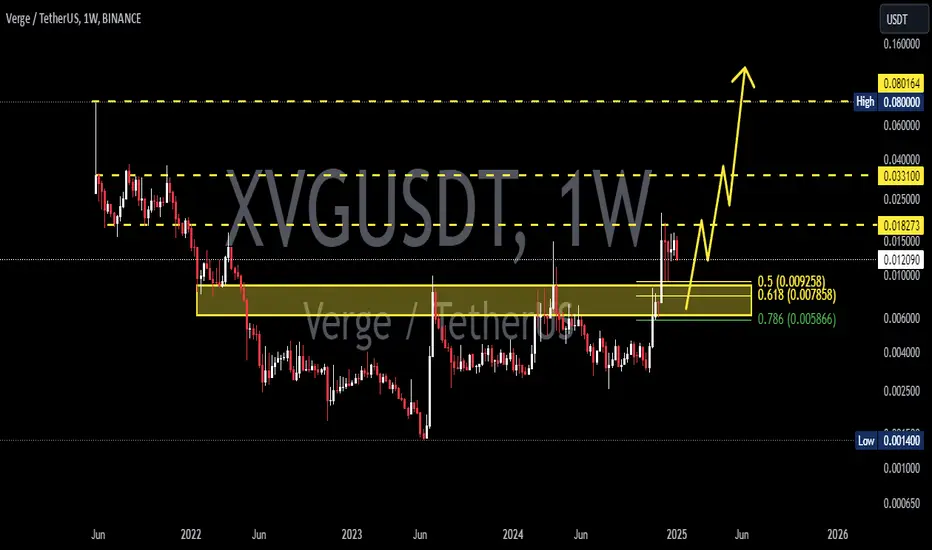
XVGUSDT 1WXVG ~ 1W
#XVG So far it continues to maintain its bullish structure. Buy when retesting this Golden Ratio,. Minimum target 20%+
XVG / USDT : Preparing for a breakout Above trendline resistanceXVG/USDT: Preparing for a Breakout Above Trendline Resistance
XVG/USDT is gearing up for a potential breakout 📈 as it approaches a key trendline resistance zone 📊. The price has been consolidating tightly, creating a promising setup for an explosive move 💥. If the breakout materializes, we could witness a strong bullish trend emerge 🚀. Keep this pair on your radar 👀 and wait for confirmation before taking action.
Key Insights:
1. Trendline Resistance: XVG/USDT is nearing a long-standing trendline that has acted as a significant barrier. A break above this level could signal the start of a robust upward trend.
2. Volume Surge: Monitor trading volume closely; a notable increase during the breakout will confirm buyer strength 🔥.
3. Bullish Indicators: Momentum indicators like RSI and MACD are showing positive trends ⚡, supporting the case for a bullish breakout.
Steps to Confirm the Breakout:
Wait for a clear 4H or daily candle closing above the trendline 📍.
Look for a spike in trading volume during the breakout to validate strong buying pressure 📊.
A retest of the broken resistance as a new support zone will enhance the credibility of the move ✅.
Stay cautious of fake breakouts marked by sudden reversals or wicks above the trendline ⚠️.
Risk Management Strategies:
Use stop-loss orders to protect your capital effectively 🔒.
Ensure your position sizing aligns with your broader trading strategy 🎯.
This analysis is for educational purposes only and is not financial advice. Always conduct your own research (DYOR) 🔍 before making investment decisions.
#XVGUSDT LONGAh, SGX:XVG , the mysterious Verge, a coin that's been around longer than the last Earth Mark II project! Here's what i think...
Short Term (The Next Few Weeks - What we in the biz call "A Galactic Minute"):
- Current Trend: Looks like SGX:XVG has been showing some signs of life, much like a petunias thinking about the nature of existence right before it hits the ground. If it can maintain above the recent support levels, we might see a bit of a bounce back.
- Potential Move: There's a shimmer of hope, or perhaps just my screen reflecting light. If SGX:XVG can break through the resistance at around $0.021, we could see a move towards $0.025ish. Not a meteoric rise, but enough to make you feel like you've found the answer to life, the universe, and everything (which, by the way, is 42, but let's keep that between us).
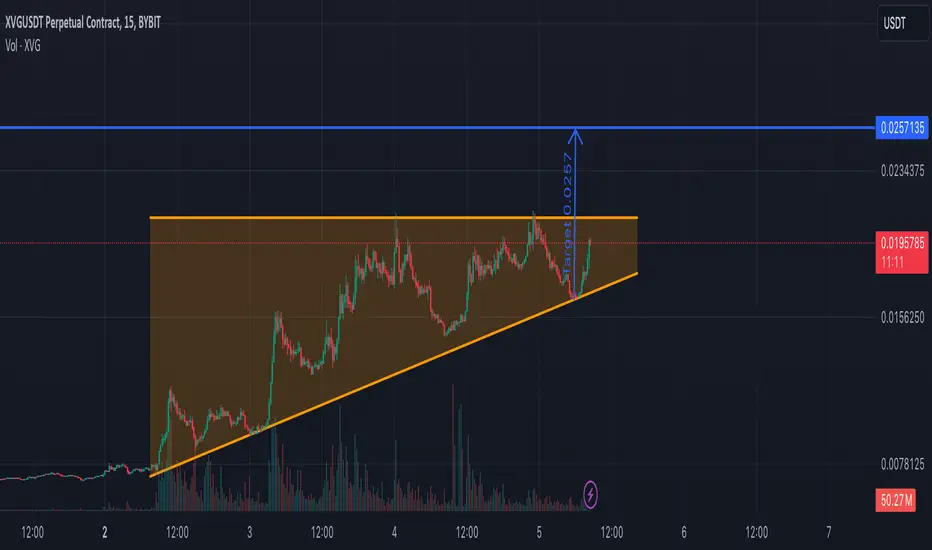
Wait for that neck line break! #XVG at the 15min. Target $.0257. Why is this so significant? Because that will break our 6 year accumulation triangle!! $.03 is my target to start the breaking point!! I expect major news announcement or positive news to hit the
I opened LONG from 0.0174. I will fix profit at 0.021 and will wait breaking resistance at 0.021