BITCOIN probably will resume its uptrend @ ≈ 53400. 20/11/211)On Charts : Charts consist of 3-Dimensions - The X-factor ( Time or Cycle ), The Y- factor ( Price Geometry ), AND The Z-factor ( The Speed ).. 2)On Elliot Wave / Market Structure : Unlike Textbook written rule : ALL Impulsive wave comprise of ONLY a-b-c sub-waves NOT 1,2,3,4,5 waves.. AND there is NO Truncated 5th wave BUT ONLY wrong wave counts...
Xyz3dtrading

GOLD possible reversal at around 1900... 19/11/211)On Charts : Charts consist of 3-Dimensions - The X-factor ( Time or Cycle ), The Y- factor ( Price Geometry ), AND The Z-factor ( The Speed ).. 2)On Elliot Wave / Market Structure : Unlike Textbook written rule : ALL Impulsive wave comprise of ONLY a-b-c sub-waves NOT 1,2,3,4,5 waves.. AND there is NO Truncated 5th wave BUT ONLY wrong wave counts...

POHKONG may done wave (D)(cyan) of triangle. 16/Nov/21POHKONG ( Gold/ Jewelry retailer ) may just completed its wave (D) (cyan) of bullish triangle. Price may down to Wave E ( Cyan) of triangle. Before a "Breakout Triangle" the GOLD's Bull Run!

GOLD seem in Wyckoff's Distribution Stage.( Bull Trap).16/11/21GOLD's price seem like "Squeezing" @ :- 1) Major Down Trend line ( Yellow Dotted) 2) Supply Zone ( Red Rectangle Box ). PLUS + its price shown we're " in " Wyckoff's Distribution Stage" with VSA ( Volume Spread Analysis) ...Conclusion :- Price structure doesn't look good for Bull Run...Properly Maintain "bearish outlook" at around 1870

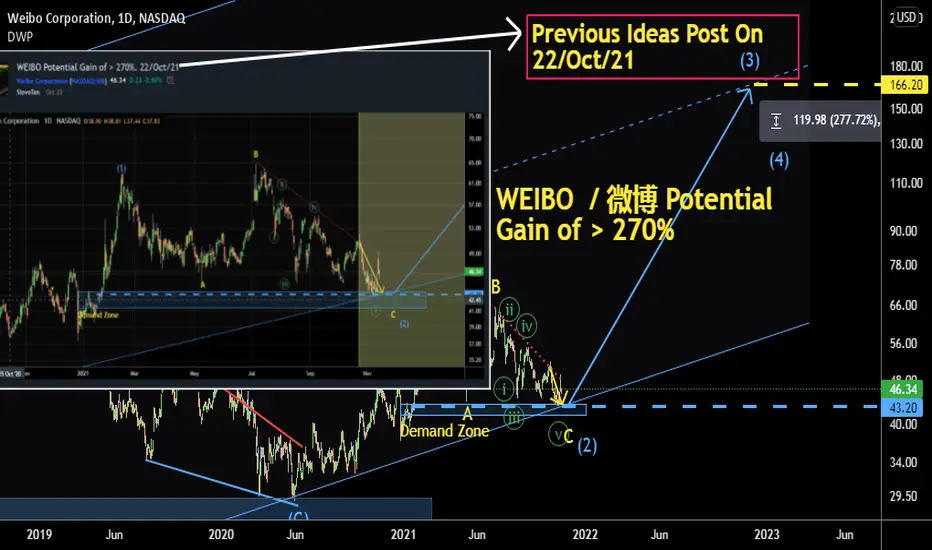
WEIBO. Time for China's Stock to shine? 15/Nov/21WEIBO stock price has happen to re bounce at around demand zone AND Long Term trend line at around 43.30 as previous idea. Properly found strong buyers?
GOLD intraday setup. Possible bullish triangle. 15/Nov/21GOLD possible forming a bullish triangle (A)(B)(C)(D)(E)(Green).. Where price could resuming up trend at around 1848 which is :- 1) Weekly Pivot (White Line) 2) Lower Support Line ( Cyan Dotted) of triangle Stop Lost of the long is at 1822.29 ( Plus your broker spread) . Target Profit around 1900 ( The Next Major demand Zone AND Major down trend line (yellow dotted)..

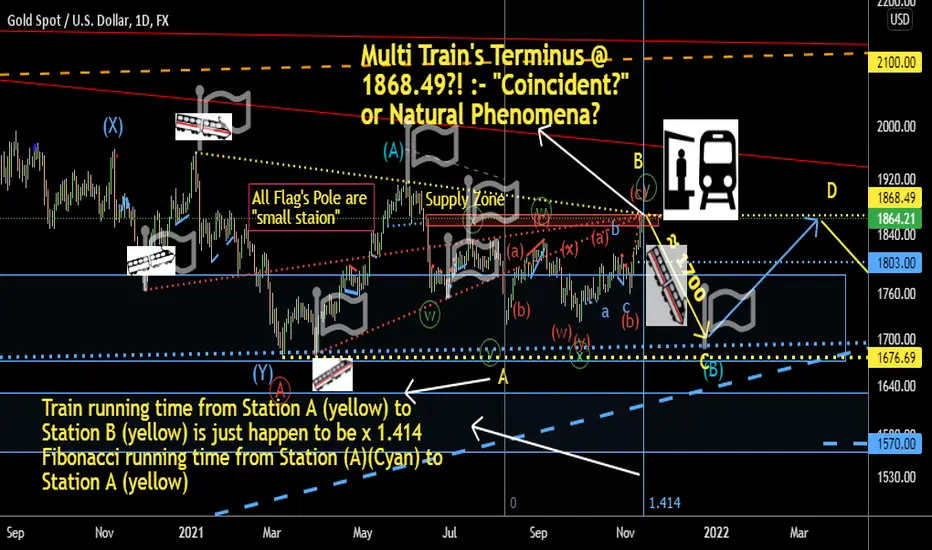
I'm waiting "South Express" @ Gold's 1868.49 Terminus.14/Nov/21I'm waiting for "South Express" "Departure Signal" at GOLD's 1868.49 . Probably the "Final Terminus" . How about you ? Do you have the FOMO of "runaway train"?
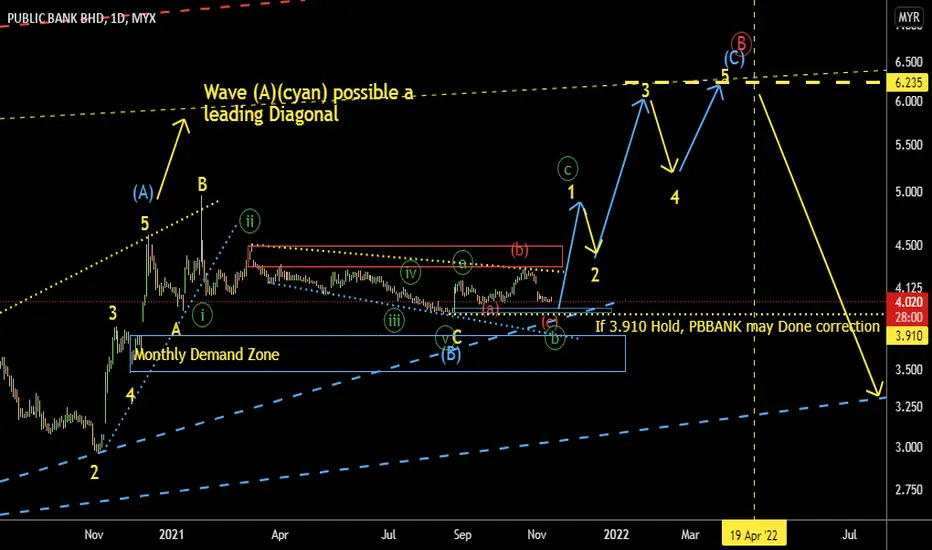
If 3.910 Hold, PBBANK may Done correction. 12/Nov/211)On Charts : Charts consist of 3-Dimensions - The X-factor ( Time or Cycle ), The Y- factor ( Price Geometry ), AND The Z-factor ( The Speed ).. 2)On Elliot Wave / Market Structure : Unlike Textbook written rule : ALL Impulsive wave comprise of ONLY a-b-c sub-waves NOT 1,2,3,4,5 waves.. AND there is NO Truncated 5th wave BUT ONLY wrong wave counts...
SP500 may have pullback toward 4450? 12/Nov/211)On Charts : Charts consist of 3-Dimensions - The X-factor ( Time or Cycle ), The Y- factor ( Price Geometry ), AND The Z-factor ( The Speed ).. 2)On Elliot Wave / Market Structure : Unlike Textbook written rule : ALL Impulsive wave comprise of ONLY a-b-c sub-waves NOT 1,2,3,4,5 waves.. AND there is NO Truncated 5th wave BUT ONLY wrong wave counts...

TOPGLOVE @ ≈ RM2.25?! 11/Nov/211)On Charts : Charts consist of 3-Dimensions - The X-factor ( Time or Cycle ), The Y- factor ( Price Geometry ), AND The Z-factor ( The Speed ).. 2)On Elliot Wave / Market Structure : Unlike Textbook written rule : ALL Impulsive wave comprise of ONLY a-b-c sub-waves NOT 1,2,3,4,5 waves.. AND there is NO Truncated 5th wave BUT ONLY wrong wave counts...

Why Charlie Munger keep on averaging down Alibaba? 11/11/211)On Charts : Charts consist of 3-Dimensions - The X-factor ( Time or Cycle ), The Y- factor ( Price Geometry ), AND The Z-factor ( The Speed ).. 2)On Elliot Wave / Market Structure : Unlike Textbook written rule : ALL Impulsive wave comprise of ONLY a-b-c sub-waves NOT 1,2,3,4,5 waves.. AND there is NO Truncated 5th wave BUT ONLY wrong wave counts...

SILVER possible ≈ 26 instead of 26.50..11/Nov/211)On Charts : Charts consist of 3-Dimensions - The X-factor ( Time or Cycle ), The Y- factor ( Price Geometry ), AND The Z-factor ( The Speed ).. 2)On Elliot Wave / Market Structure : Unlike Textbook written rule : ALL Impulsive wave comprise of ONLY a-b-c sub-waves NOT 1,2,3,4,5 waves.. AND there is NO Truncated 5th wave BUT ONLY wrong wave counts...

GOLD possible reversal @ ≈1890. 11/Nov/211)On Charts : Charts consist of 3-Dimensions - The X-factor ( Time or Cycle ), The Y- factor ( Price Geometry ), AND The Z-factor ( The Speed ).. 2)On Elliot Wave / Market Structure : Unlike Textbook written rule : ALL Impulsive wave comprise of ONLY a-b-c sub-waves NOT 1,2,3,4,5 waves.. AND there is NO Truncated 5th wave BUT ONLY wrong wave counts...

GOLD intrady setup. Maybe 1840 first before 1760. 10/11/21GOLD price if could hold above wedge pattern support line may reach around 1840 , just breaking the long term down trend line (Red) for the "sake of " trapping" "trend line breakout " trading traders...

GOLD may down to 1760 as triangle in wave (x)(Red). 10/Nov/21GOLD possible forming a bullish triangle in wave (x)(Red). Price may reached wave d (Cyan/Light Blue) of the triangle @ 1832.56 which is the major resistance zone of the long term down trend line (Red Dotted).....Wave e (Cyan/Light Blue) of the Bullish Triangle could be at around 1760 which is the zone of :- 1) Lower Support Line of the Bullish Triangle ( Cyan Dotted) .. 2) Weekly Up Trend Line Support Zone ( Cyan Dashed ) .. 3) P.O.C ( Point of Control) zone of Volume Profile,,..

GBPJPY probably last leg up to complete flat pattern. 8/11/21GBPJPY probably on last wave up to complete flat pattern (A)(B)(C)( Cyan/Light Blue).. Price could reach at around 160 .. which is the zone of :- 1) Long Term Down Trend Line (Yellow) Resistance ....2) Major Supply Zone ( Red Rectangle Box) .. For The Long trade toward around 160 Stop Lost is 149.266 at the wave e ( Green Circled) of triangle in wave 4 (yellow)...

GOLD intraday updated 7/Nov/21GOLD possible will reach around 1838 before a deep pullback toward around 1803 and finally resuming its uptrend toward around 1870

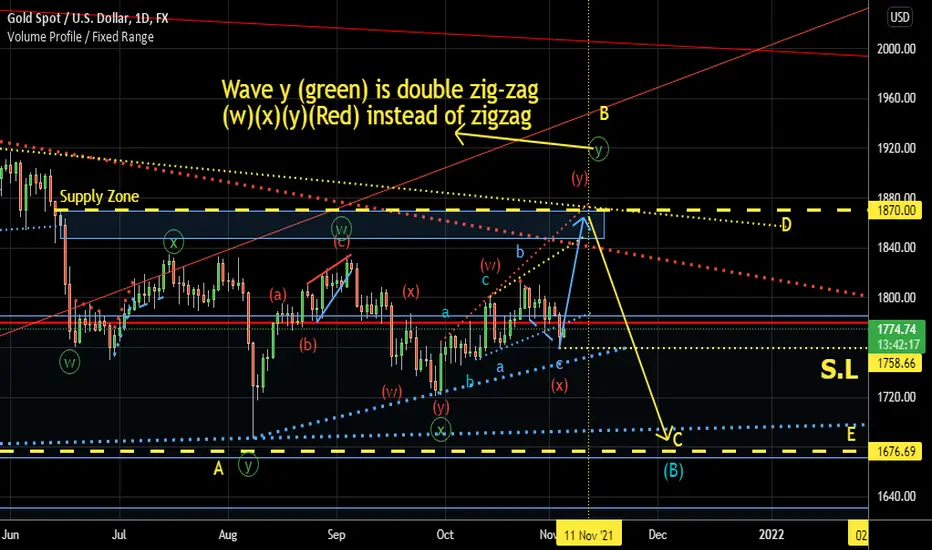
GOLD. Maybe Double ZigZag. 4/Nov/21.GOLD probably remain "Ping-Poing" until FED make decision on rate change. (Maybe till early next year).. Price probably remain within "Big Range " within "1900-1700" in next few months... Price now may have completed wave (x)(Red) of Double ZigZag and start trending up toward around 1870.. Stop Lost at 1758.66 + (your Broker Spread)
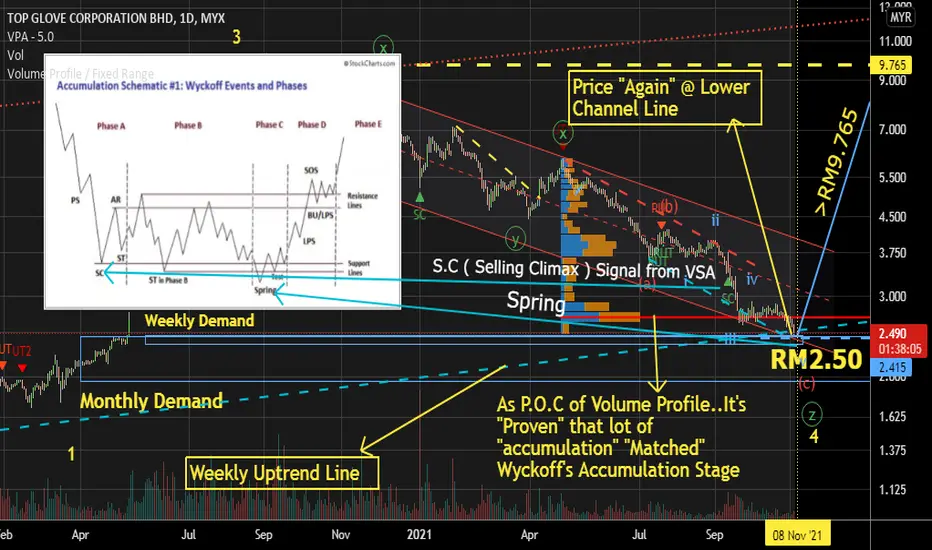
TOPGLOV's Wyckoff Analysis with Volume Profile + VSA. 3/Nov/21TOPGLOVE's stock price "Finally" reached RM2.50.. A "very critical support zone"... Where this "zone" are : - 1) Weekly Up Trend Line ( Cyan Dashed) support 2) Weekly & Monthly Demand Zone 3) Zone of lower support @ parallel channel (red).. AND From Volume Profile's POC @ around RM2.70.. we "see" lot of buyer either from institutional or retail were buying in That "matched" what Wyckoff's "Universal" Market Structure in "Accumulation Phase"...
Watchout! The "Mother" of Up Trend SPX's 4700 lvl. 2/Nov/21So. SPX stop lost was hit on last setup. Back to previous ideas :- Level 4700 . Watch out Just before or after coming F.O.M.C!!! ... 4700 = the upper trend line of parallel channel (red) ... Price eventually "may" "sucked" into "volume profile" POC level near 4100 ( which is also the next major demand zone). A potential of -12.77% drop from 4700 level..

KLSE may resume downtrend @ ≈1555..2/Nov/21KLSE future index may resume its downtrend at around 1555 where this is the zone of ..1)Volume Profile's Valley ( Some traders only trade the "Peak" or "POC" of volume Profile. But the "valley" of Market profile could be "interpreted" as "Lesser" "Buyer or Seller". Depend on the "bias" of market sentiments overall trend 2)Closing the gap at round 1555 3) A minor Supply Zone (cyan) 4) A minor down trend line (yellow)

PBBANK down to around RM 3.745 ?! 11/Nov/21P/s. To have more "consistent" Elliot Wave Counts.. Unlike Text Book written Elliot Wave Theory :- There is 5 sub-waves in any Impulsive Waves .. Traders are advised to label ONLY a-b-c 3 Sub-waves on ANY Impulsive Waves...

KLCI what next after 33% affluent tax? 1/Nov/21KLCI future index is on its last leg to complete wave (E) ( Cyan /Light Blue).. The last leg of bullish contracting triangle correction. Price will rebound soon as price now close to :- 1) Volume Profile ( POC) ( Point of Control) at around 1517 AND 2) Daily Demand Zone (Cyan Rectangle Box).. 3) Dynamic cycle 4 ( cyan/light blue) reached soon 4) There is a selling Climax Signal from VSA ( Volume Spread Analysis ) on 4 hours Time Frame Chart ..
