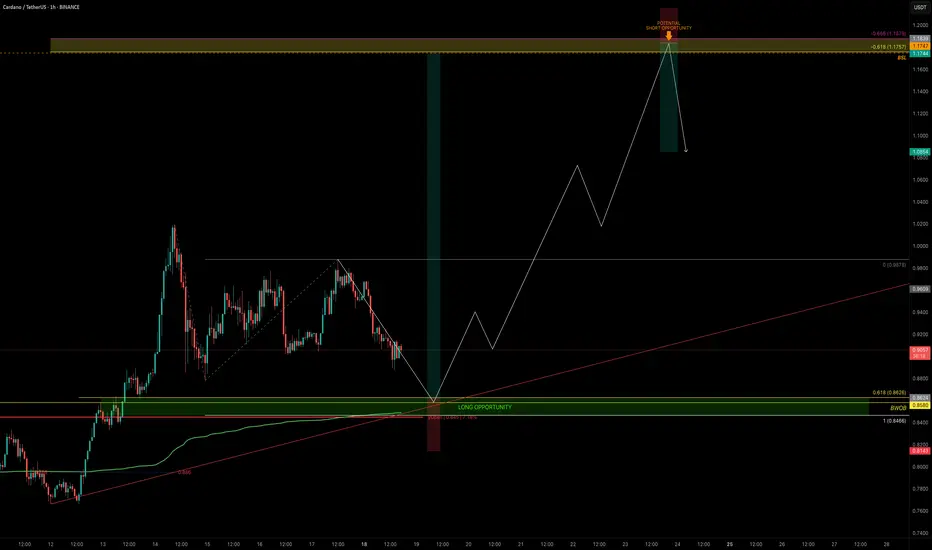
ADA — Is Cardano Ready to Break $1?ADA is coiling just beneath the $1 psychological barrier. The chart is setting up for a decisive move: the high-probability long entry aligns with the yearly open (yOpen), supported by multiple confluences.
🧩 Confluence Factors: 7
Yearly Open (yOpen): $0.845
1.0 Trend-Based Fib Extension: $0.8466 (aligned with yOpen)
Weekly Bullish Order Block: $0.8580
0.618 Fib Retracement: $0.8626
Anchored VWAP (green line): Supporting this zone
Sell-Side Liquidity (SSL): Positioned below recent lows
0.886 Fib Speed Fan: Adding further structural support
🟢 Long Trade Setup
Entry Zone: $0.863 – $0.847
Stop-Loss: Below yOpen (~$0.84)
Take-Profit Zone: $1.1747 (Buy-Side Liquidity sweep)
R:R: 1.6+ depending on SL placement
🔴 Short Opportunity
A secondary setup could arise on a sweep of the key high ($1.1757–$1.1879 BSL zone). This would only be valid with confirmation of rejection.
Entry Zone: After sweep/rejection above $1.1747
Stop-Loss: Above ~$1.20 (post-sweep rejection)
Target: Around $1.10
✍️ Confirmation is critical: the long requires strong defense of the confluence zone, while the short requires a failed breakout and rejection above key high (BSL).
Key Levels to Watch:
Support Zone: $0.863 – $0.847
Resistance / GP Zone: $1.1757 – $1.1879
🔍 Indicators used:
DriftLine — Pivot Open Zones → For identifying key yearly/monthly/weekly/daily opens that act as major S/R reference points
➡️ Available for free. You can find it on my profile under “Scripts” and apply it directly to your charts for extra confluence when planning your trades.
_________________________________
💬 If you found this helpful, drop a like and comment!
Yearlyopen
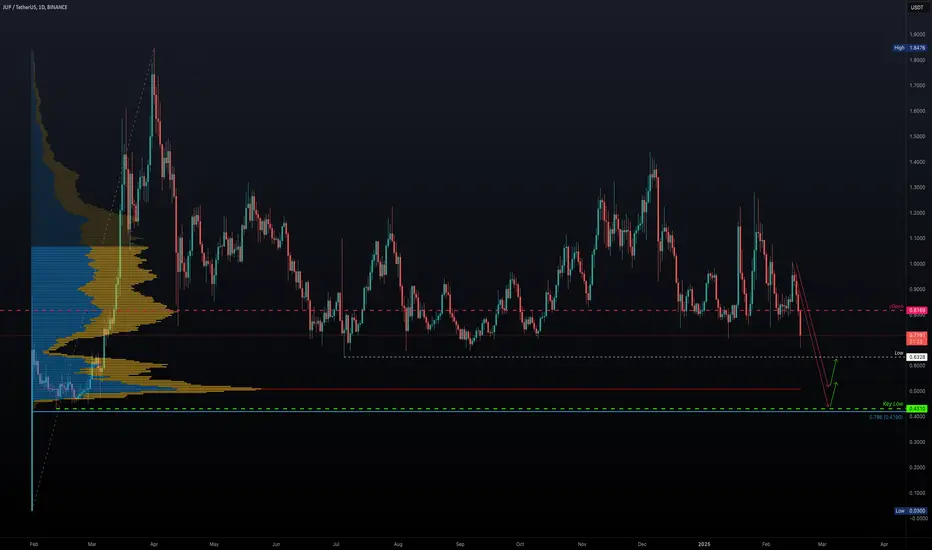
JUP in Danger: Are We in for a Crash?JUP has been on a four-day downtrend, and it's starting to show its bearish side. The token has lost its yearly open, which was a major support level. Let’s break down the key support and resistance to see what the chart is telling us.
Support & Resistance
Resistance:
Yearly Open & Monthly Level: JUP has dropped below the yearly open at $0.8169 and the monthly level at $0.7427
Support:
Long-Term Range & Liquidity: JUP has been trading within a range for over 300 days, with a significant amount of liquidity below the low at $0.6328 from 5 July 2024.
POC: The volume profile shows the POC sitting at around $0.5, marking an attractive entry point for a long position.
Fibonacci Confluence: The 0.786 Fibonacci retracement level falls just below the key low at $0.431 (a level last seen on 12 February 2024), offering a great long trade setup.
Long Trade Opportunity:
Alarms are set, let's see if JUP drops to these key support levels. If it does, we could have a solid long setup on our hands.
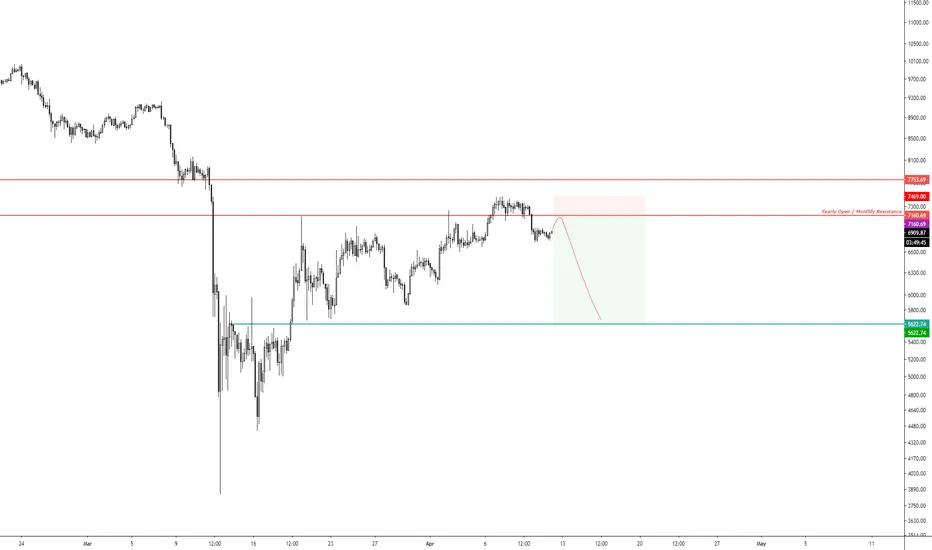
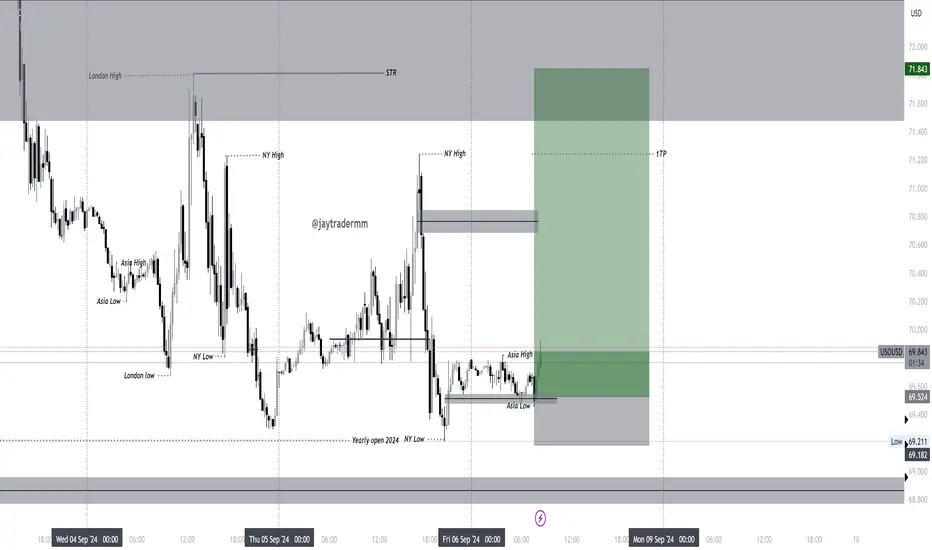
WTI Crude Oil USOUSD LongIn my humble opinion, the worst seems to be over for oil.
Trading Idea: After analyzing multiple sessions, I noticed how well the price has absorbed the recent drop, reclaiming the liquidity distribution from last month. There’s no strong indication of further downside. The Asian session has brought it into a solid accumulation range. I’m looking for an entry within the lower zone, aligned with a 15-minute FVG.
Trade Management: Once the rally begins, I plan to take partial profits (40%) at yesterday’s NY session high, and let the remaining position run toward the swing high. I’m targeting a rally up to the $73 area, but will wait for additional high-probability confirmations as the rally unfolds.
Risk: 0.50%
R/R: 6.78
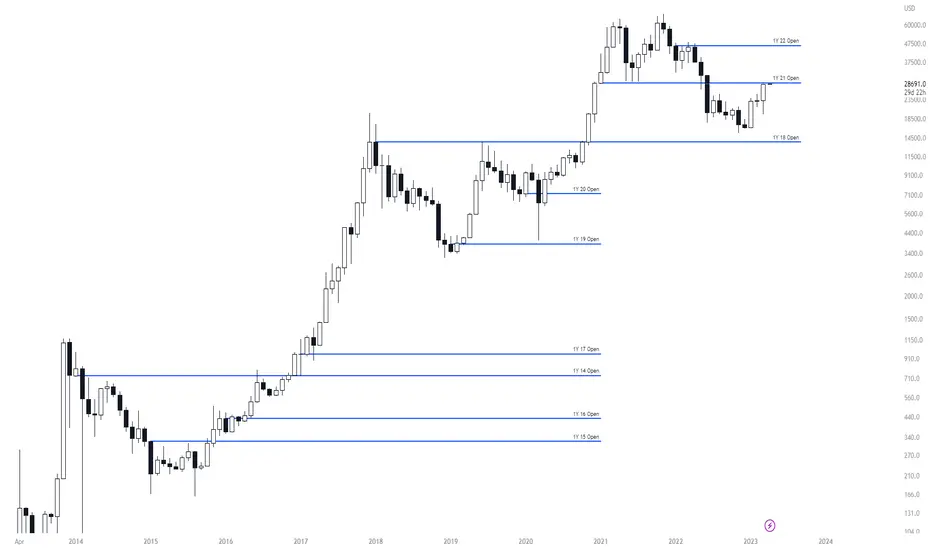
BTCUSDT Yearly Support/Resistance AreasNot a big secret that high time frame candles and especially their Open and Close prices are solid areas of Support and Resistance.
Here is on the chart I marked yearly Open candles. Its 1M chart so its easy to see how price respects these areas.
In some cases it was resistance, but mostly good support areas.
The current Yearly open area, which is close to the price, is a range 28920-28940 usd (depending on the Exchange).
Monthly closes above it -> most likely will be continuation of aa movement, at least till next yearly open area.
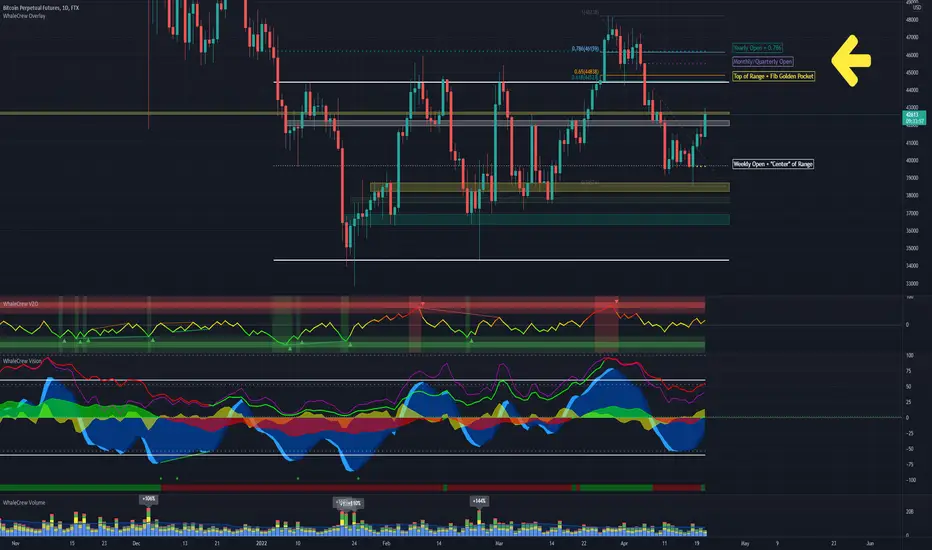
BITCOIN RESISTANCE AHEADBitcoin is back in the big daily range and successfully retested an important level with a SFP (Swing Failure Pattern).
There's a lot of heavy resistance ahead
Top of the Range + Fibonacci Golden Pocket
Yearly Open + 0.786 Fib Level
Monthly/Quarterly Open
Our indicators show that there's potential for a little more upside in the current price action.
One major problem is the current volume which isn't showing any signs of strength as of now.