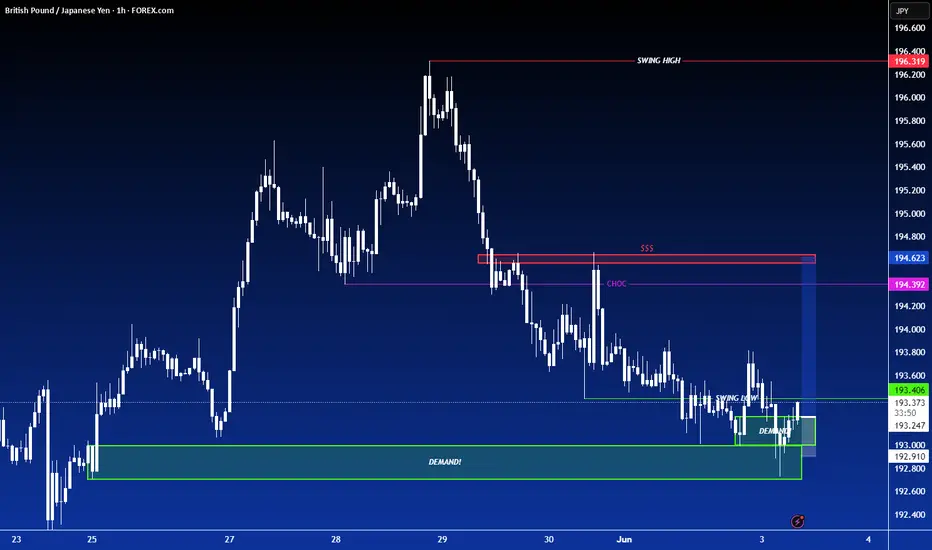
LONG ON GBP/JPYGJ has given us a double bottom at a major demand level.
I am looking to catch over 100 pips on GJ to the previous high.
Yen
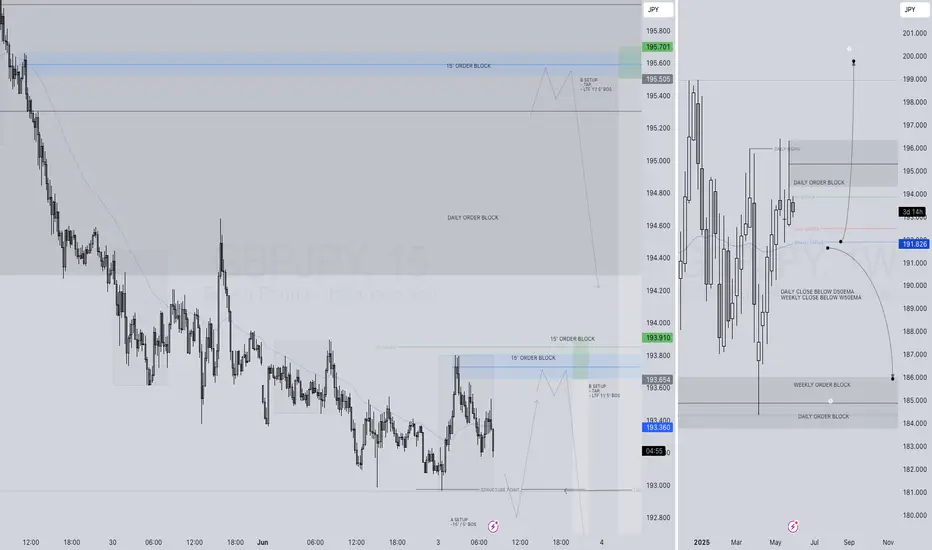
GBPJPY LONG FORECAST Q2 W23 D3 Y25GBPJPY LONG FORECAST Q2 W23 D3 Y25
Professional Risk Managers👋
Welcome back to another FRGNT chart update📈
Diving into some Forex setups using predominantly higher time frame order blocks alongside confirmation breaks of structure.
Let’s see what price action is telling us today!
💡Here are some trade confluences📝
✅Daily order block
✅15' order block
✅Intraday breaks of structure
✅4H 50 EMA rejection
🔑 Remember, to participate in trading comes always with a degree of risk, therefore as professional risk managers it remains vital that we stick to our risk management plan as well as our trading strategies.
📈The rest, we leave to the balance of probabilities.
💡Fail to plan. Plan to fail.
🏆It has always been that simple.
❤️Good luck with your trading journey, I shall see you at the very top.
🎯Trade consistent, FRGNT X
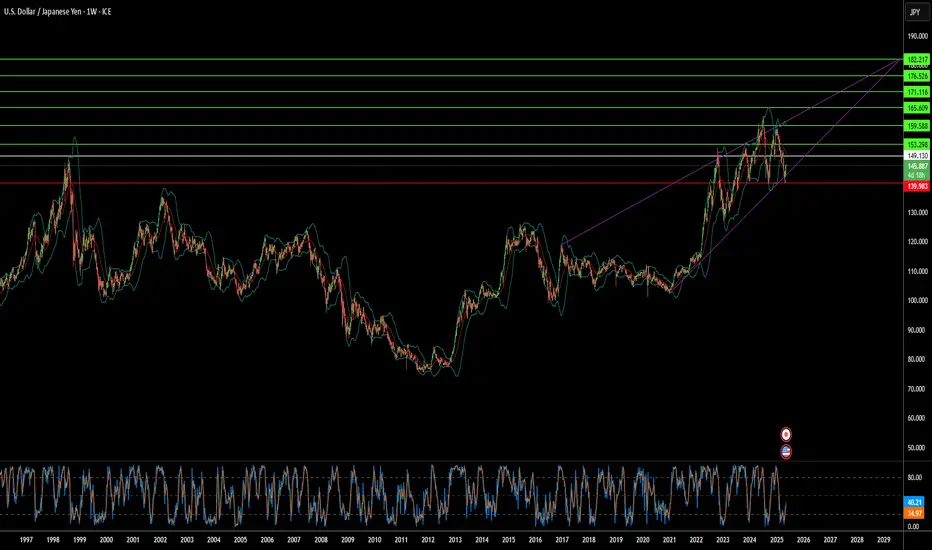
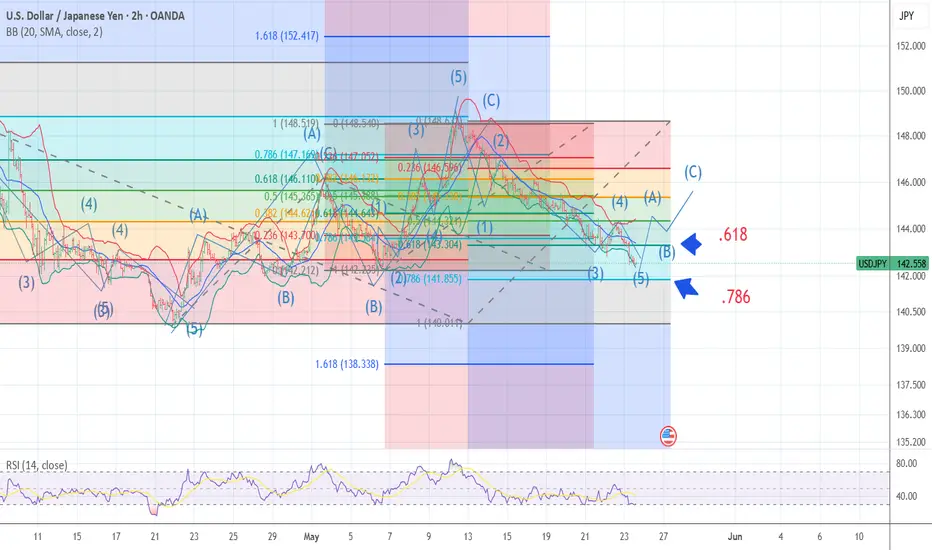
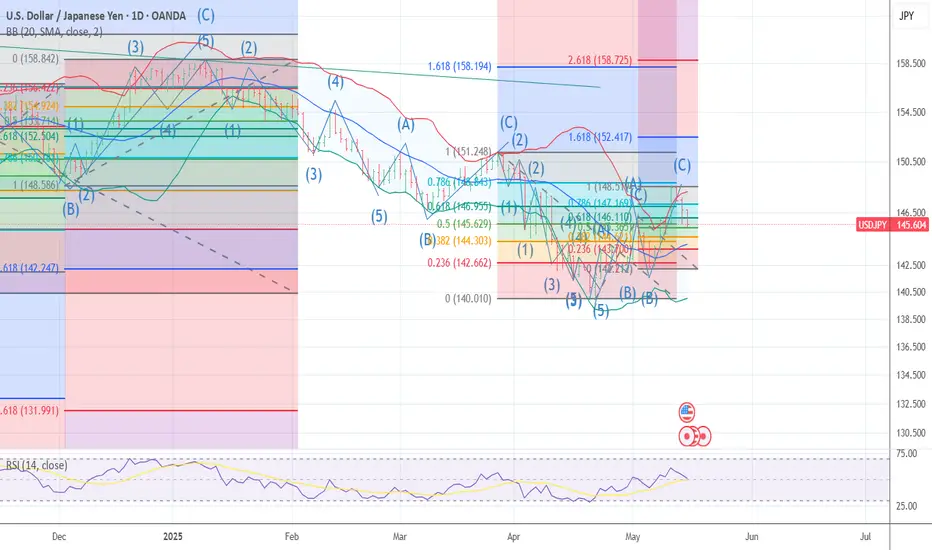
YEN/$USA topped in the target 144/146 and now supported into fibThe chart posted is the USA $/YEN chart it is key to all things as to the sp 500 and debt markets A few weeks back I posted The chart of a MASSIVE HEAD N SHOULDER TOP formation !!! we are still forming the Right shoulder in a rather complex wave STRUCTURE This is the hourly model and forecast so far spot on . best of trades WAVETIMER
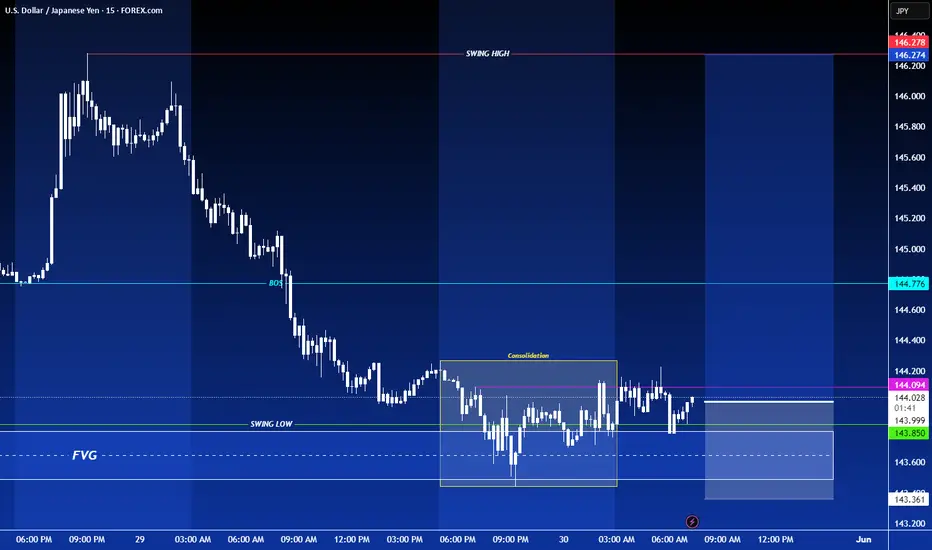
LONG ON USD/JPYUJ has given a choc (change or character) at a major demand zone.
JPY index structure is currently bearish.
I will buying UJ to the next swing high looking to catch 100-200 pips
Yen Strengthens Beyond 144 on InflationThe Japanese yen rose past 144 per dollar, extending gains after Tokyo’s core inflation beat expectations, increasing the likelihood of a 25 bps BOJ rate hike in July.
BOJ Governor Kazuo Ueda said recent forecast adjustments were due to global risks and lower oil prices but reaffirmed the short-term policy stance remains focused on the 2% inflation goal. The yen also gained from safe-haven flows after a U.S. court reinstated Trump’s reciprocal tariffs.
Resistance is at 144.50, with further resistance at 145.40 and 146.10. Support levels stand at 143.50, 143.00, and 142.10.
Yen Stabilizes as Risk Sentiment ImprovesThe Japanese Yen edged up from a two-week low on Thursday but lacked strong momentum, as risk appetite improved after a U.S. court blocked Trump’s “Liberation Day” tariffs, reducing demand for safe havens. Concerns over Japan’s rising debt continue to pressure the Yen. Meanwhile, USD/JPY rose for a fourth day, supported by hawkish FOMC minutes, though markets still expect a Fed rate cut. Expectations of a more hawkish Bank of Japan helped limit the Yen’s losses.
The key resistance is at $147.10 meanwhile the major support is located at $145.00.
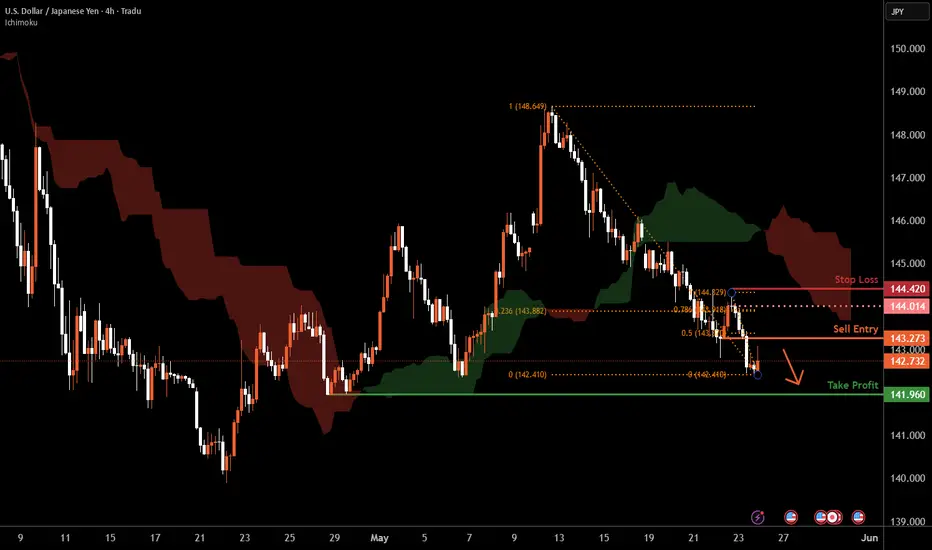
USD/JPY H4 | Overhead pressures remain?USD/JPY is rising towards a pullback resistance and could potentially reverse off this level to drop lower.
Sell entry is at 143.27 which is a pullback resistance that aligns with the 50.0% Fibonacci retracement.
Stop loss is at 144.42 which is a level that sits above the 23.6% and 78.6% Fibonacci retracements and a swing-high resistance.
Take profit is at 141.96 which is a multi-swing-low support.
High Risk Investment Warning
Trading Forex/CFDs on margin carries a high level of risk and may not be suitable for all investors. Leverage can work against you.
Stratos Markets Limited (tradu.com ):
CFDs are complex instruments and come with a high risk of losing money rapidly due to leverage. 63% of retail investor accounts lose money when trading CFDs with this provider. You should consider whether you understand how CFDs work and whether you can afford to take the high risk of losing your money.
Stratos Europe Ltd (tradu.com ):
CFDs are complex instruments and come with a high risk of losing money rapidly due to leverage. 63% of retail investor accounts lose money when trading CFDs with this provider. You should consider whether you understand how CFDs work and whether you can afford to take the high risk of losing your money.
Stratos Global LLC (tradu.com ):
Losses can exceed deposits.
Please be advised that the information presented on TradingView is provided to Tradu (‘Company’, ‘we’) by a third-party provider (‘TFA Global Pte Ltd’). Please be reminded that you are solely responsible for the trading decisions on your account. There is a very high degree of risk involved in trading. Any information and/or content is intended entirely for research, educational and informational purposes only and does not constitute investment or consultation advice or investment strategy. The information is not tailored to the investment needs of any specific person and therefore does not involve a consideration of any of the investment objectives, financial situation or needs of any viewer that may receive it. Kindly also note that past performance is not a reliable indicator of future results. Actual results may differ materially from those anticipated in forward-looking or past performance statements. We assume no liability as to the accuracy or completeness of any of the information and/or content provided herein and the Company cannot be held responsible for any omission, mistake nor for any loss or damage including without limitation to any loss of profit which may arise from reliance on any information supplied by TFA Global Pte Ltd.
The speaker(s) is neither an employee, agent nor representative of Tradu and is therefore acting independently. The opinions given are their own, constitute general market commentary, and do not constitute the opinion or advice of Tradu or any form of personal or investment advice. Tradu neither endorses nor guarantees offerings of third-party speakers, nor is Tradu responsible for the content, veracity or opinions of third-party speakers, presenters or participants.
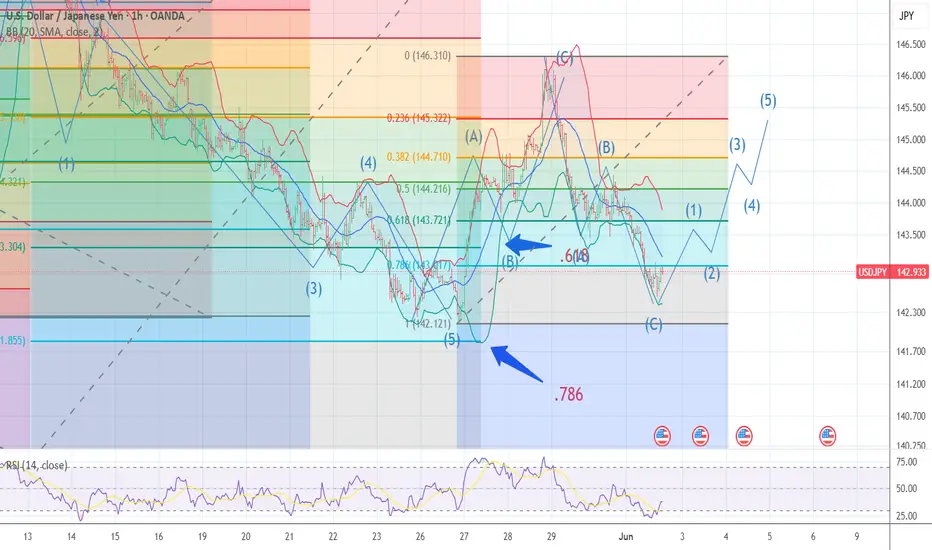
YEN BOTTOMING Look for ABC up back to 144/145The us $ yen trade should now be setup to rally But I can allow one more minor low into,786 But we should begin the final rally up into June 9 to the 16th for support in the carry trade and in SP500 into a seasonal cycle peak . As I have posted the long term chart of a massive Head n shoulder TOP in yen trade . Best of trades WAVETIMER
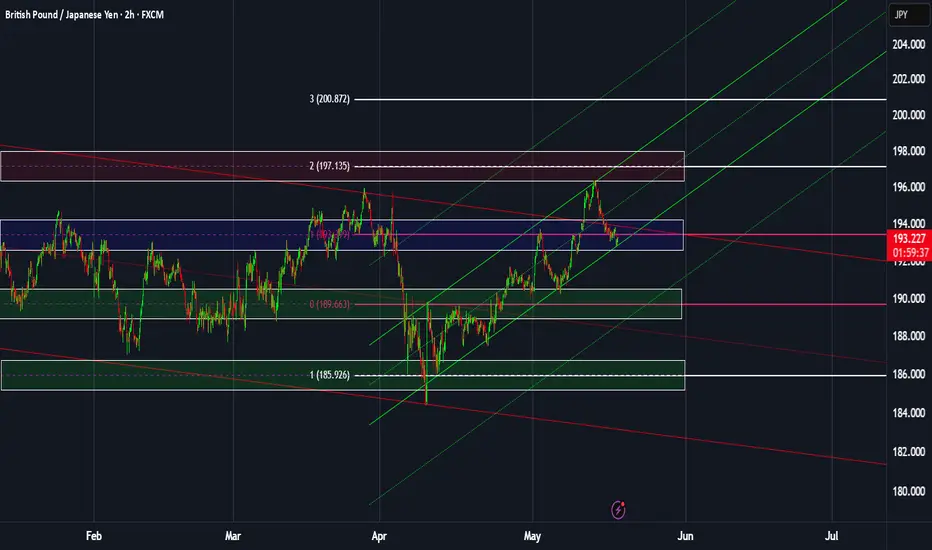
GBPJPY: Weekly overview + Significant zonesHello dear traders,
The indicated levels are determined based on the most reaction points and the assumption of approximately equal distance between the zones.
These points can also be confirmed by the mathematical intervals of Murray.
After reacting to the following zones, you can enter the trade. Place the stop loss slightly above/below the zone to which the reaction was shown. The profit point is the next zone.
The drawn channels and their medians can also be considered as moving support and resistance. I usually use them as target points. I've doubled the short-term channel because it was so thin ;-).
* I don't use 189.663 zone to take short! There are too many moving S&R around it.
This analysis is valid until the end of the week.
**************************************
Important news that could change the direction of the trade:
Wed: Great Britain CPI of April.
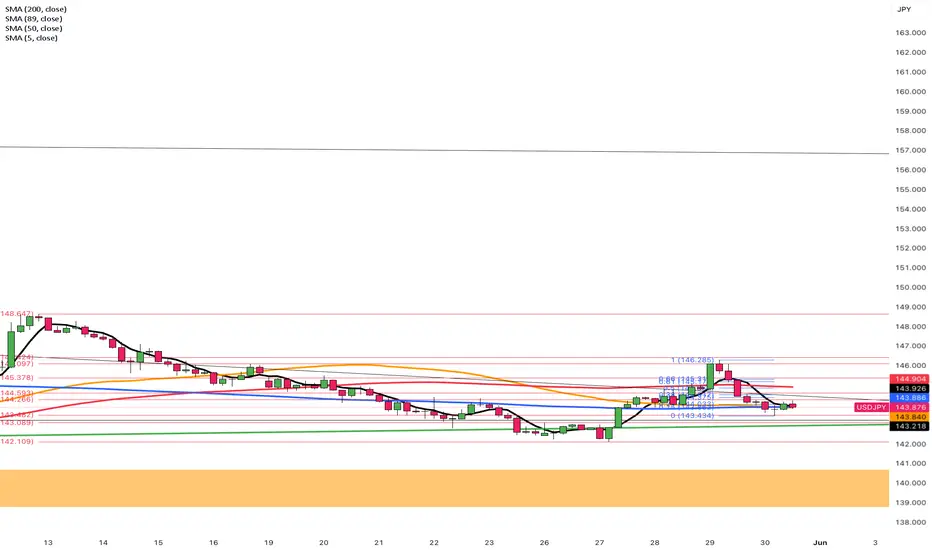
Yen Strengthens on Dollar WeaknessThe Japanese yen firmed to around 143.6 per dollar, heading for a weekly gain of over 1% as inflation data came in stronger than expected. Core inflation surged to 3.5%, its highest in more than two years, while headline inflation held at 3.6%, reinforcing expectations that the BoJ may maintain its tightening stance.
The yen also benefited from continued dollar weakness tied to U.S. fiscal worries. Earlier, Japan’s Finance Minister Katsunobu Kato denied discussing exchange rates with U.S. Treasury Secretary Bessent at the G7 summit, dismissing rumors of joint currency intervention.
USD/JPY faces resistance at 148.60, with further upside levels at 149.80 and 151.20. Key support lies at 139.70, then 137.00 and 135.00.
GBP/JPY Holds Key Support as Bullish Momentum BuildsA bullish setup has emerged on GBP/JPY, with recent price action suggesting bullish momentum is building. With GBP strengthening against USD, GBP/JPY may present a higher-probability bullish scenario compared to USD/JPY in the near term (though this also looks bullish to my eyes over the near term).
GBP/JPY held above key moving averages midweek. GBP/JPY failed to close below its 200-day SMA on both Wednesday and Thursday, while yesterday’s session also respected support at the 50-day EMA and the 192.00 handle.
Momentum indicators support the bullish case, with the daily RSI trading above 50 after rebounding from its most oversold level in six weeks.
As long as prices hold above Thursday’s low, bulls may look for a retest of the cycle highs near 196.00.
** Please note that Japan's CPI data drops in >30 minutes **
Matt Simpson, Market Analyst at City Index and Forex.com

JPY Hits 2-Week High as Dollar WeakensThe Japanese yen strengthened to around 143 per dollar on Thursday, its highest in over two weeks, as concerns over the U.S. fiscal outlook pressured the dollar. Fears that Trump’s proposed tax cuts could add over $3 trillion to U.S. debt weighed on investor confidence.
Japan’s Finance Minister Kato said he did not discuss currency levels with Treasury Secretary Bessent at the G7 summit.
Domestically, core machinery orders surged 13% in March, beating expectations of a 1.6% drop, while May PMI data showed continued weakness in both manufacturing and services.
USD/JPY H1 | Bearish downtrend to extend further?USD/JPY is rising towards an overlap resistance and could potentially reverse off this level to drop lower.
Sell entry is at 143.50 which is an overlap resistance.
Stop loss is at 144.50 which is a level that sits above the 23.6% Fibonacci retracement and a swing-high resistance.
Take profit is at 142.35 which is a swing-low support.
High Risk Investment Warning
Trading Forex/CFDs on margin carries a high level of risk and may not be suitable for all investors. Leverage can work against you.
Stratos Markets Limited (tradu.com ):
CFDs are complex instruments and come with a high risk of losing money rapidly due to leverage. 63% of retail investor accounts lose money when trading CFDs with this provider. You should consider whether you understand how CFDs work and whether you can afford to take the high risk of losing your money.
Stratos Europe Ltd (tradu.com ):
CFDs are complex instruments and come with a high risk of losing money rapidly due to leverage. 63% of retail investor accounts lose money when trading CFDs with this provider. You should consider whether you understand how CFDs work and whether you can afford to take the high risk of losing your money.
Stratos Global LLC (tradu.com ):
Losses can exceed deposits.
Please be advised that the information presented on TradingView is provided to Tradu (‘Company’, ‘we’) by a third-party provider (‘TFA Global Pte Ltd’). Please be reminded that you are solely responsible for the trading decisions on your account. There is a very high degree of risk involved in trading. Any information and/or content is intended entirely for research, educational and informational purposes only and does not constitute investment or consultation advice or investment strategy. The information is not tailored to the investment needs of any specific person and therefore does not involve a consideration of any of the investment objectives, financial situation or needs of any viewer that may receive it. Kindly also note that past performance is not a reliable indicator of future results. Actual results may differ materially from those anticipated in forward-looking or past performance statements. We assume no liability as to the accuracy or completeness of any of the information and/or content provided herein and the Company cannot be held responsible for any omission, mistake nor for any loss or damage including without limitation to any loss of profit which may arise from reliance on any information supplied by TFA Global Pte Ltd.
The speaker(s) is neither an employee, agent nor representative of Tradu and is therefore acting independently. The opinions given are their own, constitute general market commentary, and do not constitute the opinion or advice of Tradu or any form of personal or investment advice. Tradu neither endorses nor guarantees offerings of third-party speakers, nor is Tradu responsible for the content, veracity or opinions of third-party speakers, presenters or participants.

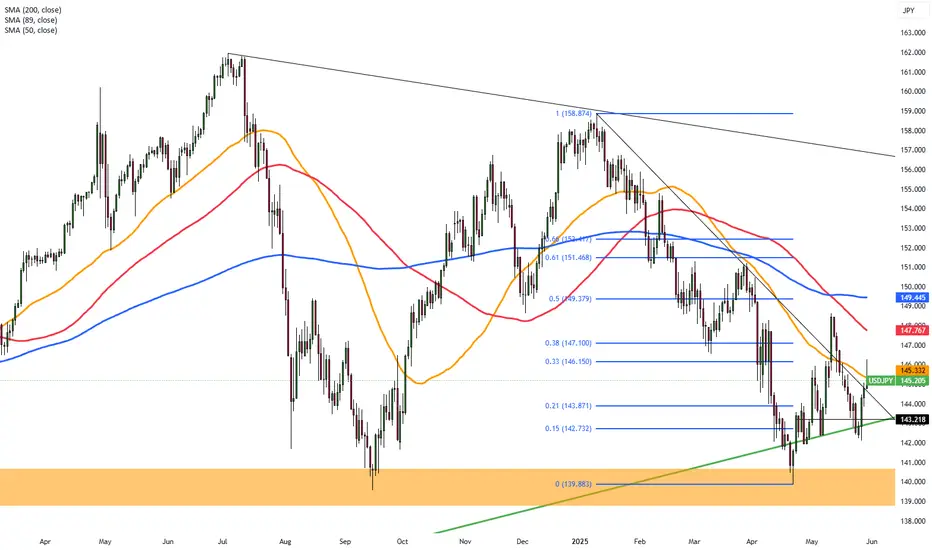
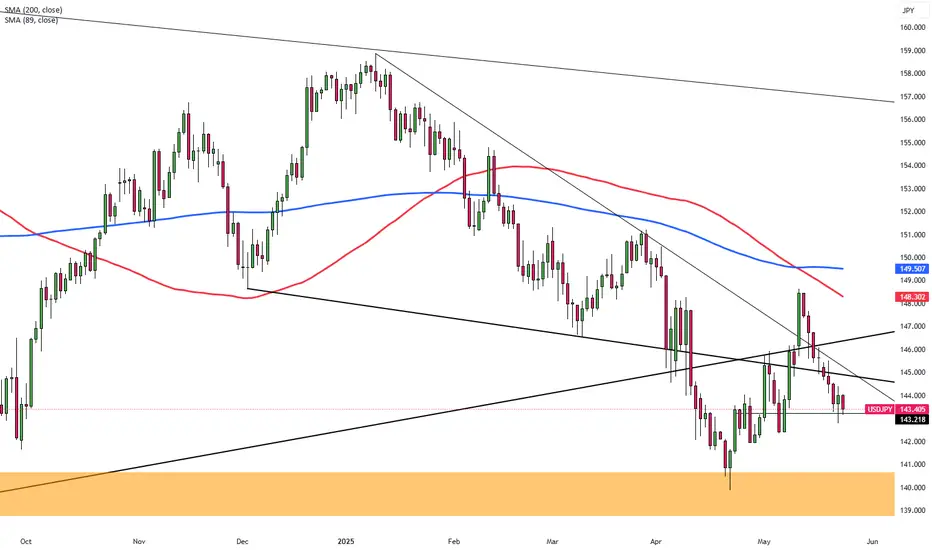
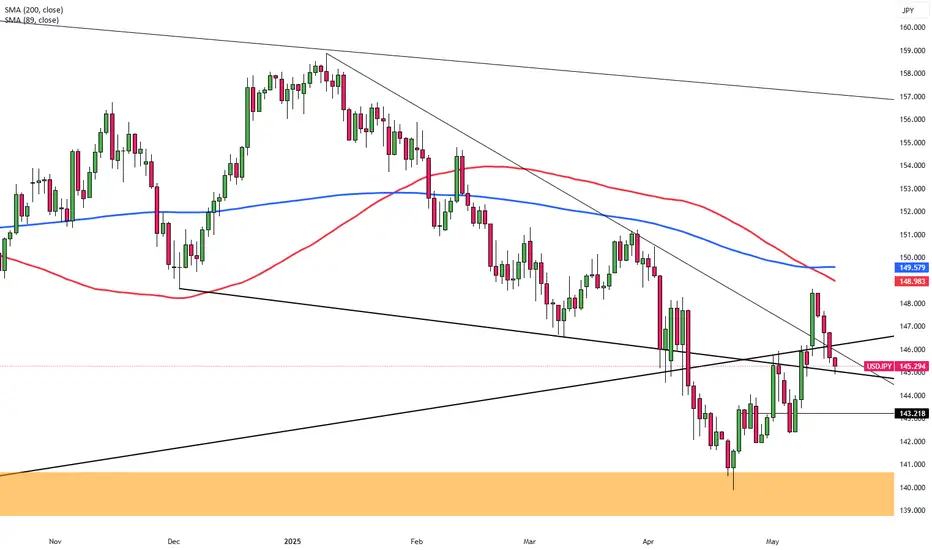
USDJPY - Trendline Support to Determine Next Big MoveThe USD/JPY pair has been trading within a well-defined upward trajectory, currently testing key levels around 145.68. The diagonal trendline visible on the chart serves as a critical support level that has consistently propelled the pair higher since mid-April. Should the price respect this trendline in the coming sessions, we could see a temporary pullback before potentially rallying toward the resistance zone around 148.50, highlighted by the upper purple rectangle. However, traders should closely monitor any breaks below this trendline as it would signal a significant shift in momentum and possibly indicate a deeper correction. The pair appears to be consolidating after the recent pullback from May highs, with the trendline interaction likely determining the next directional move.
Disclosure: I am part of Trade Nation's Influencer program and receive a monthly fee for using their TradingView charts in my analysis.

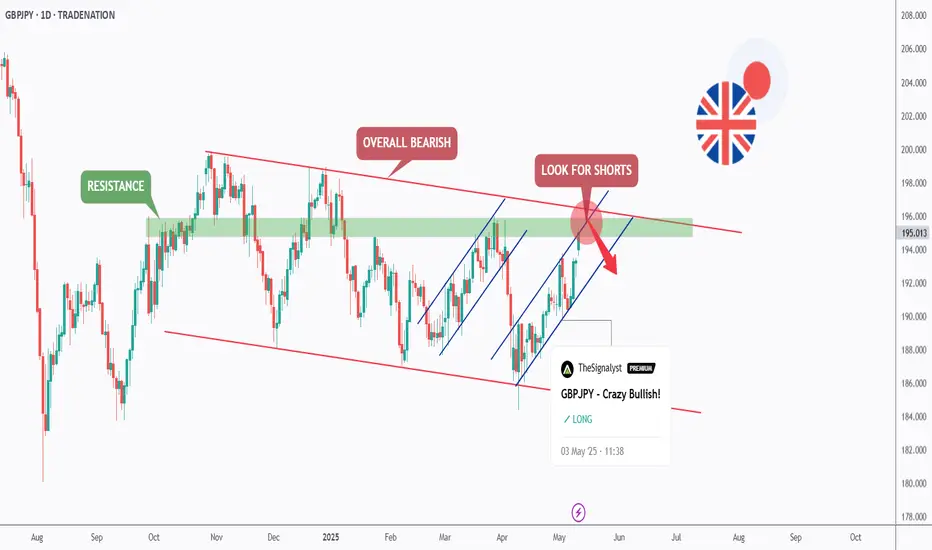
GBPJPY - Bullish No More!Hello TradingView Family / Fellow Traders. This is Richard, also known as theSignalyst.
📈As per our last GBPJPY analysis (attached on the chart), it rejected the lower bound of the rising blue channel.
What's next?
GBPJPY is currently approaching the upper bound of its falling trend marked in red.
Moreover, the green zone is a strong structure and resistance.
🏹 Thus, the highlighted red circle is a strong area to look for sell setups as it is the intersection of structure and upper red trendline acting as a non-horizontal resistance.
📚 As per my trading style:
As #GBPJPY approaches the red circle zone, I will be looking for bearish reversal setups (like a double top pattern, trendline break , and so on...)
📚 Always follow your trading plan regarding entry, risk management, and trade management.
Good luck!
All Strategies Are Good; If Managed Properly!
~Rich
Disclosure: I am part of Trade Nation's Influencer program and receive a monthly fee for using their TradingView charts in my analysis.
Yen Strengthens Despite Japan’s Q1 ContractionThe Japanese yen strengthened toward 145 per dollar, extending its rally for a fourth straight day, despite Japan’s economy shrinking by 0.2% in the first quarter, worse than forecasts. While the Bank of Japan acknowledged the risks posed by U.S. trade policies, it remains confident that rising wages and prices will support eventual policy normalization. Investors are closely watching U.S.-Japan trade negotiations, with Japan insisting that any deal must include the auto sector and that the 25% U.S. tariff on Japanese cars be removed.
Resistance is noted at 148.60, with further barriers at 149.80 and 151.20. Major support levels lie at 139.70, 137.00, and 135.00.
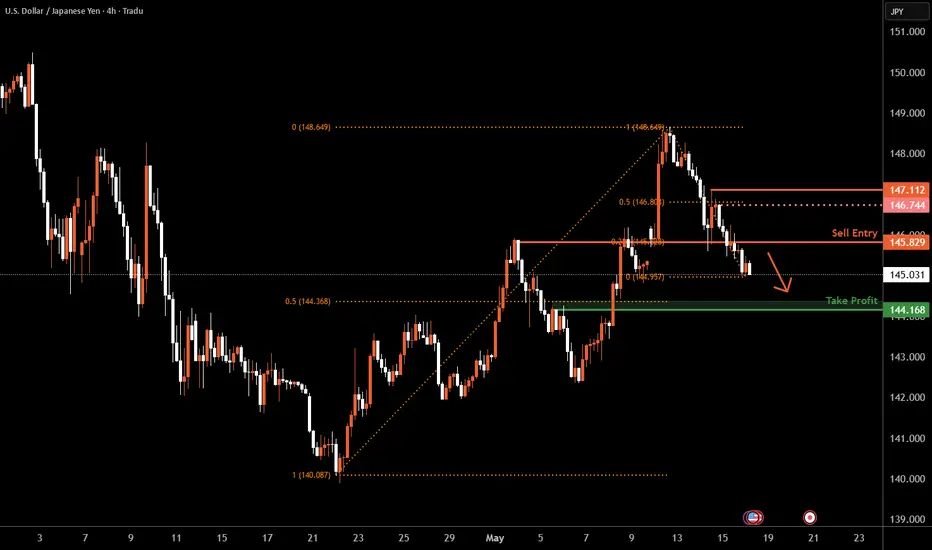
USD/JPY H4 | Overlap resistance at 23.6% Fibonacci retracementUSD/JPY is rising towards an overlap resistance and could potentially reverse off this level to drop lower.
Sell entry is at 145.82 which is an overlap resistance that aligns with the 23.6% Fibonacci retracement.
Stop loss is at 147.11 which is a level that sits above the 50.0% Fibonacci retracement and a swing-high resistance.
Take profit is at 144.16 which is a pullback support that aligns with the 50.0% Fibonacci retracement.
High Risk Investment Warning
Trading Forex/CFDs on margin carries a high level of risk and may not be suitable for all investors. Leverage can work against you.
Stratos Markets Limited (tradu.com):
CFDs are complex instruments and come with a high risk of losing money rapidly due to leverage. 63% of retail investor accounts lose money when trading CFDs with this provider. You should consider whether you understand how CFDs work and whether you can afford to take the high risk of losing your money.
Stratos Europe Ltd (tradu.com):
CFDs are complex instruments and come with a high risk of losing money rapidly due to leverage. 63% of retail investor accounts lose money when trading CFDs with this provider. You should consider whether you understand how CFDs work and whether you can afford to take the high risk of losing your money.
Stratos Global LLC (tradu.com):
Losses can exceed deposits.
Please be advised that the information presented on TradingView is provided to Tradu (‘Company’, ‘we’) by a third-party provider (‘TFA Global Pte Ltd’). Please be reminded that you are solely responsible for the trading decisions on your account. There is a very high degree of risk involved in trading. Any information and/or content is intended entirely for research, educational and informational purposes only and does not constitute investment or consultation advice or investment strategy. The information is not tailored to the investment needs of any specific person and therefore does not involve a consideration of any of the investment objectives, financial situation or needs of any viewer that may receive it. Kindly also note that past performance is not a reliable indicator of future results. Actual results may differ materially from those anticipated in forward-looking or past performance statements. We assume no liability as to the accuracy or completeness of any of the information and/or content provided herein and the Company cannot be held responsible for any omission, mistake nor for any loss or damage including without limitation to any loss of profit which may arise from reliance on any information supplied by TFA Global Pte Ltd.
The speaker(s) is neither an employee, agent nor representative of Tradu and is therefore acting independently. The opinions given are their own, constitute general market commentary, and do not constitute the opinion or advice of Tradu or any form of personal or investment advice. Tradu neither endorses nor guarantees offerings of third-party speakers, nor is Tradu responsible for the content, veracity or opinions of third-party speakers, presenters or participants.
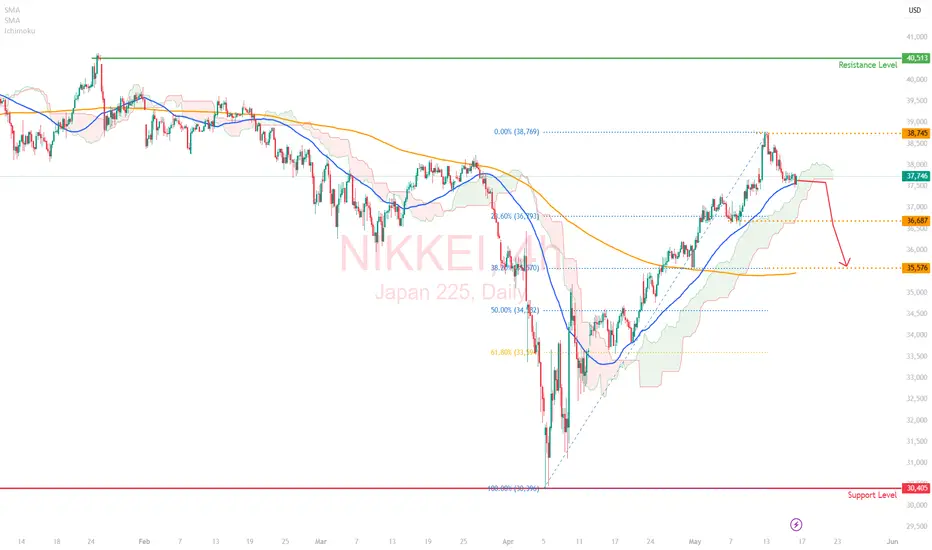
Are you shorting the bounce or waiting for confirmation?Japan’s Q1 GDP came in worse than expected: -0.2% QoQ (-0.7% annualized). Weak consumption, soft exports, and a fading external boost despite a weak yen isn't a great combo for Asia’s largest export economy.
The Nikkei 225 reacted immediately, and the H4 chart is starting to reflect deeper structural pressure.
🔍 Technical Outlook:
- Price reversed from the high of 38,745.
- Price is testing the 50 SMA and could enter the Ichimoku cloud.
- The cloud is signalling a twist, which could be a sign of momentum fading and the trend weakening or reversing.
📊 Projection:
If the price closes below the 50 SMA and breaks through the cloud, further downside could be expected, with the target levels at
- 36,800 (last consolidation zone), and
- 35,570 (38.2% fibonacci retracement level and 200 SMA).
Alternatively, if the bulls defend the cloud, we could see the price climb to the resistance level of 40,500
This is a classic macro meets technicals moment. A weak data print is lining up against the possibility of a technical rollover.
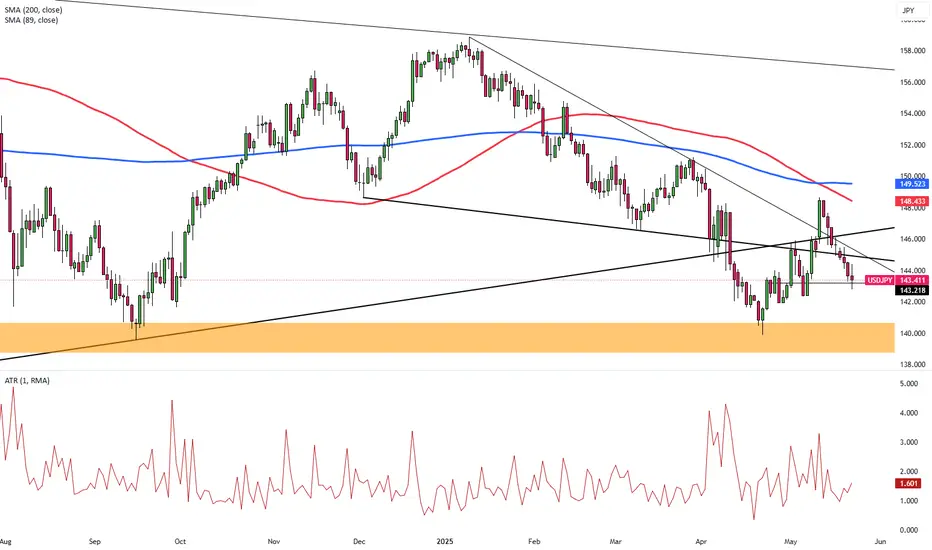
YEN /US Carry trade to unwind more downside The chart posted so far the last 18 months has been on track .this has been supportive for the SP markets and is starting to roll over once again .But this time we break A major head n should neckline taking the this trade down to a 125 .128 handle . The markets are on thin ice and should see an issue in which the BOJ and Fed will have to step in .But the issue is the feds hands this time are Tied as the Ten year is setting up to move to 5 plus into late fall I said last year in early December 2024 we would be moving into Stagflation for the next two years . I still thing on track . WAVETIMER
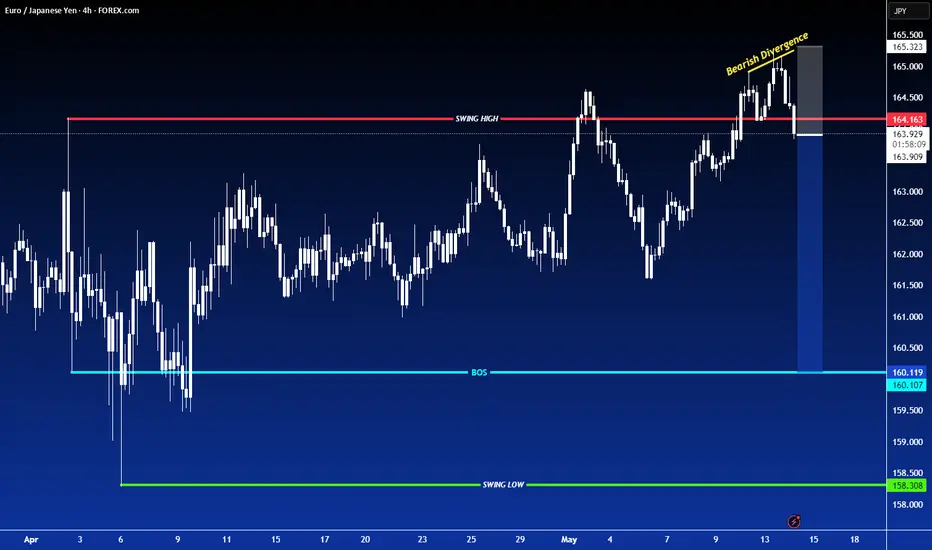
SHORT ON EUR/JPYOANDA:EURJPY has created a double top with bearish divergence at a major supply zone.
I will be selling EJ to the next level of support/demand for over 200 pips.
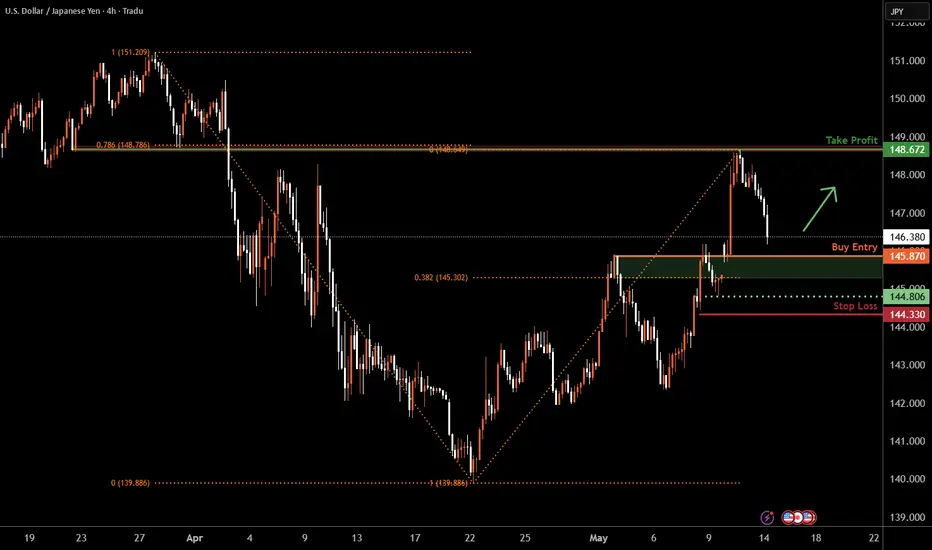
USD/JPY H4 | Potential bullish bounce off an overlap supportUSD/JPY is falling towards an overlap support and could potentially bounce off this level to climb higher.
Buy entry is at 145.87 which is an overlap support that aligns close the 38.2% Fibonacci retracement.
Stop loss is at 144.33 which is a level that lies underneath an overlap support.
Take profit is at 148.67 which is an overlap resistance that aligns with the 78.6% Fibonacci retracement.
High Risk Investment Warning
Trading Forex/CFDs on margin carries a high level of risk and may not be suitable for all investors. Leverage can work against you.
Stratos Markets Limited (tradu.com):
CFDs are complex instruments and come with a high risk of losing money rapidly due to leverage. 63% of retail investor accounts lose money when trading CFDs with this provider. You should consider whether you understand how CFDs work and whether you can afford to take the high risk of losing your money.
Stratos Europe Ltd (tradu.com):
CFDs are complex instruments and come with a high risk of losing money rapidly due to leverage. 63% of retail investor accounts lose money when trading CFDs with this provider. You should consider whether you understand how CFDs work and whether you can afford to take the high risk of losing your money.
Stratos Global LLC (tradu.com):
Losses can exceed deposits.
Please be advised that the information presented on TradingView is provided to Tradu (‘Company’, ‘we’) by a third-party provider (‘TFA Global Pte Ltd’). Please be reminded that you are solely responsible for the trading decisions on your account. There is a very high degree of risk involved in trading. Any information and/or content is intended entirely for research, educational and informational purposes only and does not constitute investment or consultation advice or investment strategy. The information is not tailored to the investment needs of any specific person and therefore does not involve a consideration of any of the investment objectives, financial situation or needs of any viewer that may receive it. Kindly also note that past performance is not a reliable indicator of future results. Actual results may differ materially from those anticipated in forward-looking or past performance statements. We assume no liability as to the accuracy or completeness of any of the information and/or content provided herein and the Company cannot be held responsible for any omission, mistake nor for any loss or damage including without limitation to any loss of profit which may arise from reliance on any information supplied by TFA Global Pte Ltd.
The speaker(s) is neither an employee, agent nor representative of Tradu and is therefore acting independently. The opinions given are their own, constitute general market commentary, and do not constitute the opinion or advice of Tradu or any form of personal or investment advice. Tradu neither endorses nor guarantees offerings of third-party speakers, nor is Tradu responsible for the content, veracity or opinions of third-party speakers, presenters or participants.
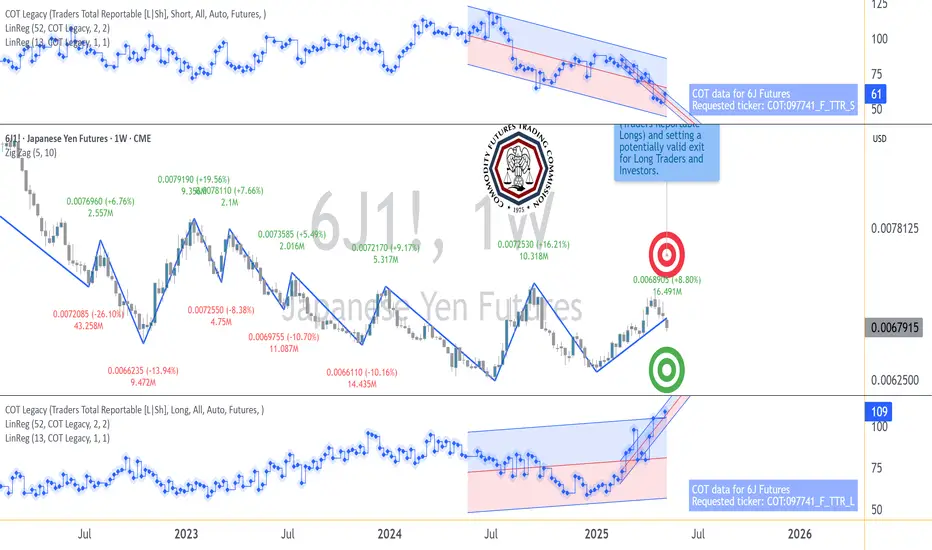
The Yen’s Comeback Starts Here—and it Seems the COT Knew First1. Introduction: A Market Everyone Gave Up On
For a while, the Japanese Yen looked like a lost cause. After topping out in early 2021, Yen futures (6J1!) began an unrelenting slide, shedding value week after week like an old coat in spring. Traders stopped asking, “Where’s support?” and started asking, “How low can it go?”
The macro backdrop didn’t help. The Bank of Japan clung to ultra-loose monetary policy, even as the Fed hiked aggressively. Speculators piled on shorts. The Yen was a one-way ticket down, and no one seemed interested in punching the brakes.
But beneath that apathy, a quieter shift was underway. While price kept bleeding, trader positioning began to hint at something different—something the chart didn’t show yet. And if you were watching the Commitments of Traders (COT) report closely enough, you might’ve seen it.
2. The COT Trend That No One Was Watching
The COT report isn’t glamorous. It’s slow, lagging by a few days, and rarely makes headlines. But for those who track what the big players are doing—those large enough to be required to report their positions—it’s a treasure trove of subtle clues.
One of those clues is Total Reportable Positions. This metric tells us how active large market participants really are—regardless of whether they’re long or short. When that number is dropping, it suggests the “big dogs” are losing interest. When it starts climbing again? Someone’s gearing up to play.
From 2021 through most of 2024, Total Reportable Positions in 6J were in a steady decline—mirroring the slow death of the Yen's bullish case. But in late 2024, something changed. Using a simple linear regression channel on this COT data, a clear breakout emerged. Positioning was picking up again—for the first time in nearly three years.
And it wasn’t just a bounce. It was a structural shift.
3. Did Price Listen?
Yes—and no. Price didn't immediately explode higher. But the structure began to change. The market stopped making new lows. Weekly closes began to cluster above support. And importantly, a Zig Zag analysis started marking a pattern of higher lows—the first signs of accumulation.
Here’s where the chart really gets interesting: the timing of the COT breakout coincided almost perfectly with a key UFO support at 0.0065425—a price level that also marked the bottom in COT Traders Total Reportable Longs. This adds a powerful layer of confirmation: institutional orders weren’t just showing up in the data—they were leaving footprints on the chart.
And above? There’s a UFO resistance level at 0.0075395. If the Yen continues to climb, that could be a significant price level where early longs may choose to lighten up.
4. The Contract Behind the Story
Before we go deeper, let’s talk about what you’re actually trading when you pull the trigger on Yen Futures.
The CME Japanese Yen futures (6J) contract represents 12.5 million Japanese Yen, and each tick move—just 0.0000005 per JPY—is worth $6.25. It’s precise, it’s liquid, and for traders who like to build macro positions or take advantage of carry flows, it’s a staple.
As of May 2025, margin requirements hover around ~$3,800 (Always double-check with your broker or clearing firm—these numbers shift from time to time.)
But maybe you’re not managing seven-figure accounts. Maybe you just want to test this setup with more flexibility. That’s where the Micro JPY/USD Futures (MJY) come in.
Contract size: 1/10th the size of 6J
Tick move: 0.000001 per JPY increment = $1.25
Same market structure, tighter margin requirement around ~$380 per contract
Important note: The COT report aggregates positioning across the whole futures market—it doesn’t separate out micro traders from full-size. So yes, the data still applies. And yes, it still matters.
5. Lessons from the Shift
This isn’t about hindsight bias. The value in this setup isn’t that the Yen happened to bounce—it’s how Total Reportable Positions broke trend before price did.
Here are the real takeaways:
COT data may or may not be predictive—but it is insightful. When positioning starts expanding after a long contraction, it often signals renewed interest or risk-taking. That’s tradable information.
Technical support and resistance as well as highs and lows give context. Without them, COT breakouts can feel theoretical. With them, you have real, observable UFO levels where institutions may act—and where you can plan.
6. Watchlist Insights: Where This Might Work Again
You don’t have to wait for another yen setup to apply this framework. The same structure can help you scout for early positioning shifts across the CME product universe.
Here’s a simple filter to start building your own COT watchlist:
✅ Look for markets where:
Price has been in a long, clean downtrend (or uptrend)
Total Reportable Positions are falling—but starting to reverse
A breakout occurs in positioning trend (draw a regression channel and watch for a clean violation)
A key support or resistance lines up with recent extremes in COT positioning
Whether it's crude oil, corn, or euro FX, this template gives you a framework for exploration.
🎯 Want to See More Setups Like This?
We’re just getting started. If this breakdown opened your eyes to new ways of using COT reports, UFO levels, and multi-dimensional trade setups, keep watching this space.
When charting futures, the data provided could be delayed. Traders working with the ticker symbols discussed in this idea may prefer to use CME Group real-time data plan on TradingView: tradingview.sweetlogin.com - This consideration is particularly important for shorter-term traders, whereas it may be less critical for those focused on longer-term trading strategies.
General Disclaimer:
The trade ideas presented herein are solely for illustrative purposes forming a part of a case study intended to demonstrate key principles in risk management within the context of the specific market scenarios discussed. These ideas are not to be interpreted as investment recommendations or financial advice. They do not endorse or promote any specific trading strategies, financial products, or services. The information provided is based on data believed to be reliable; however, its accuracy or completeness cannot be guaranteed. Trading in financial markets involves risks, including the potential loss of principal. Each individual should conduct their own research and consult with professional financial advisors before making any investment decisions. The author or publisher of this content bears no responsibility for any actions taken based on the information provided or for any resultant financial or other losses.
Global Calm, Fiscal Storm: The Yen's Challenge?The USD/JPY currency pair has recently experienced a notable surge, driving the Japanese Yen to its weakest level against the US Dollar in a month. This appreciation primarily stems from a significant improvement in global risk sentiment, sparked by a breakthrough trade agreement between the United States and China. This deal, aimed at reducing the US trade deficit, has bolstered investor confidence and diminished the traditional safe-haven appeal of the Yen. Adding to the dollar's strength is the Federal Reserve's continued hawkish stance, signaling no immediate plans for interest rate cuts and reinforcing the attractiveness of dollar-denominated assets amidst easing concerns about a US recession.
Simultaneously, internal economic pressures in Japan significantly weigh on the Yen. The nation's public debt has reached an unprecedented high, driven by persistent increases in defense spending and social welfare costs due to an aging population. Government subsidies for energy bills and the need to issue more bonds to cover rising expenditures exacerbate this fiscal strain. This challenging domestic backdrop contrasts sharply with the Federal Reserve's position, creating a widening divergence in monetary policy outlooks that favors the US Dollar through yield differentials, despite the Bank of Japan's cautious consideration of future rate adjustments.
Furthermore, reducing global geopolitical tensions has contributed to the shift away from safe-haven currencies. Recent ceasefires and prospects for diplomatic talks in key conflict areas have encouraged a "risk-on" environment in financial markets. This increased appetite for riskier assets directly reduces demand for the Japanese Yen, amplifying the impact of fundamental economic factors and monetary policy divergence on the USD/JPY exchange rate. The pair's trajectory remains subject to evolving global dynamics, upcoming economic data releases, and central bank communications.