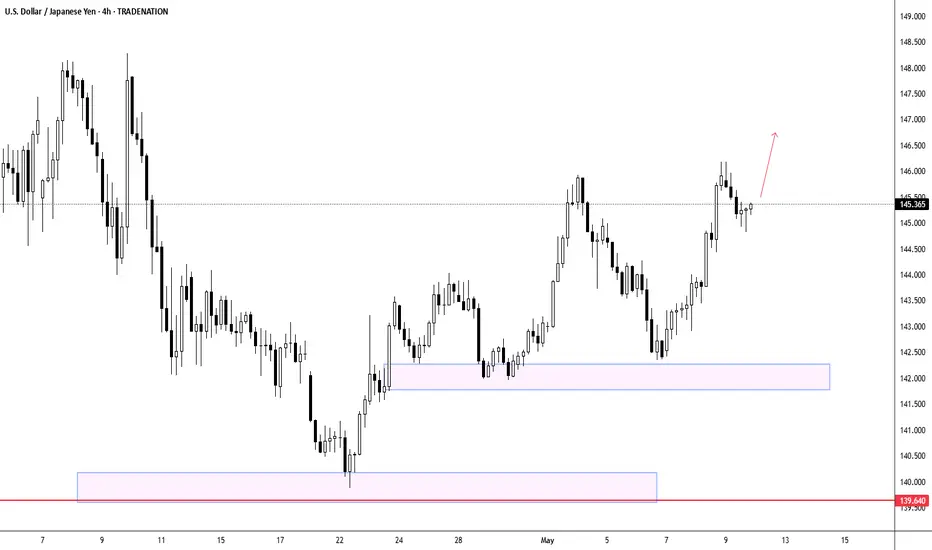
USDJPY - Technical Analysis Favors Dollar Strength AheadBased on the USD/JPY chart, we're seeing a promising bullish setup after the pair rebounded from support around 142.00. The price has formed a higher low and appears to be establishing a potential uptrend, having recently broken above the 145.00 resistance level. With the current price action showing resilience and momentum shifting to the upside, there's a higher probability of continued strength toward potential targets near the previous highs around 148.00. The formation of consecutive bullish candles above key support zones reinforces this positive outlook, suggesting buyers are regaining control after the April decline.
Disclosure: I am part of Trade Nation's Influencer program and receive a monthly fee for using their TradingView charts in my analysis.
Yen
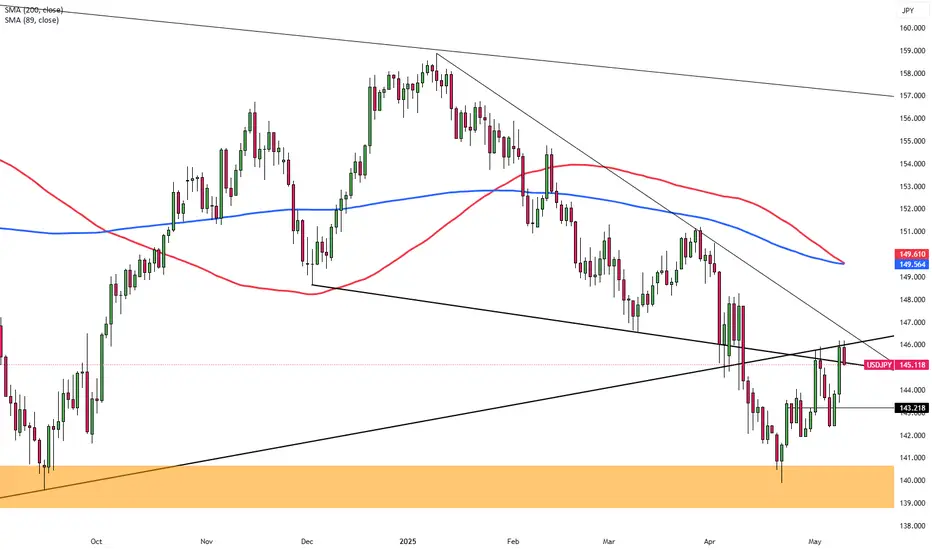
Yen Falls Past 145 as Dollar StrengthensThe Japanese yen weakened past 145 per dollar, hovering near a one-month low as the U.S. dollar strengthened with improving global trade sentiment and diminishing expectations of near-term U.S. rate cuts. The greenback gained momentum after President Trump announced a preliminary trade deal with the UK, the first since broad U.S. tariffs were introduced last month. He also signaled that tariffs on China could be eased, depending on the outcome of high-level trade talks set for this weekend in Switzerland.
Adding pressure on the yen, Fed Chair Powell dismissed the idea of a preemptive rate cut, citing persistent inflation risks and labor market concerns. In Japan, personal spending rose more than expected in March, suggesting resilience in consumption, though a third straight monthly drop in real wages highlighted broader economic challenges.
Resistance stands at 145.90, with further levels at 146.75 and 149.80. Support is found at 139.70, then 137.00 and 135.00.
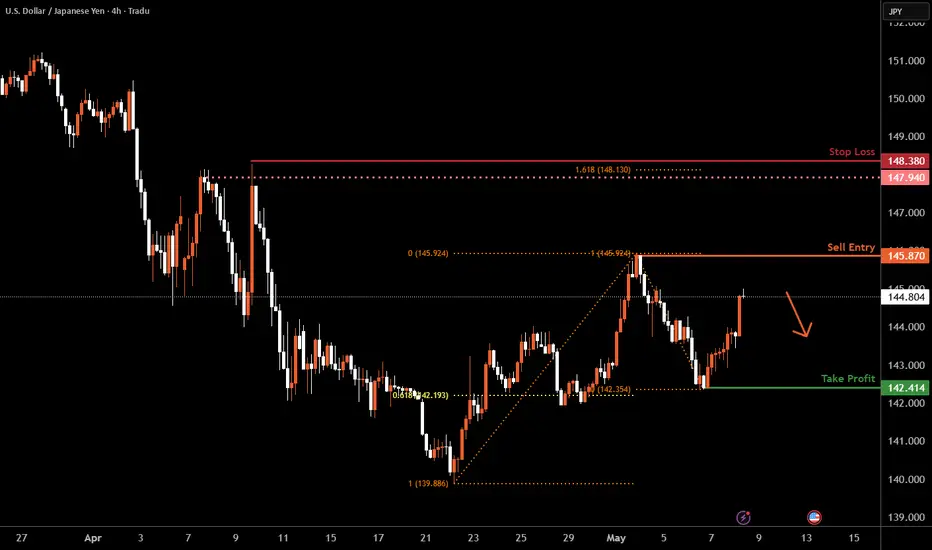
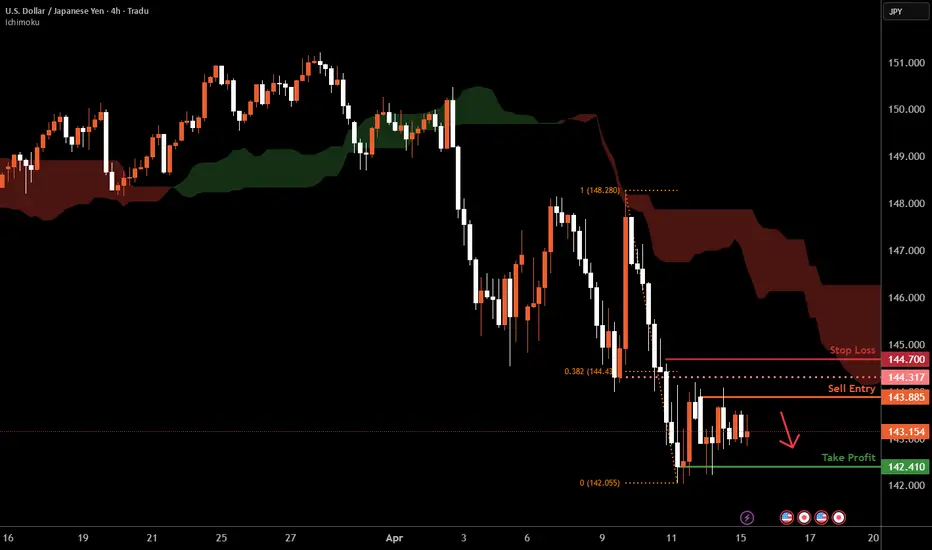
USD/JPY H4 | Approaching a swing-high resistanceUSD/JPY is rising towards a swing-high resistance and could potentially reverse off this level to drop lower.
Sell entry is at 145.87 which is a swing-high resistance.
Stop loss is at 148.38 which is a level that sits above the 161.8% Fibonacci extension and a multi-swing-high resistance.
Take profit is at 142.41 which is a swing-low support that aligns close to a 61.8% Fibonacci retracement.
High Risk Investment Warning
Trading Forex/CFDs on margin carries a high level of risk and may not be suitable for all investors. Leverage can work against you.
Stratos Markets Limited (tradu.com):
CFDs are complex instruments and come with a high risk of losing money rapidly due to leverage. 63% of retail investor accounts lose money when trading CFDs with this provider. You should consider whether you understand how CFDs work and whether you can afford to take the high risk of losing your money.
Stratos Europe Ltd (tradu.com):
CFDs are complex instruments and come with a high risk of losing money rapidly due to leverage. 63% of retail investor accounts lose money when trading CFDs with this provider. You should consider whether you understand how CFDs work and whether you can afford to take the high risk of losing your money.
Stratos Global LLC (tradu.com):
Losses can exceed deposits.
Please be advised that the information presented on TradingView is provided to Tradu (‘Company’, ‘we’) by a third-party provider (‘TFA Global Pte Ltd’). Please be reminded that you are solely responsible for the trading decisions on your account. There is a very high degree of risk involved in trading. Any information and/or content is intended entirely for research, educational and informational purposes only and does not constitute investment or consultation advice or investment strategy. The information is not tailored to the investment needs of any specific person and therefore does not involve a consideration of any of the investment objectives, financial situation or needs of any viewer that may receive it. Kindly also note that past performance is not a reliable indicator of future results. Actual results may differ materially from those anticipated in forward-looking or past performance statements. We assume no liability as to the accuracy or completeness of any of the information and/or content provided herein and the Company cannot be held responsible for any omission, mistake nor for any loss or damage including without limitation to any loss of profit which may arise from reliance on any information supplied by TFA Global Pte Ltd.
The speaker(s) is neither an employee, agent nor representative of Tradu and is therefore acting independently. The opinions given are their own, constitute general market commentary, and do not constitute the opinion or advice of Tradu or any form of personal or investment advice. Tradu neither endorses nor guarantees offerings of third-party speakers, nor is Tradu responsible for the content, veracity or opinions of third-party speakers, presenters or participants.
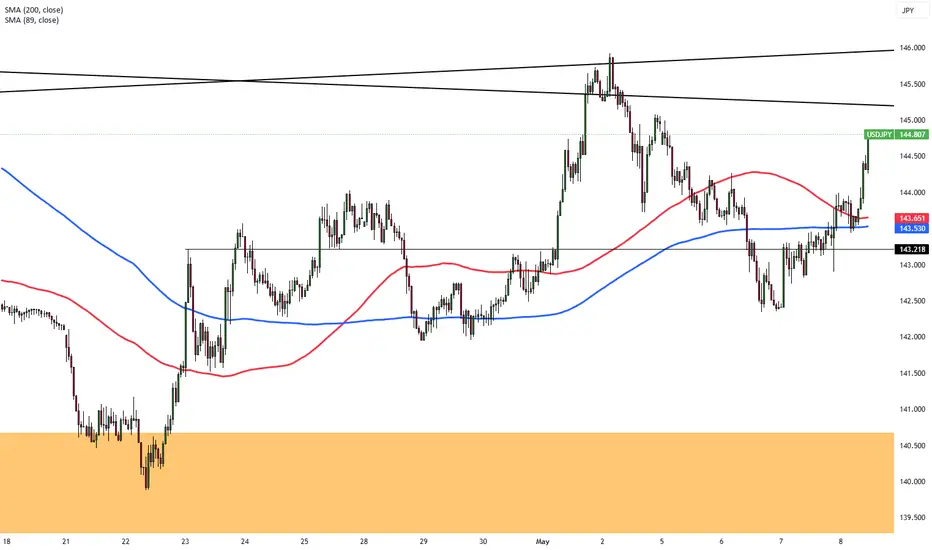
Yen Firms with BoJ CautionThe Japanese yen strengthened to around 143.6 per dollar on Thursday, recovering as rising global trade uncertainty stimulated demand for gold. The move followed President Trump’s announcement of a deal with a “big” country, reportedly the UK, and his refusal to cut tariffs on China ahead of U.S.-China talks in Switzerland. U.S.-Japan negotiations continue, with Tokyo aiming to finalize a bilateral deal by June. Meanwhile, BoJ minutes showed policymakers remain open to rate hikes if inflation targets are met, though they flagged external risks from U.S. trade policy.
Resistance stands at 145.90, with further levels at 146.75 and 149.80. Support is found at 139.70, then 137.00 and 135.00.
Japanese Yen Pairs: A Short Guide on Relative StrengthIndicators are a popular choice among many traders, and they certainly have their place in my own toolkit. But sometimes it is best to simply look the price to gauge strength. And doing so, it can help us scenario plan for future events. After I take a quick look at Japanese yen pairs, I wrap up on my preferred setup.
Matt Simpson, Market Analyst at Forex.com and City Index

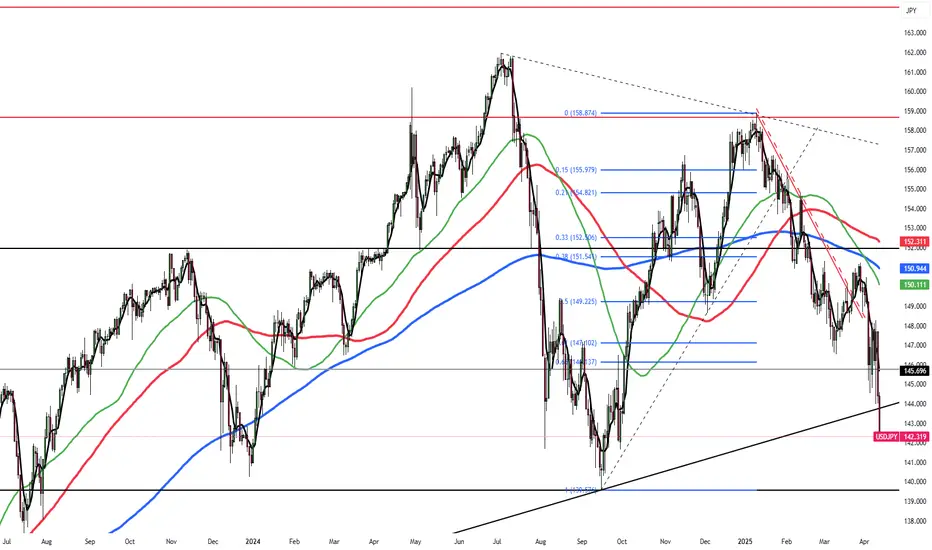
USD/JPY : Get Ready for another Rally! (READ THE CAPTION)By analyzing the USD/JPY chart on the daily timeframe, we can see that, as expected, the price has finally started to rise. So far, it has successfully reached the 143.5 and 144 targets, and extended up to 145.76, delivering a solid 350-pip move.
The main analysis remains valid, and I expect the price to hit the next target at 146.2 soon.
The total gain from this setup has now exceeded 570 pips, and the key upcoming supply zones are at 146.2, 148.7, and 150.
This analysis will be updated accordingly!
THE MAIN ANALYSIS :
Please support me with your likes and comments to motivate me to share more analysis with you and share your opinion about the possible trend of this chart with me !
Best Regards , Arman Shaban

USDJPY Weekly Rejection at Support-Revisit Bearish Order Block?USDJPY pair last trading week got rejected at the same level that the pair has previously acted as a support level. Will this rejection cause USDJPY to rally towards a bearish order block above 147.50?
Risk Zones: 146.50
N.B!
- USDJPY price might not follow the drawn lines . Actual price movements may likely differ from the forecast.
- Let emotions and sentiments work for you
- ALWAYS Use Proper Risk Management In Your Trades
#usdjpy
#usd
#jpy

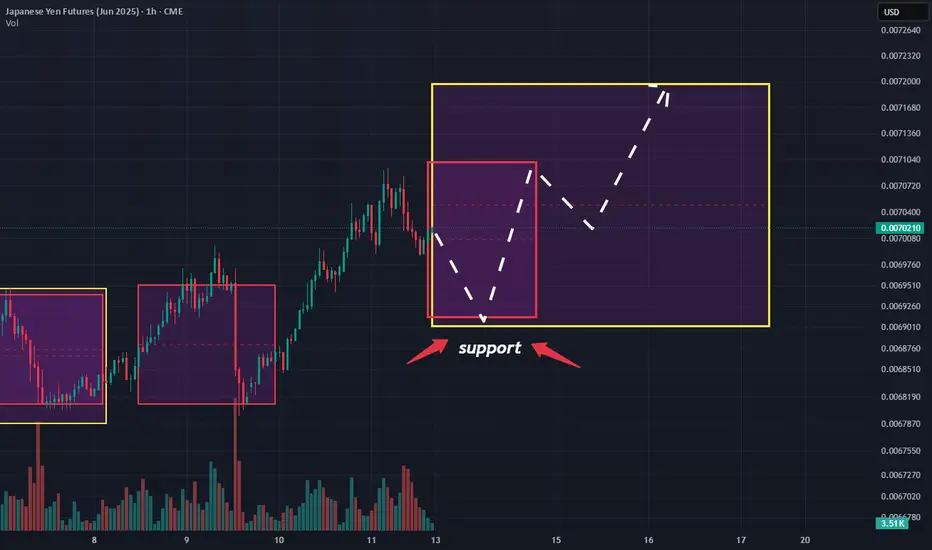
I've Cracked the BEARISH Code for Japanese Yen Using COTJapanese Yen is setup for sells based on COT positioning and other underlying fundamental conditions.

Haven play: Long yen back in focusAmid growing uncertainty surrounding U.S. equities and the US dollar, investors could be returning to a traditional defensive strategy: going long on the Japanese yen.
While some analysts believe the recent yen rally is not yet overstretched, the International Monetary Fund (IMF) has noted that Japan’s central bank is likely to push back the timing of further interest rate hikes, a factor that could limit the yen's potential to strengthen further. As such, we are looking at the support level of 140.00 and the bearish-yen sentiment seen today, and the potential resistance at 144.80.
Up next: a scheduled meeting between Japan’s Finance Minister Kato and U.S. Treasury Secretary Bessent later this week.

GBPJPY IS A BUY (Britsh Pound-CPI News)TP: 190.00+
SL: 187.00
There is support forming for GBPJPY, which we could be looking for a buying opportunity. We have CPI news for the British Pound Dollar that could make this possible on Wednesday.
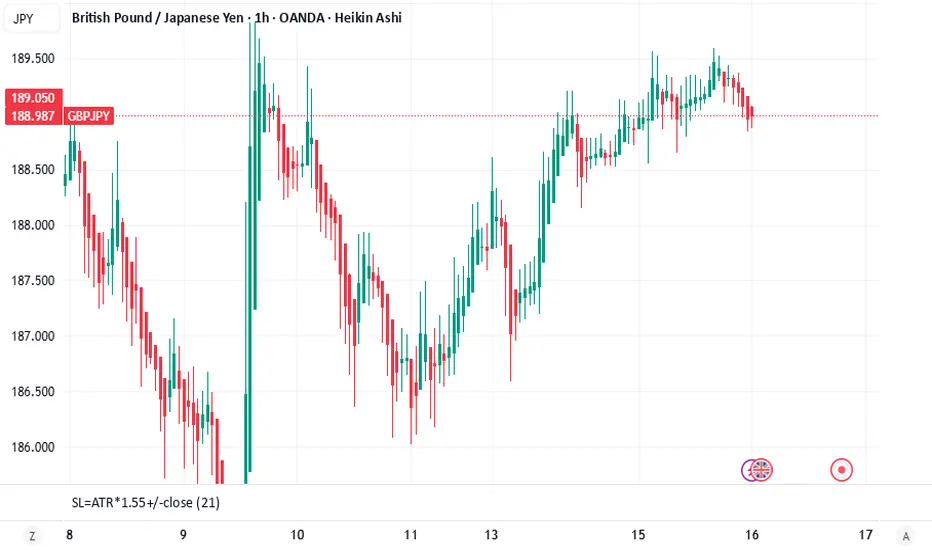
USD/JPY H4 | Downtrend to extend further?USD/JPY is rising towards a pullback resistance and could potentially reverse off this level to drop lower.
Sell entry is at 141.82 which is a pullback resistance.
Stop loss is at 143.20 which is a level that sits above an overlap resistance.
Take profit is at 139.85 which is a swing-low support.
High Risk Investment Warning
Trading Forex/CFDs on margin carries a high level of risk and may not be suitable for all investors. Leverage can work against you.
Stratos Markets Limited (tradu.com):
CFDs are complex instruments and come with a high risk of losing money rapidly due to leverage. 63% of retail investor accounts lose money when trading CFDs with this provider. You should consider whether you understand how CFDs work and whether you can afford to take the high risk of losing your money.
Stratos Europe Ltd (tradu.com):
CFDs are complex instruments and come with a high risk of losing money rapidly due to leverage. 63% of retail investor accounts lose money when trading CFDs with this provider. You should consider whether you understand how CFDs work and whether you can afford to take the high risk of losing your money.
Stratos Global LLC (tradu.com):
Losses can exceed deposits.
Please be advised that the information presented on TradingView is provided to Tradu (‘Company’, ‘we’) by a third-party provider (‘TFA Global Pte Ltd’). Please be reminded that you are solely responsible for the trading decisions on your account. There is a very high degree of risk involved in trading. Any information and/or content is intended entirely for research, educational and informational purposes only and does not constitute investment or consultation advice or investment strategy. The information is not tailored to the investment needs of any specific person and therefore does not involve a consideration of any of the investment objectives, financial situation or needs of any viewer that may receive it. Kindly also note that past performance is not a reliable indicator of future results. Actual results may differ materially from those anticipated in forward-looking or past performance statements. We assume no liability as to the accuracy or completeness of any of the information and/or content provided herein and the Company cannot be held responsible for any omission, mistake nor for any loss or damage including without limitation to any loss of profit which may arise from reliance on any information supplied by TFA Global Pte Ltd.
The speaker(s) is neither an employee, agent nor representative of Tradu and is therefore acting independently. The opinions given are their own, constitute general market commentary, and do not constitute the opinion or advice of Tradu or any form of personal or investment advice. Tradu neither endorses nor guarantees offerings of third-party speakers, nor is Tradu responsible for the content, veracity or opinions of third-party speakers, presenters or participants.
CREDIT CRISISWe are beginning to see evidence of a credit crisis starting. low demand for US bonds can trigger a currency crisis for the USD, higher rates will lead to refinancing company problems (especially with all the zombie companies that should have blown up over a decade ago.) and major economic depression-style job losses.
Currently, we are very early stages but things are moving at lightning speed on a macroeconomic level.
I know this is likely gibberish to most here pon trading view but it is of MASSIVE importance to your trading and investing.
CAUTION IS IN ORDER!!
Click boost, follow, and subscribe! I can help you navigate these crazy times.

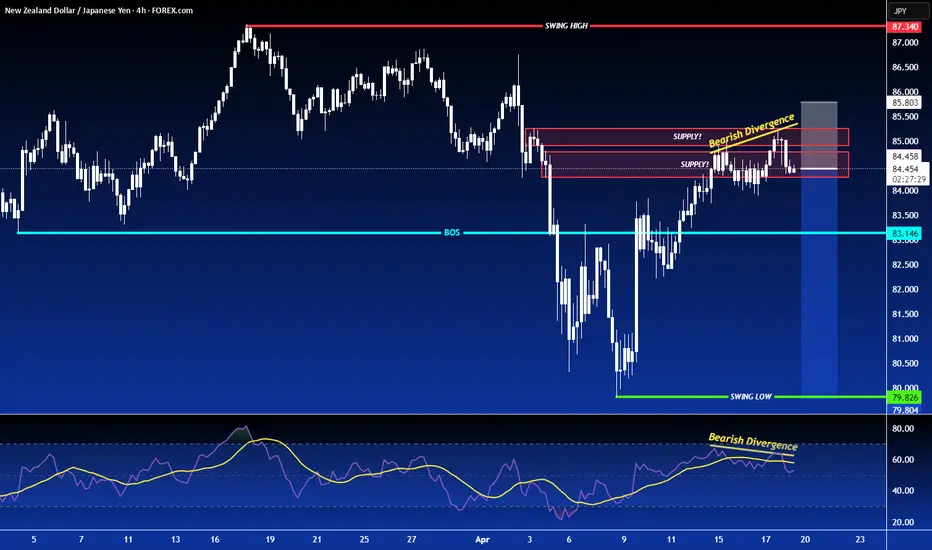
SHORT ON NZD/JPYNZD/JPY is in a overall downtrend.
Price has completed its pullback phase to a key supply area and has created bearish divergence.
I expect price to drop to the next support level which was the previous low it created. (green line).
I am aiming to make 300-400 pips
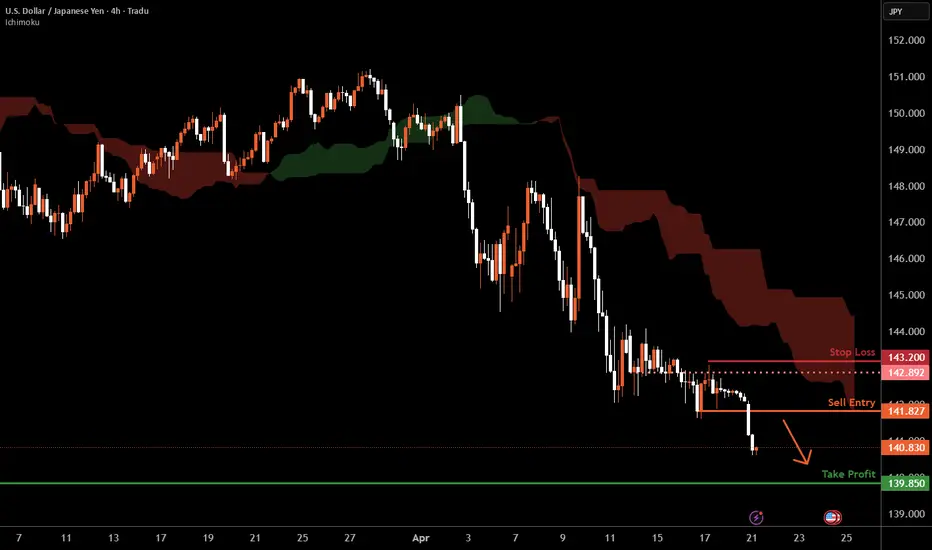
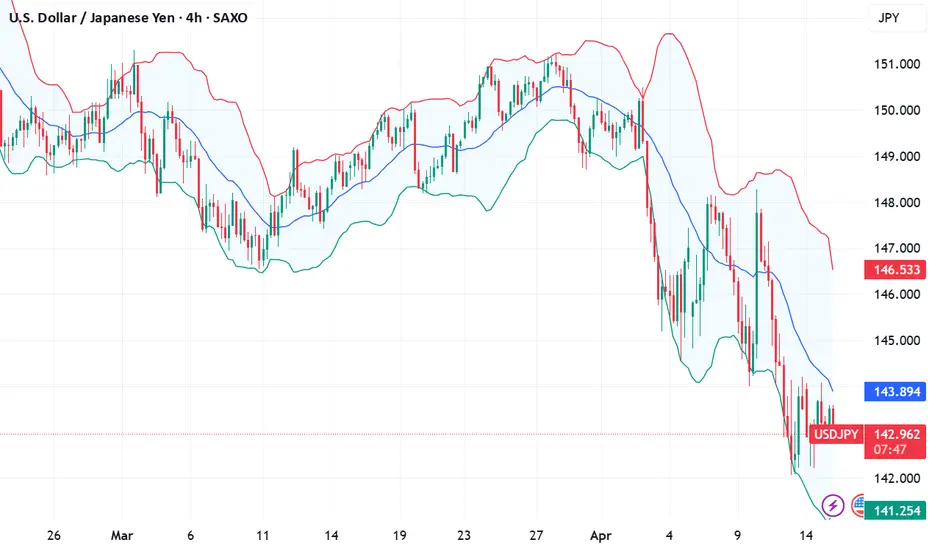
USD/JPY H4 | Approaching a multi-swing-high resistanceUSD/JPY is rising towards a multi-swing-high resistance and could potentially reverse off this level to drop lower.
Sell entry is at 143.88 which is a multi-swing-high resistance.
Stop loss is at 144.70 which is a level that sits above the 38.2% Fibonacci retracement and a pullback resistance.
Take profit is at 142.41 which is a multi-swing-low support.
High Risk Investment Warning
Trading Forex/CFDs on margin carries a high level of risk and may not be suitable for all investors. Leverage can work against you.
Stratos Markets Limited (tradu.com):
CFDs are complex instruments and come with a high risk of losing money rapidly due to leverage. 63% of retail investor accounts lose money when trading CFDs with this provider. You should consider whether you understand how CFDs work and whether you can afford to take the high risk of losing your money.
Stratos Europe Ltd (tradu.com):
CFDs are complex instruments and come with a high risk of losing money rapidly due to leverage. 63% of retail investor accounts lose money when trading CFDs with this provider. You should consider whether you understand how CFDs work and whether you can afford to take the high risk of losing your money.
Stratos Global LLC (tradu.com):
Losses can exceed deposits.
Please be advised that the information presented on TradingView is provided to Tradu (‘Company’, ‘we’) by a third-party provider (‘TFA Global Pte Ltd’). Please be reminded that you are solely responsible for the trading decisions on your account. There is a very high degree of risk involved in trading. Any information and/or content is intended entirely for research, educational and informational purposes only and does not constitute investment or consultation advice or investment strategy. The information is not tailored to the investment needs of any specific person and therefore does not involve a consideration of any of the investment objectives, financial situation or needs of any viewer that may receive it. Kindly also note that past performance is not a reliable indicator of future results. Actual results may differ materially from those anticipated in forward-looking or past performance statements. We assume no liability as to the accuracy or completeness of any of the information and/or content provided herein and the Company cannot be held responsible for any omission, mistake nor for any loss or damage including without limitation to any loss of profit which may arise from reliance on any information supplied by TFA Global Pte Ltd.
The speaker(s) is neither an employee, agent nor representative of Tradu and is therefore acting independently. The opinions given are their own, constitute general market commentary, and do not constitute the opinion or advice of Tradu or any form of personal or investment advice. Tradu neither endorses nor guarantees offerings of third-party speakers, nor is Tradu responsible for the content, veracity or opinions of third-party speakers, presenters or participants.
Fundamental Market Analysis for April 15, 2025 USDJPYThe Japanese yen (JPY) is declining during the Asian session on Tuesday, which, along with a modest rise in the US dollar (USD), is lifting the USD/JPY pair closer to the mid-143.00s. US President Donald Trump's cancellation of tariffs on major consumer electronics and the signal that he may temporarily exempt the auto industry from the 25 per cent duties continue to support market optimism. This in turn undermines demand for traditional safe-haven assets, including the yen.
However, the rapidly escalating trade war between the US and China and lingering concerns over the potential economic impact of Trump's crippling tariffs should temper market optimism. Meanwhile, expectations that the Bank of Japan (BoJ) will continue to raise interest rates are strongly at odds with bets on more aggressive policy easing by the Federal Reserve (Fed). This, along with hopes of a trade deal between the US and Japan, should limit losses for the low-yielding Yen.
Trade recommendation: SELL 142.80, SL 144.50, TP 140.50
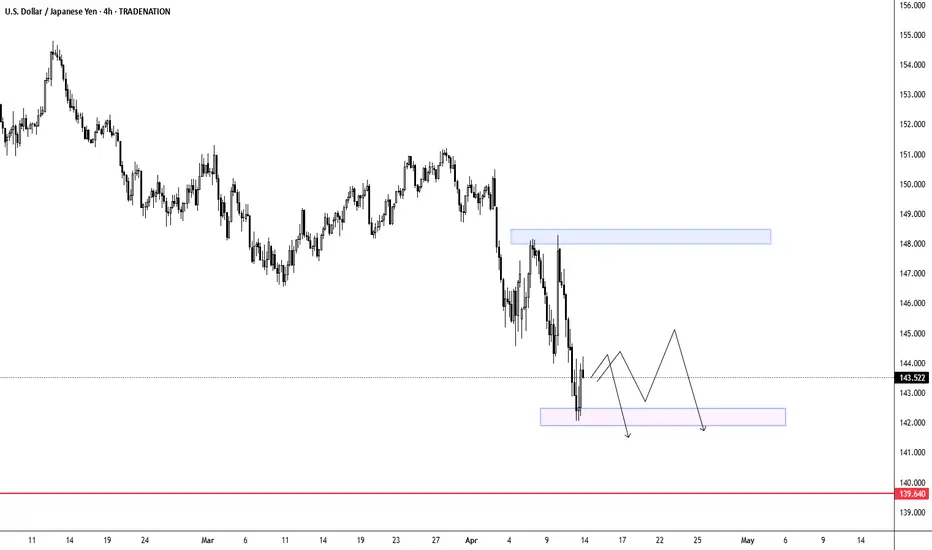
USDJPY - Bearish Momentum Points to Further Downside PotentialBased on the USD/JPY 4-hour chart, the higher probability move appears to be to the downside. The pair has established a clear downtrend since early February, with lower highs and lower lows, and recently broke below the significant support level around 144.00. The recent steep decline from late March to early April shows strong bearish momentum, with price now hovering near 143.50 after a modest retracement. The charted projection suggests further downside movement with potential targets around 142.00-141.00 in the short term, while the highlighted support zone around 142.00 and major support at 139.64 could attract price action. With resistance firmly established in the 147.00-148.00 region and the overall bearish structure intact, sellers appear to have control of this market for the foreseeable future.
Disclosure: I am part of Trade Nation's Influencer program and receive a monthly fee for using their TradingView charts in my analysis.
Quotes Dropping? Here’s How to Find Support & Gain Best DealHave you ever found yourself wondering how to make sense of fluctuating quotes?
What if I told you that the powerful key lies in understanding the power of expected range volatility?
Ready? Let me 5 min to introduce you how understanding expected range volatility can give you the edge you need to succeed.
The expected range volatility (ER) provides a framework for understanding how much the asset could move within a specific timeframe. Statistically, price movements within the expected volatility corridor have a 68% probability, based on CME market data and a Nobel Prize-winning calculation formula. This means that traders can rely on these insights as a powerful filter for making more precise entry points into trades.
Key insight: when the market is quiet, and we approach certain price levels, there’s a 68% chance that the price won’t break through those boundaries.
The ER formula is available on the CME exchange's website, and in just a few minutes, you can input the data to get incredible results. It’s truly amazing!
I remember the first time I stumbled upon the ER tool. It felt like finding a gold mine in the trading world! I was amazed that such a powerful resource was available for free, yet it remained unnoticed by 95% of traders.
At that moment, I began to explore the trading community and was shocked to see how underestimated this tool was. I couldn’t find a single author who utilized such valuable data in their analysis.
But once I began to focus on expected range volatility and the data provided by the CME, everything changed. Since that I never make intraday trades without ER data was checked.
Limitations:
• Market Dynamics: Short-term price movements can be unpredictable due to various factors like market sentiment, news, and economic events. The Expected Range provides a statistical estimate but does not guarantee outcomes.
• Assumptions: The formulas assume that price movements follow a log-normal distribution , which may not hold true in all market conditions.
So, what about you? Do you utilizing the power of expected range volatility in your trading strategy? Share your thoughts in the comments below! And if you want make deeper insights , don’t forget to subscribe us.
In the world of trading, knowledge is power.
No Valuable Data - No Edge!🚀💰
Yen Gains on Recession FearsThe yen rose past 144 per dollar, a six-month high, as U.S. recession fears and a Treasury selloff boosted demand for safe-haven assets. Although Trump paused new tariffs for 90 days, total U.S. tariffs on China now stand at 145%, prompting retaliation with China imposing 84% tariffs on U.S. goods. The U.S.-Japan trade outlook remains in focus, with Japan still facing a 10% U.S. tariff but seeking better terms.
Key resistance is at 145.80, with further levels at 148.00 and 152.70. Support stands at 142.00, followed by 139.65 and 138.00.
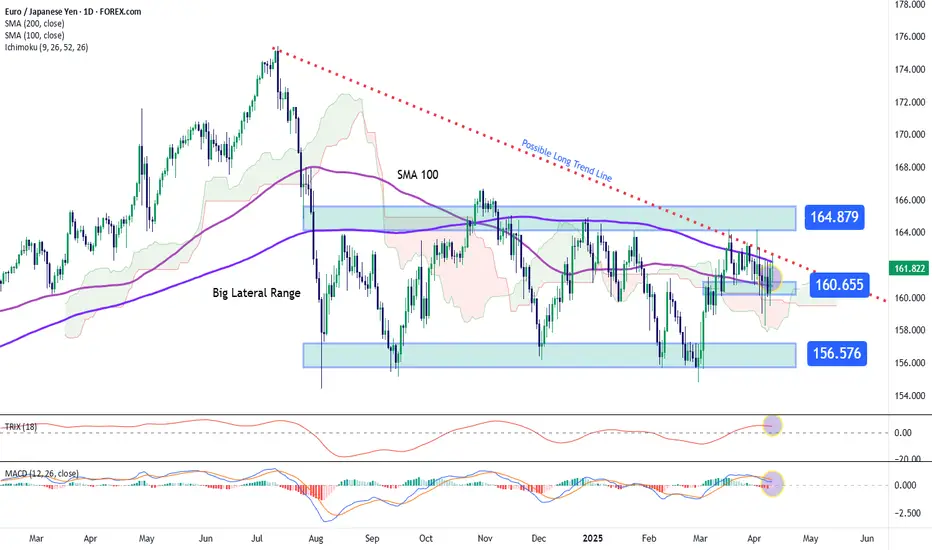
EUR/JPY Continues to Oscillate Within a Broad Sideways RangeThe euro has appreciated more than 1.5% against the Japanese yen over the last two sessions, and the growing bullish momentum in EUR/JPY has been driven mainly by renewed confidence in the euro following the recent weakness in the U.S. dollar. Additionally, the yen has come under downward pressure due to a reduction in safe-haven demand, prompted by Trump’s recent comments suggesting a pause in most tariffs targeting dozens of countries previously threatened in recent weeks. As the trade situation begins to stabilize, bullish pressure on EUR/JPY could become increasingly relevant in the short term.
Broad Sideways Range:
Since early August, a key sideways channel has taken shape, with resistance near 164.879 and support at 156.576. The price has tested both levels on multiple occasions but has so far failed to break out of this long-standing range. For now, this remains the most important technical formation to watch in upcoming trading sessions.
MACD:
The MACD histogram has approached the zero line and could be setting up for a bullish crossover, which may signal that the moving average momentum is starting to shift in favor of buying pressure. As the histogram moves further away from the neutral level, bullish momentum may gain even more significance on the chart.
TRIX:
The TRIX indicator line continues to oscillate above the zero line, indicating a prevailing bullish impulse. If the line continues to rise, this could lead to a stronger bullish momentum developing in the short term.
Key Levels:
164.879 – Upper Range Resistance: This level marks the top of the broad sideways channel and remains the most important resistance in the short term. Price action near this area may continue to reinforce bullish sentiment and could pave the way for a short-term uptrend.
160.655 – Near Support: A mid-range barrier that aligns with the 100-period simple moving average. Continued price action near this level may reinforce the current neutral range, keeping the existing structure intact.
156.576 – Major Support: This level corresponds to the lowest prices in recent months. A clear breakdown below this level could trigger a relevant bearish breakout, opening the door to a new downward trend.
By Julian Pineda, CFA – Market Analyst
Yen Climbs as Trump Softens Stance on Japan TariffsThe Japanese yen strengthened past 147 per dollar on Thursday, moving in a volatile range as trade tensions persisted. Markets reacted to President Trump’s 90-day pause on tariffs for non-retaliating countries, offering Japan some relief with a reduced 10% baseline tariff. However, tensions remained elevated as Trump raised tariffs on Chinese imports to 125% in response to Beijing’s retaliation. The EU may be excluded from the pause due to its own countermeasures. Meanwhile, the U.S. confirmed plans to begin trade talks with Japan after Trump’s call with Prime Minister Shigeru Ishiba.
Key resistance is at 148.70, with further levels at 152.70 and 157.70. Support stands at 145.60, followed by 143.00 and 141.80.
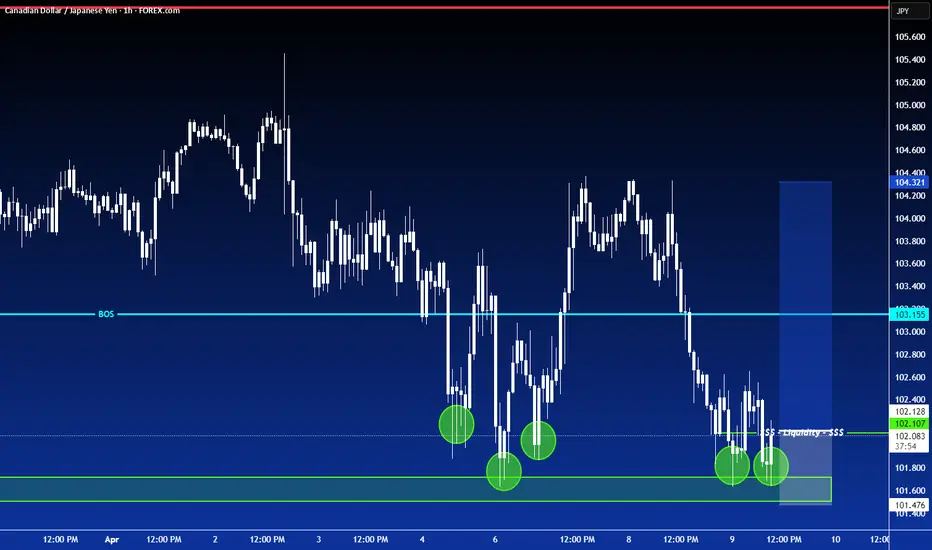
LONG ON CAD/JPYCAD/JPY is respecting a major demand area/zone
It has given a inverse head and shoulders in the recent pass, and now a double bottom at the same zone.
I will be buying this pair as a market order aiming for the next level of resistance/liquidity.
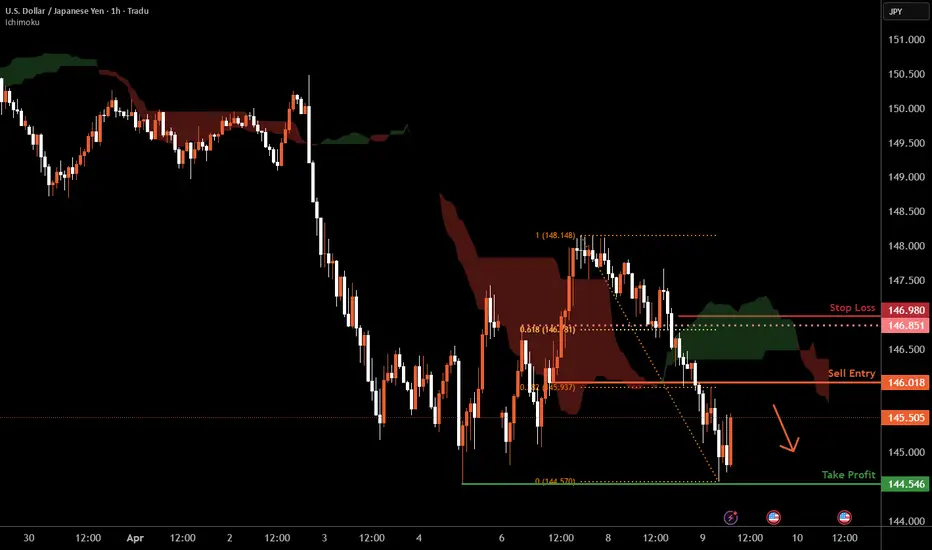
USD/JPY H1 | Pullback resistance at 38.2% Fibonacci retracementUSD/JPY is rising towards a pullback resistance and could potentially reverse off this level to drop lower.
Sell entry is at 146.018 which is a pullback resistance that aligns with the 38.2% Fibonacci retracement.
Stop loss is at 146.98 which is a level that sits above the 61.8% Fibonacci retracement and an overlap resistance.
Take profit is at 144.54 which is a multi-swing-low support.
High Risk Investment Warning
Trading Forex/CFDs on margin carries a high level of risk and may not be suitable for all investors. Leverage can work against you.
Stratos Markets Limited (tradu.com):
CFDs are complex instruments and come with a high risk of losing money rapidly due to leverage. 63% of retail investor accounts lose money when trading CFDs with this provider. You should consider whether you understand how CFDs work and whether you can afford to take the high risk of losing your money.
Stratos Europe Ltd (tradu.com):
CFDs are complex instruments and come with a high risk of losing money rapidly due to leverage. 63% of retail investor accounts lose money when trading CFDs with this provider. You should consider whether you understand how CFDs work and whether you can afford to take the high risk of losing your money.
Stratos Global LLC (tradu.com):
Losses can exceed deposits.
Please be advised that the information presented on TradingView is provided to Tradu (‘Company’, ‘we’) by a third-party provider (‘TFA Global Pte Ltd’). Please be reminded that you are solely responsible for the trading decisions on your account. There is a very high degree of risk involved in trading. Any information and/or content is intended entirely for research, educational and informational purposes only and does not constitute investment or consultation advice or investment strategy. The information is not tailored to the investment needs of any specific person and therefore does not involve a consideration of any of the investment objectives, financial situation or needs of any viewer that may receive it. Kindly also note that past performance is not a reliable indicator of future results. Actual results may differ materially from those anticipated in forward-looking or past performance statements. We assume no liability as to the accuracy or completeness of any of the information and/or content provided herein and the Company cannot be held responsible for any omission, mistake nor for any loss or damage including without limitation to any loss of profit which may arise from reliance on any information supplied by TFA Global Pte Ltd.
The speaker(s) is neither an employee, agent nor representative of Tradu and is therefore acting independently. The opinions given are their own, constitute general market commentary, and do not constitute the opinion or advice of Tradu or any form of personal or investment advice. Tradu neither endorses nor guarantees offerings of third-party speakers, nor is Tradu responsible for the content, veracity or opinions of third-party speakers, presenters or participants.
USD/JPY M30 | Falling to overlap supportUSD/JPY is falling towards an overlap support and could potentially bounce off this level to climb higher.
Buy entry is at 146.62 which is an overlap support that aligns with the 38.2% Fibonacci retracement.
Stop loss is at 145.71 which is a level that lies underneath a swing-low support and the 61.8% Fibonacci retracement.
Take profit is at 148.09 which is a multi-swing-high resistance that aligns with the 61.8% Fibonacci retracement.
High Risk Investment Warning
Trading Forex/CFDs on margin carries a high level of risk and may not be suitable for all investors. Leverage can work against you.
Stratos Markets Limited (www.fxcm.com):
CFDs are complex instruments and come with a high risk of losing money rapidly due to leverage. 63% of retail investor accounts lose money when trading CFDs with this provider. You should consider whether you understand how CFDs work and whether you can afford to take the high risk of losing your money.
Stratos Europe Ltd (www.fxcm.com):
CFDs are complex instruments and come with a high risk of losing money rapidly due to leverage. 63% of retail investor accounts lose money when trading CFDs with this provider. You should consider whether you understand how CFDs work and whether you can afford to take the high risk of losing your money.
Stratos Trading Pty. Limited (www.fxcm.com):
Trading FX/CFDs carries significant risks. FXCM AU (AFSL 309763), please read the Financial Services Guide, Product Disclosure Statement, Target Market Determination and Terms of Business at www.fxcm.com
Stratos Global LLC (www.fxcm.com):
Losses can exceed deposits.
Please be advised that the information presented on TradingView is provided to FXCM (‘Company’, ‘we’) by a third-party provider (‘TFA Global Pte Ltd’). Please be reminded that you are solely responsible for the trading decisions on your account. There is a very high degree of risk involved in trading. Any information and/or content is intended entirely for research, educational and informational purposes only and does not constitute investment or consultation advice or investment strategy. The information is not tailored to the investment needs of any specific person and therefore does not involve a consideration of any of the investment objectives, financial situation or needs of any viewer that may receive it. Kindly also note that past performance is not a reliable indicator of future results. Actual results may differ materially from those anticipated in forward-looking or past performance statements. We assume no liability as to the accuracy or completeness of any of the information and/or content provided herein and the Company cannot be held responsible for any omission, mistake nor for any loss or damage including without limitation to any loss of profit which may arise from reliance on any information supplied by TFA Global Pte Ltd.
The speaker(s) is neither an employee, agent nor representative of FXCM and is therefore acting independently. The opinions given are their own, constitute general market commentary, and do not constitute the opinion or advice of FXCM or any form of personal or investment advice. FXCM neither endorses nor guarantees offerings of third-party speakers, nor is FXCM responsible for the content, veracity or opinions of third-party speakers, presenters or participants.
