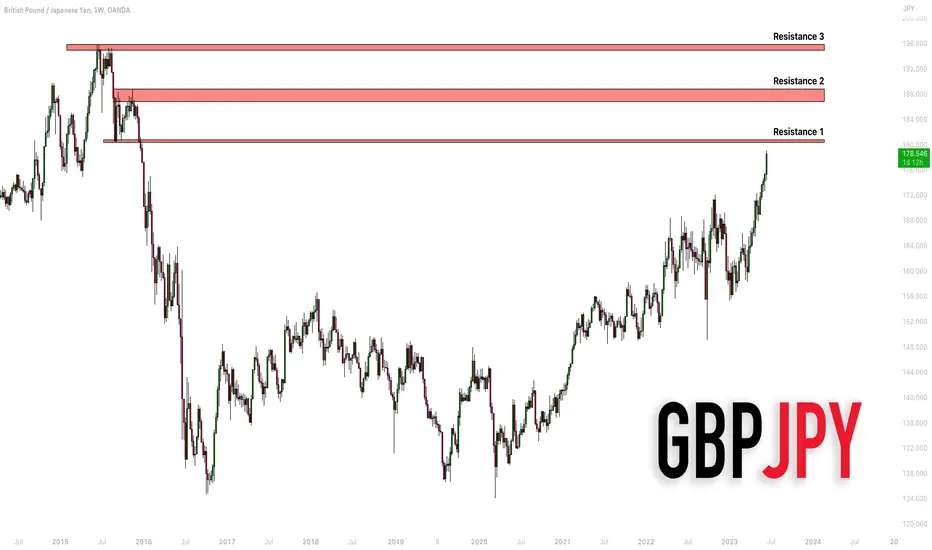
GBPJPY: The Historical Structures 🇬🇧🇯🇵
GBPJPY is unstoppable.
The market keeps growing like crazy.
Here are the next historical structures on focus:
Resistance 1: 180.35 - 180.75 area
Resistance 2: 186.80 - 188.80 area
Resistance 3: 194.94 - 195.83 area
I believe that the next goal for buyers is Resistance 1.
The market will most likely keep growing.
❤️Please, support my work with like, thank you!❤️
Yen
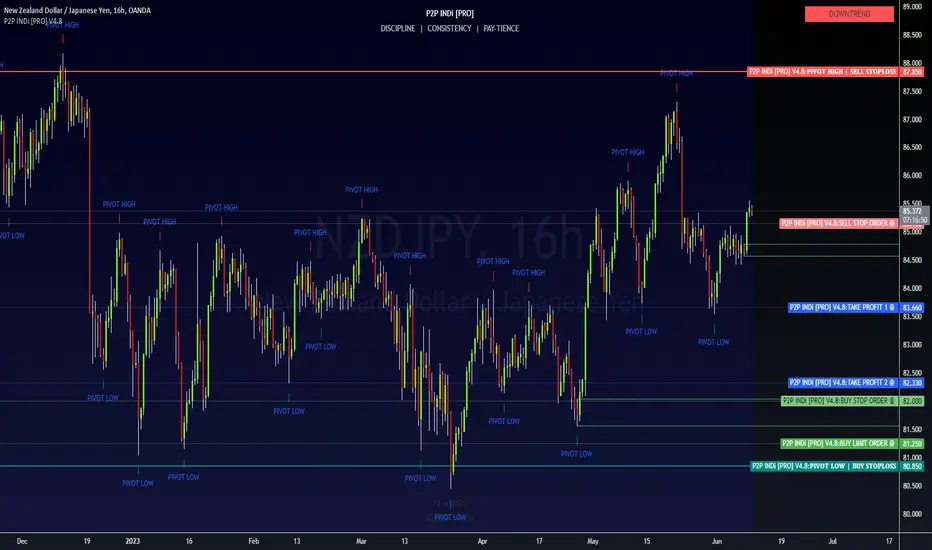
🔥 MODIFICATION: NZDJPY 🔥 SWING TRADE 🔥Our technical analysis of NZDJPY is still in play. The pair has been in a downtrend for the past few months and has recently reached a Supply Zone (SZ) at 86.60 on the 15-hour chart. This SZ suggests that there is strong selling pressure at this level, and it is likely that the pair will continue to decline. The next resistance level is at 86.80, and if this level is respected, then we have a huge opportunity to capitalize on this downside pressure.
Resistance @ 86.80
Supply Zone @ 86.60
SSO2 @ 86.15 📉
SSO1 @ 85.15 📉
TP1 @ 84.35 (shaving 25%)
TP2 @ 83.66 (shaving 50%)
TP3 @ 82.33 (closing ALL Sell Orders)
BLO1 @ 82.00
BLO2 @ 81.25
-SL @ 80.85 🚫

🔥 ADD-ON: NZDJPY 🔥 SWING TRADE 🔥SSO2 @ 86.15 📉
SSO1 @ 85.15 📉
TP1 @ 84.35 (shaving 25%)
TP2 @ 83.66 (shaving 50%)
TP3 @ 82.33 (closing ALL Sell Orders)
BLO1 @ 82.00
BLO2 @ 81.25
-SL @ 80.85 🚫

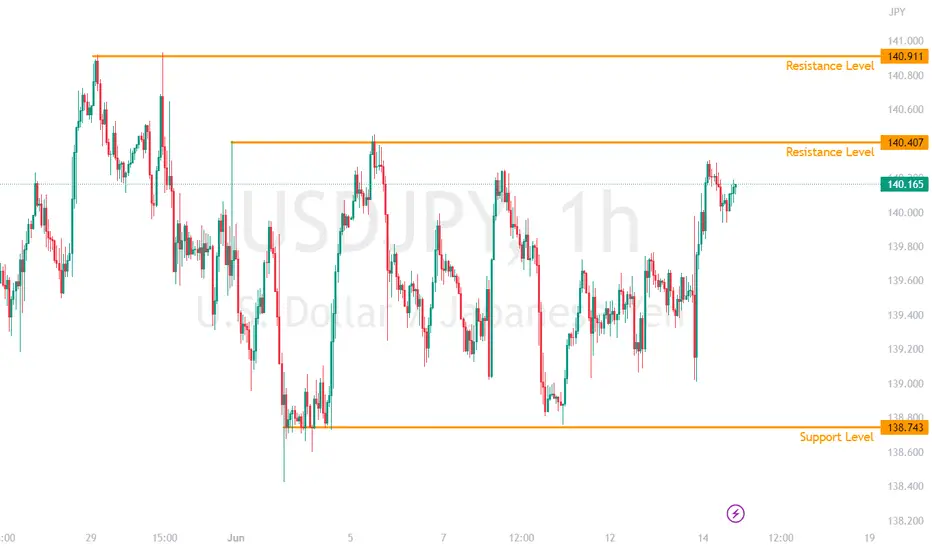
USDJPY FOMC Prep 14th JuneIf the FOMC does pause on further rate hikes as forecasted, this is likely to cause further weakness in the DXY (read DXY analysis)
Weakness in the DXY could see the USDJPY trade lower. The USDJPY has been range bound since the start of June, trading between the resistance of 140.40 and support of 138.74.
Currently trading along the 140 price level, weakness in the DXY could see the price reverse lower, back down to the support level. Similar to the price action on the 5th of June.
A surprise rate hike from the FOMC could see the USDJPY rise, but the upside would be limited with the next key resistance level around 141 (the previous swing high at the end of May) and also with the increasing belief that any surprise rate hike would be the last to come from the FOMC.
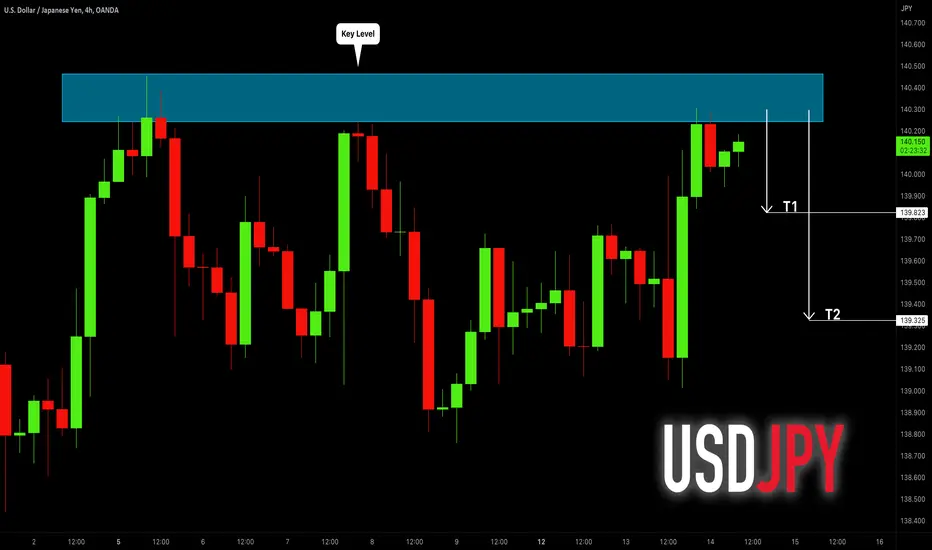
USDJPY: Pullback From Important Resistance 🇺🇸🇯🇵
USDJPY is approaching a wide horizontal supply area on 4H time frame.
I believe that the price may retrace from that.
Goals: 139.82 / 139.32
❤️Please, support my work with like, thank you!❤️
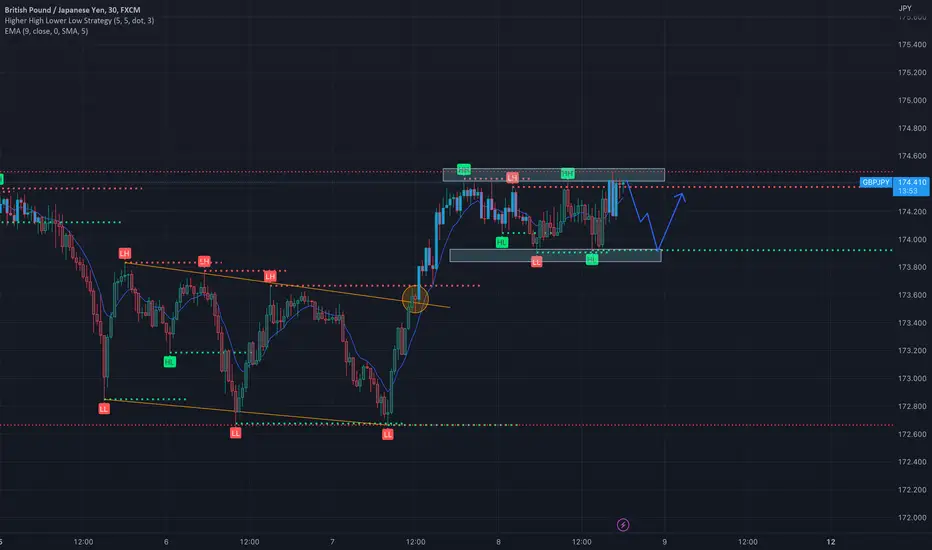
GBPJPY Consolidation?Sideways movement on GJ, Looking for sells when i see a clear break out of range.
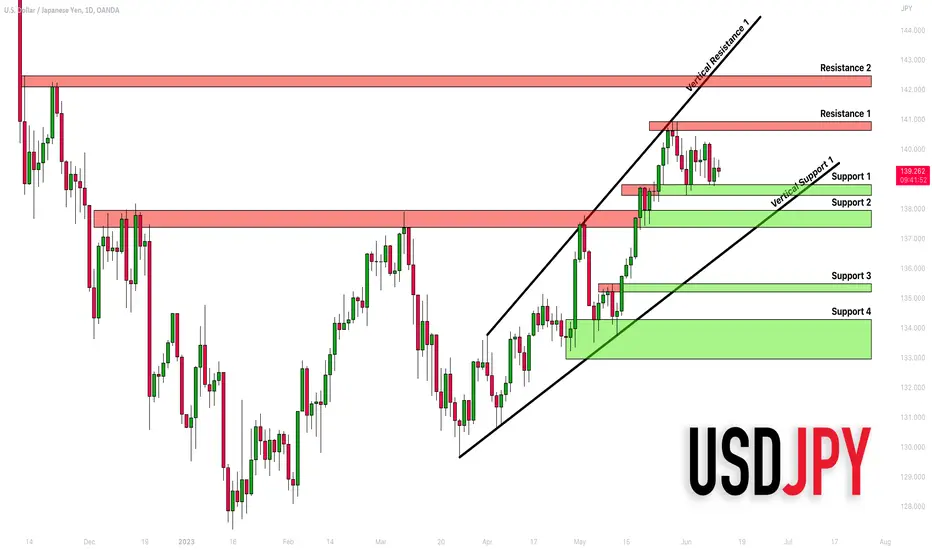
USDJPY: Key Levels to Watch This Week 🇺🇸🇯🇵
Here is my detailed structure analysis for USDJPY.
Horizontal Key Levels.
Resistance 1: 140.63 - 140.93 area
Resistance 2: 142.06 - 142.46 area
Support 1: 138.48 - 138.80 area
Support 2: 137.38 - 137.95 area
Support 3: 135.20 - 135.49 area
Support 4: 132.95 - 134.27 area
Vertical Key Levels.
Vertical Resistance 1: Rising trend line
Vertical Support 1: Rising trend line
Consider these structures for pullback/breakout trading this week.
❤️Please, support my work with like, thank you!❤️
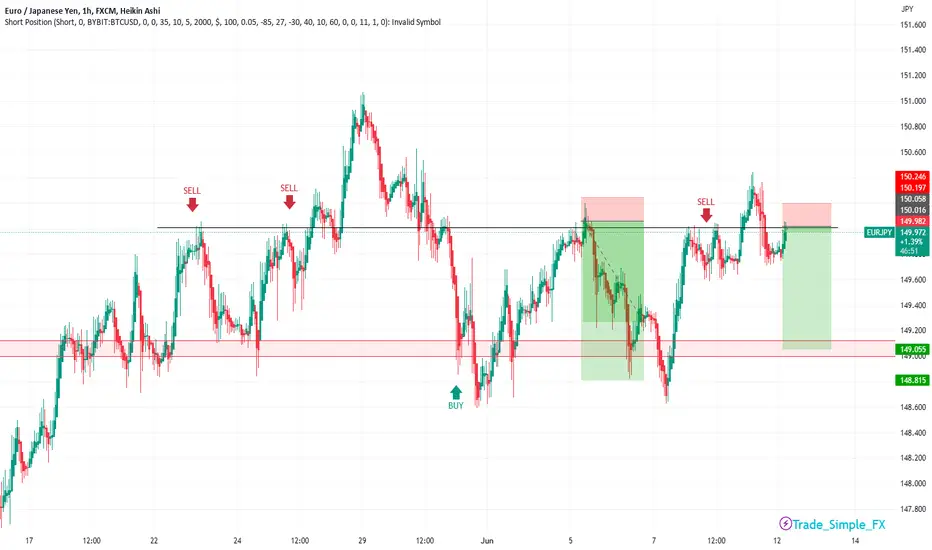
EURJPY H1 - Short SignalEURJPY H1
Excuse the Heikin Ashi candles, my usual candles aren't seeming to want to load up for some odd reason. Anyway, we still have this 150.000 psychological number in tact, whilst the likes of GBPJPY looks to want to climb higher... The EURJPY seems to be at a bit of a halt here at 150.000. With the exceptions of a few fake-outs upside.
🔥 NEW: NZDJPY 🔥 SWING TRADE 🔥SSO @ 85.15 ⏳
TP1 @ 83.66 (shaving 50%)
TP2 @ 82.33 (closing ALL Buy Orders)
BLO1 @ 82.00 ⏳
BLO2 @ 81.25 ⏳
⚠️ This is a Counter-Trend Trade (CTT). Your position size should be 2% or less, with a Stop Loss at 2% or less — or whatever fits your trading strategy.
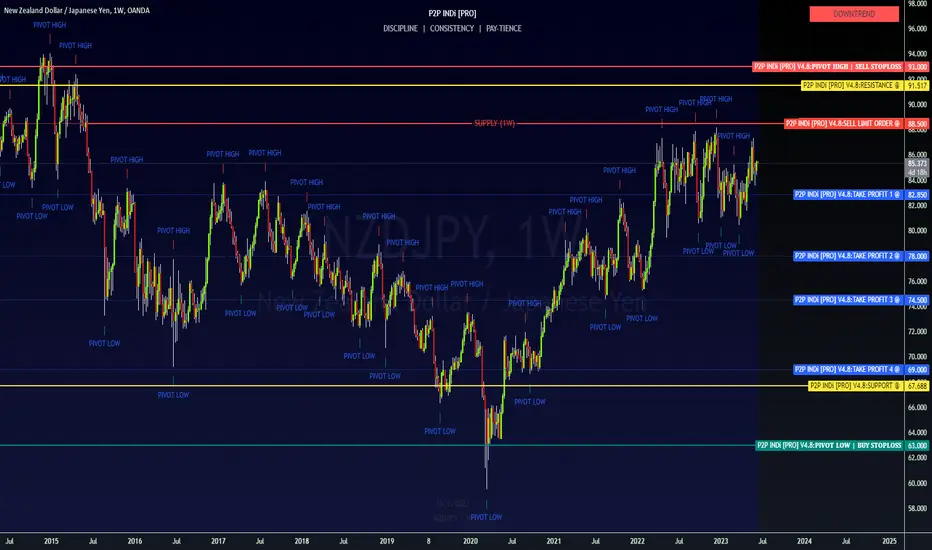
✨ NEW: NZDJPY ✨ POSITION TRADE ✨SLO @ 88.50
TP1 @ 82.85 (shaving 25%)
TP2 @ 78.00 (shaving 25%)
TP3 @ 74.50 (shaving 25%)
TP4 @ 69.00 (closing ALL Sell Orders)
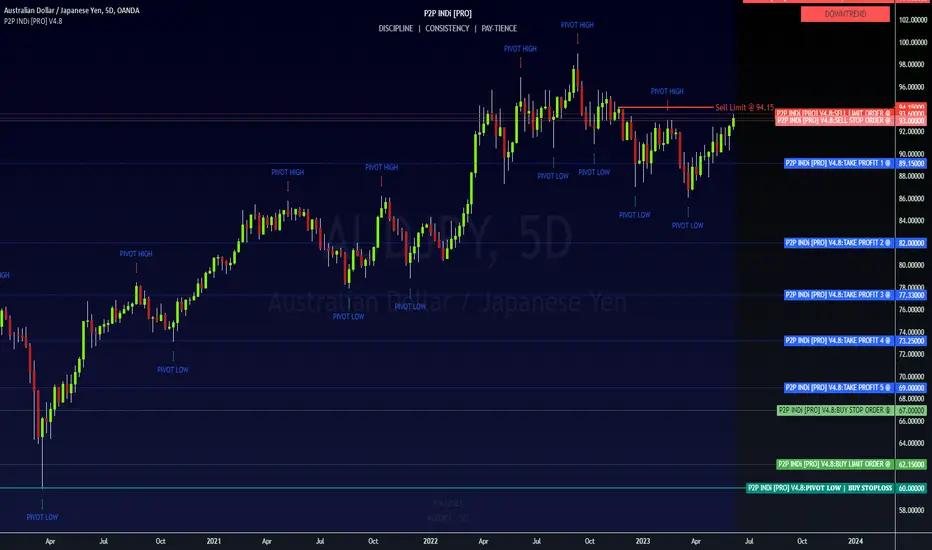
✨ NEW: AUDJPY ✨ SWING TRADE ✨SLO2 @ 94.15 ⏳
SLO1 @ 93.60 ⏳
SSO @ 93.00 ⏳
TP1 @ 89.15 (shaving 25%)
TP2 @ 82.00 (shaving 25%)
TP3 @ 77.33 (shaving 25%)
TP4 @ 73.25 (shaving 25%)
TP5 @ 69.00 (closing ALL Buy Orders)
BLO1 @ 67.00 ⏳
BLO2 @ 62.15 ⏳
USD JPY - FUNDAMENTAL ANALYSIS2023-2024 Exchange Rate Forecasts From MUFG
Japanese Yen: Long-Term Pressure for Yen Gains
As far as the yen is concerned, the Bank of Japan has continued to resist policy tightening, but MUFG suspects that the position could change very quickly.
It notes; “We suspect the BoJ could pivot quickly and alter YCC without much warning.”
The bank also expects that the underlying inflation profile has increased which could have important implications for the central bank and yen.
It adds; “The sense that this time could be different is certainly building in Japan.”
An eventual policy shift is expected to boost the heavily-undervalued yen.

GBPJPY I It will keep growing Welcome back! Let me know your thoughts in the comments!
** GBPJPY Analysis - Listen to video!
We recommend that you keep this pair on your watchlist and enter when the entry criteria of your strategy is met.
Please support this idea with a LIKE and COMMENT if you find it useful and Click "Follow" on our profile if you'd like these trade ideas delivered straight to your email in the future.
Thanks for your continued support!

USDJPY approaches key decisive area The USDJPY has been trading strongly to the upside since early May with no significant corrective move to the downside.
Now, with the 50MA again crossing below the 200MA and price action showing bearish momentum, look for the USDJPY to break below the 138.75 support level formed last Friday.
Along with a downward movement on the RSI, if the USDJPY breaks below 138.75, the price could fall toward the next support level of 137.50.
Although there is another key support level at 135.55, this might be too low as a possible target level.

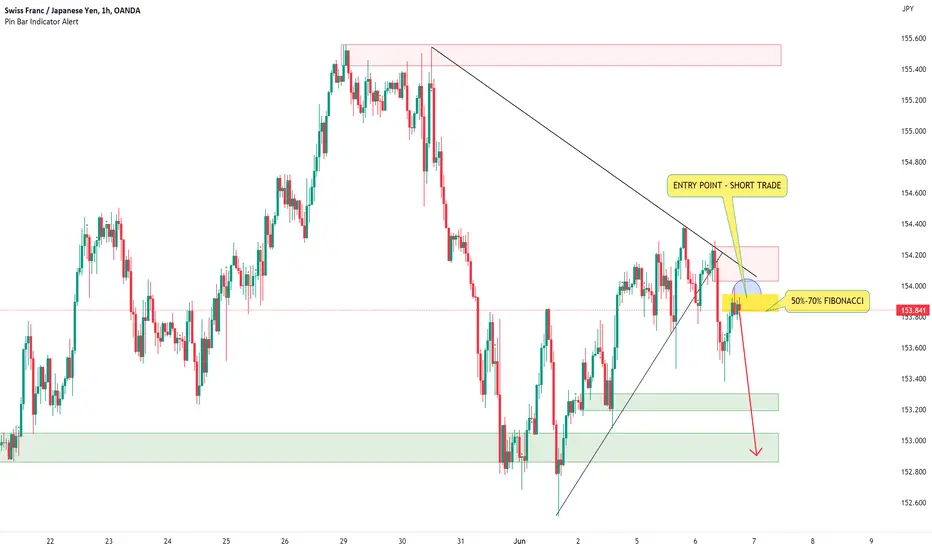
CHFJPY SHORT TRADE SIGNALOn CHFJPY, we have a bearish setup where the price has broken a descending triangle and rebounded three times on a downward trendline. Currently, the price is at 153.80, which is between the 50% and 70% Fibonacci levels, making it a premium zone to enter a short trade with a target at 153, where we have a very strong demand zone.
Let me know your thoughts on this.
Happy trading to everyone.
EURJPY: Potential Swing Trade Explained 🇪🇺🇯🇵
Price action analysis on EURJPY.
Key levels.
Swing short explained.
Trading recommendations.
Potential scenarios.
❤️Please, support my work with like, thank you!❤️

EURJPY H4 - Short SetupEURJPY H4
Trading on and around that huge 150.000 psychological number at the moment. Price hopefully looking to reject this area on the LTF to give us a signal that bears may come back into play. The likes of GBPJPY also looking attractive for possible shorts, but not a huge amount of volume being seen over the last couple of weeks. But this week could be the week we start to see the JPY gain strength in line with recent consolidation and exhaustion.

USD JPY - FUNDAMENTAL ANALYSISThe Bank of Japan's (BoJ) monetary stance remained unchanged as they didn't convene, keeping the key policy rate at -0.10% and the 10-year yield at around zero percent due to Yield Curve Control.
Several factors contributed to the Yen's weakening, including reassessments of the Federal Reserve's monetary tightening outlook, which generally boosted the dollar.
The 10-year breakeven rose significantly, hinting at rising inflation expectations in Japan. With inflation hitting new highs and property values also increasing, real yields in Japan are falling.
Despite rising inflation, the BoJ's apparent lack of urgency to change its current monetary stance has also influenced the Yen's movement.
However, there are suggestions that the BoJ might change its Yield Curve Control without much warning.
With possible political factors also in play, the overall view, according to analysts at MUFG, is of limited scope for further rise in the USD/JPY exchange rate, given the Fed's projected pause in June.
Japanese Yen Performance in May
The Yen's performance against other major currencies in May has been mixed, the Japanese currency saw a depreciation against the US dollar but a strengthening against the Euro.
"In May the yen weakened further versus the US dollar in terms of London closing rates from 136.09 to 139.68" says Derek Halpenny, Head of Research, Global Markets EMEA and International Securities at MUFG.
Bank of Japan's Monetary Stance
Despite the fluctuations, there hasn't been a change in the monetary policy of the Bank of Japan (BoJ). The central bank's current stance remained steady with a key policy rate of -0.10% and the ten-year yield managed within a +/- 50bps range due to Yield Curve Control (YCC).
"The BoJ did not meet in May and hence its current monetary stance was unchanged with the key policy rate at -0.10% and YCC restraining the 10-year yield within a range of +/-50bps around zero percent," says Halpenny.
Factors Influencing the JPY's Exchange Rate Performance
Several macroeconomic dynamics influenced the Yen's performance in May. A crucial contributor to these dynamics was a reappraisal of the Federal Reserve's perspective on monetary policy tightening in the US, which resulted in a strengthening of the US dollar.
"Firstly, the reassessment of the outlook for monetary tightening by the Fed helped lift the dollar in general in May and that helped propel USD/JPY higher," Halpenny states. He adds, "From close to a zero probability, OIS pricing now indicates around a 50% probability of another rate hike by the Fed."
Furthermore, the Yen's value was impacted by domestic economic indicators. There's been a significant increase in real yields (the returns on investments that have been adjusted for the effects of inflation) in Japan, accompanied by a surge in inflation expectations.
"Real yields have been falling sharply in Japan with inflation expectations jumping. The 10yr breakeven jumped 20bps in May and reached close to 1.00%, the highest since June 2022," Halpenny notes.
Impact of Asset Price Inflation
The rising inflation in Japan wasn't just limited to goods and services, but also included a surge in asset prices. A broad spectrum of assets, including the Topix Index, property prices, and land prices, experienced significant gains.
The TOPIX, or Tokyo Stock Price Index, is a broad stock market index that tracks all domestic companies listed on the First Section of the Tokyo Stock Exchange (TSE), the largest stock market in Japan. It includes a wide range of company sizes and sectors, making it a comprehensive barometer of the overall Japanese equity market.
"The Topix Index surged 3.6% in May in contrast to a 0.2% gain in the S&P 500. Property prices and land prices are also moving higher in Japan," says Halpenny.
Despite the rising inflation and falling real yields, the BoJ appears untroubled about the situation and is in no hurry to change its monetary policy.
"Adding to yen selling is the clear sense of a lack of urgency from Governor Ueda to change the current monetary stance," says Halpenny.
However, there are signs that the BoJ might spring a surprise and make quick alterations to its YCC policy. "We suspect the BoJ could pivot quickly and alter YCC without much warning," Halpenny states.
In the backdrop of all these factors, the outlook for the Yen seems nuanced. The combination of increasing inflation, changing monetary policy stances, and political factors all paint a picture of restrained potential for further appreciation of the Yen against the US Dollar, especially with a projected pause in the Federal Reserve's policy actions in June.
"With the Fed set to pause in June, we see limited scope for USD/JPY to move higher from here," Halpenny concludes.

USDJPY: Classic Bullish Pattern Explained 🇺🇸🇯🇵
USDJPY set a new higher high higher close this week.
A correctional movement initiated then.
The market was steadily falling within a bullish flag pattern on 4H.
After NFP release, the price bounced and a resistance of the flag was broken.
It makes me think that the market will keep growing next week.
First goal - 1407
❤️Please, support my work with like, thank you!❤️

USD JPY - FUNDAMENTAL ANALYSISUSD/JPY has reversed from a high near 141, largely on the back of shrinking expectations that the Fed would hike in June. That is now priced with a 25% probability rather than a 70% probability attached to it last month. We have noted that the current environment should continue to see interest in carry trade strategies – where the Japanese yen scores poorly. However, USD/JPY looks overvalued relative to the terms of trade story – which is much better for the yen than a year ago.
In addition, there is still the risk that the Bank of Japan surprises on 16 June by further normalising its Yield Curve Control policy. That would be a yen positive. And thus it would not be a surprise to see speculator investors trying to re-position short USD/JPY above 140 – even if such a strategy has already proved painful this year.

CHFJPY short - nowOn the following graph, we see a downward trend at the beginning of the year, and a rising downward trendline was broken through a week later. Now the market is testing this trendline from above and there is a high probability that there will be a rebound and a change in the trend in an uptrend.
.
chfjpy will continue to decline
.
Thank you and Good Luck!

✨NEW: USDJPY ✨ SWING TRADE ✨SLO @ 144.05 ⏳
SSO @ 138.33 ⏳
TP1 @ 134.00 (shaving 25%)
TP2 @ 125.50 (shaving 25%)
TP3 @ 119.25 (shaving 25%)
TP4 @ 110.75 (shaving 25%)
TP5 @ 103.85 (shaving 25%)
BSO @ 101.66 ⏳
BLO @ 99.66 ⏳
ADDITIONAL INFO:
TP1 @ 134.00, before Pivot Low
TP2 @ 125.50, at Mid-Pivot
TP3 @ 119.25, at Major Support
TP4 @ 110.75, above Upper Demand
TP5 @ 103.85, above Lower Demand
BSO @ 101.66, after Price Action drops below
TECHNICAL ANALYSIS:
As of June 1, 2023, the USDJPY is trading around 139.80.
The RSI is overbought, which indicates that the market is due for a correction. The MACD is also starting to turn down, which could be another sign that the trend is about to change.
⚠️Be mindful that the moving averages are all sloping upwards, which is a bullish sign.
Overall, the technical analysis for the USDJPY is mixed. There are some bullish signs, however the bearish signs seem to be forging ahead. Traders should be cautious and wait for a clear downtrend to emerge before taking any short trades.
Here are some of the key levels to watch for:
* SUPPORT: 139.45
⚠️ For a more aggressive approach, you can place a Market Order to Sell once price opens and closes below Support
* RESISTANCE: 140.65
⚠️ For a more aggressive approach, you can place a Market Order to Buy once price opens and closes above Resistance
If the price breaks below the support level, it could signal a change in trend to the downside. If the price breaks above the resistance level, it could signal a continuation of the bullish trend.
Here are some of the factors that could affect the USDJPY in the near future:
* The US Federal Reserve's interest rate decision on June 15.
* The Japanese government's economic data releases.
Traders should keep an eye on these factors and adjust their positions accordingly.

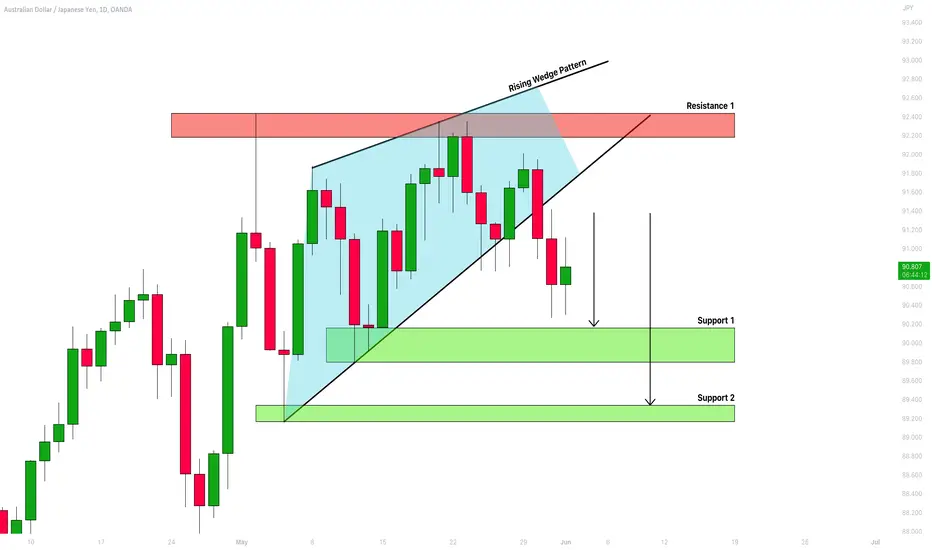
AUDJPY: Classic Bearish Reversal 🇦🇺🇯🇵
On a today's live stream, we discussed AUDJPY.
The price was steadily growing within a rising wedge pattern.
Once a key daily resistance was reached, bears managed to violate the lower boundary of the wedge.
It looks like a bearish reversal is ahead.
The market may drop to 90.15 / 89.35
❤️Please, support my work with like, thank you!❤️