YFI/USDT — Multi-Year Demand Zone: Rebound or Breakdown?🔎 Full Analysis
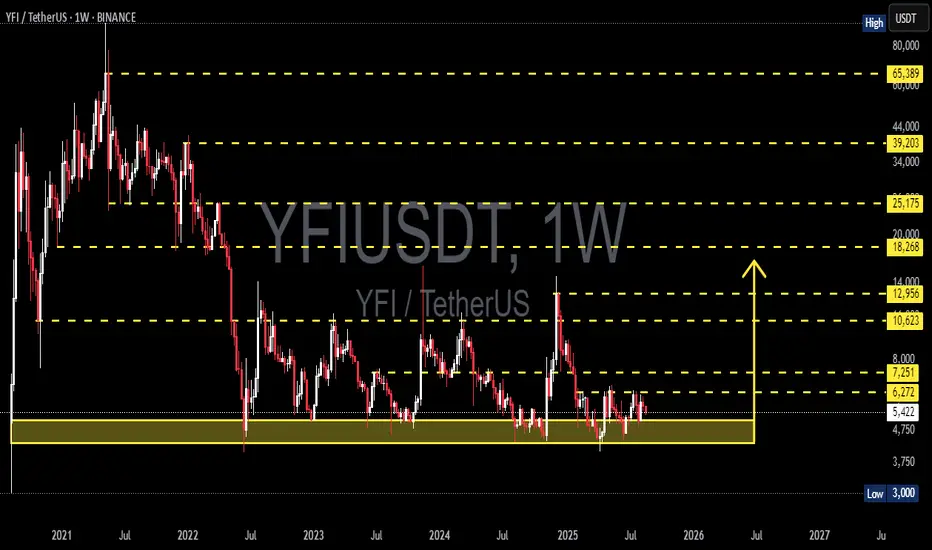
On the weekly timeframe, YFI/USDT is trading right above a multi-year demand zone around $3,800 – $4,750 (yellow box). This area has repeatedly acted as a strong support since 2022, where buyers step in to prevent deeper declines.
After a sharp drop from its 2021 peak, price action has formed a long-term base/accumulation structure, suggesting that while selling pressure has slowed down, there’s still no strong bullish momentum to drive a sustainable uptrend.
Looking upward, we can identify historical resistance levels as key barriers and potential targets if price breaks higher:
$6,272 → short-term resistance
$7,251 → major resistance (bullish confirmation if broken)
$10,623 → $12,956 → $18,268 → $25,175 → mid-to-long term targets
$65,389 → ultimate historical high, only realistic in a strong macro bull cycle
---
🐂 Bullish Scenario
1. Rebound from demand → As long as weekly closes remain above $4,750, buyers can attempt to defend this zone.
2. First breakout trigger → A weekly close above $6,272 opens the door toward $7,251.
3. Momentum continuation → Breaking $7,251 with volume may confirm a shift back into a bullish cycle, targeting $10,623 – $12,956 – $18,268.
💡 Strategy: Swing traders may accumulate within the demand zone with tight stops below $3,800. Conservative traders may wait for a breakout above $6,272/$7,251 before entering.
---
🐻 Bearish Scenario
1. Breakdown of demand zone → A weekly close below $3,800 – $4,750 would invalidate multi-year support.
2. Downside targets → The next major support sits near $3,000, with further downside possible if selling accelerates.
3. False breakout risk → A rally toward $7k–$10k followed by a sharp rejection could send price back into the demand zone, increasing the chance of a breakdown.
💡 Strategy: If breakdown occurs, short setups or waiting for entries at lower supports may provide better risk/reward.
---
📐 Pattern Structure
Accumulation Base / Long-Term Range → price consolidating for multiple years above a key demand zone.
Range-Bound Market → current trading range remains between $3,800 – $7,251.
Decision Point → the longer the consolidation, the more powerful the breakout will likely be.
---
🔑 Key Takeaways
YFI is at a critical decision point: hold above demand or break down to new lows.
Bullish Case: breakout above $6,272 → confirmation at $7,251 → potential rally to $10k – $12k+.
Bearish Case: breakdown below $3,800 – $4,750 → likely move to $3,000 or lower.
The yellow zone = the battleground that will define YFI’s multi-month trend.
---
📝 Important Note
This analysis is based on price action & historical levels. Always combine with indicators (RSI, MACD, volume) and keep an eye on market sentiment (BTC dominance, macro conditions).
This is not financial advice — do your own research before making trading decisions.
#YFI #YFIUSDT #YearnFinance #Crypto #TechnicalAnalysis #SupportResistance #PriceAction #SwingTrading #Altcoin
YFIUSDC
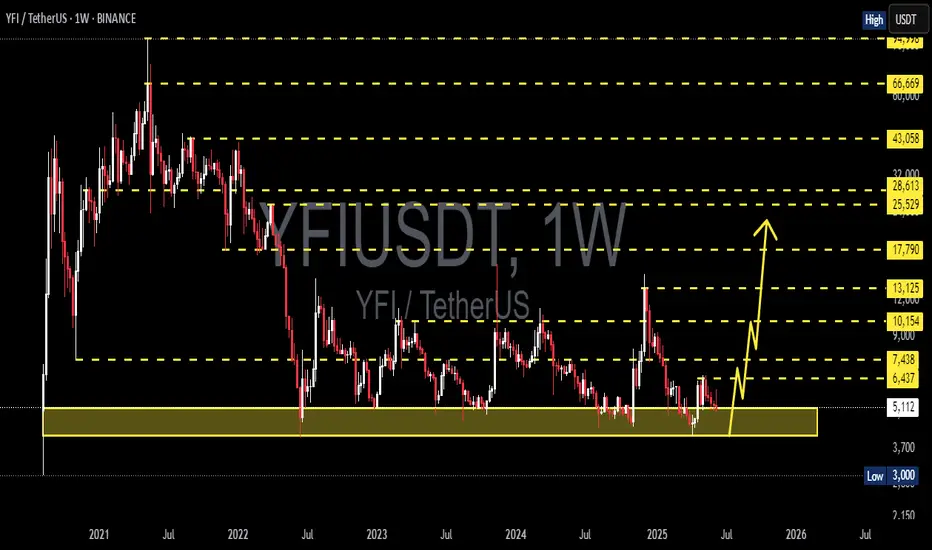
YFIUSDT 1W AnalysisYFI ~ 1W Analysis
#YFI This is the lowest support block for now. Buy gradually from here with a short term target of at least 20%+ from this support.
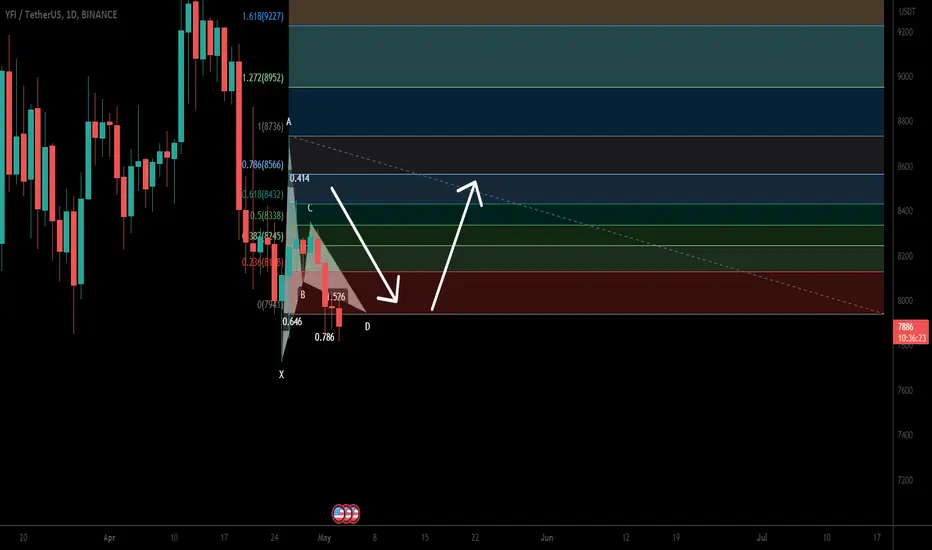
yearn.finance (YFI) formed bullish Gartley for upto 10.50% pumpHi dear friends, hope you are well and welcome to the new trade setup of yearn.finance (YFI) with US Dollar pair.
Previosly we caught almost 20% pump of YFI as below:
Now on a daily time frame, YFI has formed a bullish Gartley move for the next price reversal.
Note: Above idea is for educational purpose only. It is advised to diversify and strictly follow the stop loss, and don't get stuck with trade
YFIUSDT- Trend Breakout!YFIUSDT (4h Chart) Technical analysis
YFIUSDT (4h Chart) Currently trading at $33695
Buy level: Above $33483
Stop loss: Below $30811
Target 1: $35390
Target 2: $37125
Target 3: $39200
Target 4: $41700
Max Leverage 3x
Always keep Stop loss
Follow Our Tradingview Account for More Technical Analysis Updates, | Like, Share and Comment Your thoughts.

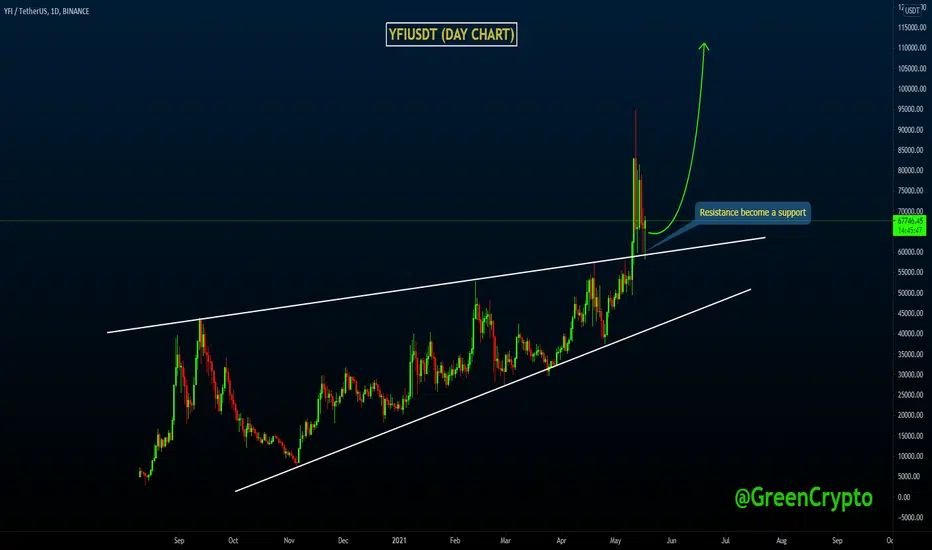
YFIUSDT $1,00,000 Soon!YFIUSDTUSDT(Day CHART) Technical Analysis Update
Resistance becomes support
YFI/USDT currently trading at $67,000
Buy-level: $62,000 - $67,000
Stop loss: Below $52,000
Target 1: $75,000
Target 2: $81,000
Target 3: $90,000
Target 4: $1,00,000
Max Leverage: 2X
ALWAYS KEEP STOP LOSS...
Follow Our Tradingview Account for More Technical Analysis Updates, | Like, Share and Comment Your thoughts.
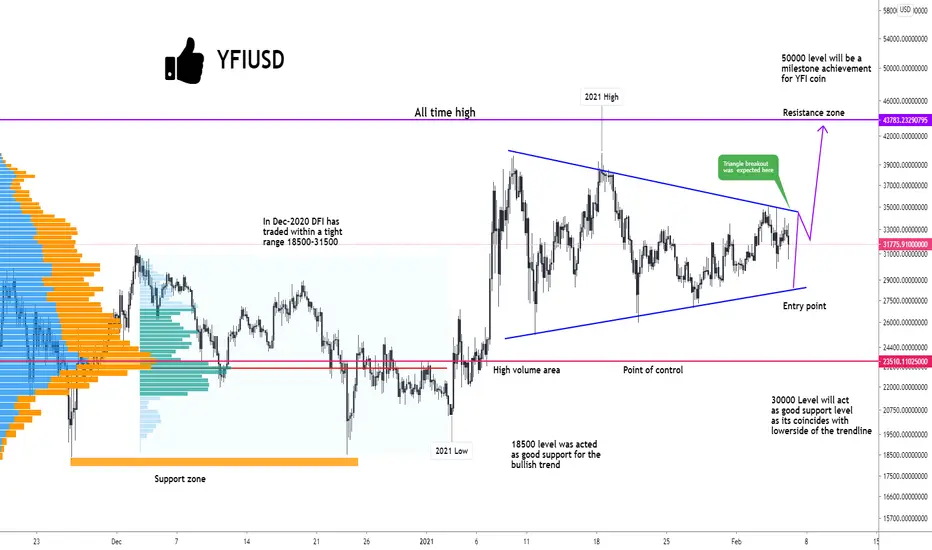
YFI triangle breakout was expected will it reach 50000.00 ?YFIUSD
YFI is an Etherium token that governs the yearn finance platform. And the current market cap was around 84 Million in Indian value. The price of the YFI
will mostly correlate with Etherium classic,cardano and steller lumens.
We have identified triangle pattern in YFI as the weekend traders will try to push the price lower towards lower side of the trend line where we can buy this coin
this will give us a high risk reward ratio and the potential upside target would be 43700 which is current all time high.2021 high was 40000.00 and 50000.00 will
act as strong topside resistance for the bull yfiusd
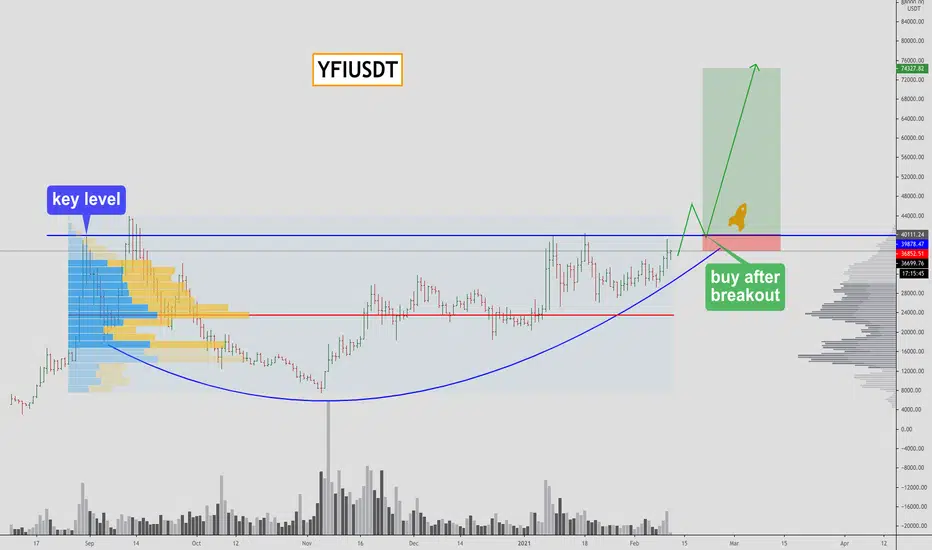
YFIUSDT - Who invested?preconditions:
-global uptrend
-locally uptrend
-accumulation
-key level
-limit player
Push like if you think this is a useful idea!
Thanks for your support!
YFIUSDT a MUST on your ALTS portfolio 100K objective 6 month maxI love this proyect top 10 coin for me.
