YFI/USDT — Multi-Year Demand Zone: Rebound or Breakdown?🔎 Full Analysis
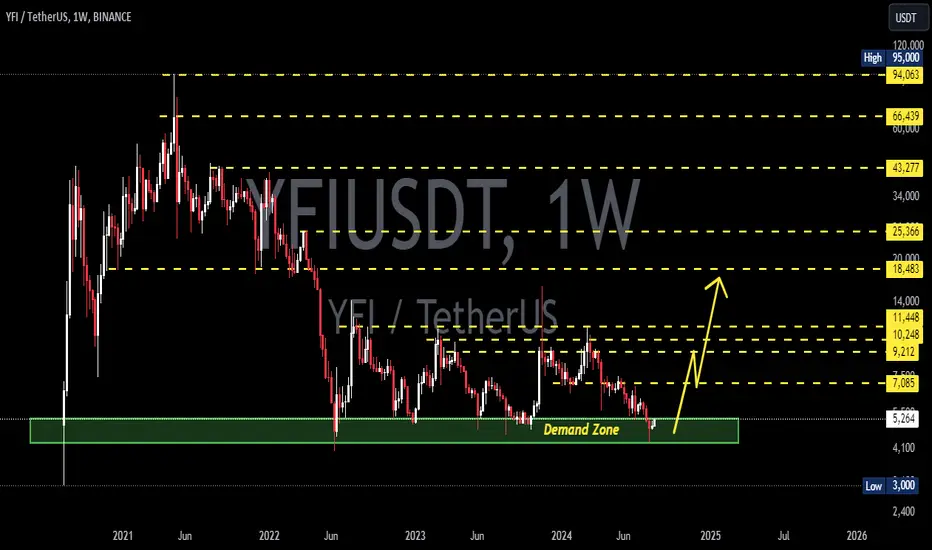
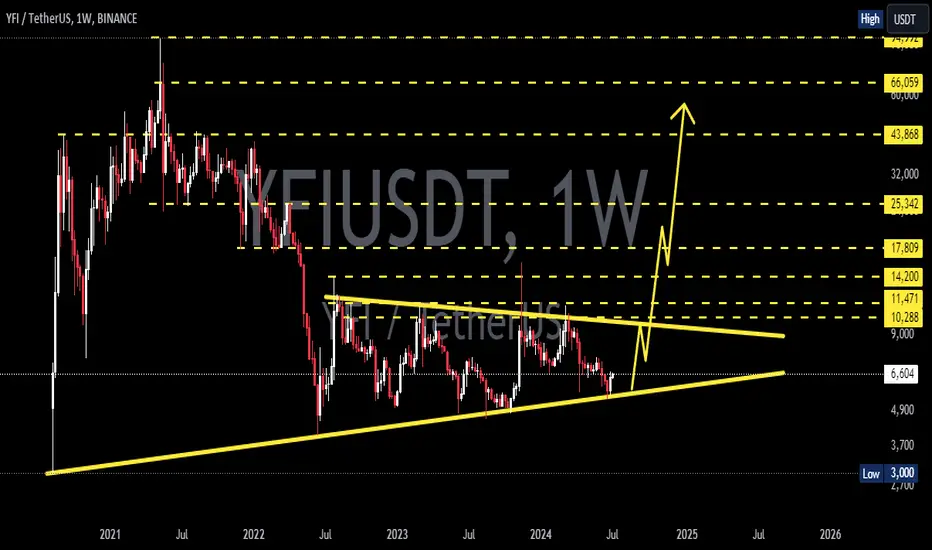
On the weekly timeframe, YFI/USDT is trading right above a multi-year demand zone around $3,800 – $4,750 (yellow box). This area has repeatedly acted as a strong support since 2022, where buyers step in to prevent deeper declines.
After a sharp drop from its 2021 peak, price action has formed a long-term base/accumulation structure, suggesting that while selling pressure has slowed down, there’s still no strong bullish momentum to drive a sustainable uptrend.
Looking upward, we can identify historical resistance levels as key barriers and potential targets if price breaks higher:
$6,272 → short-term resistance
$7,251 → major resistance (bullish confirmation if broken)
$10,623 → $12,956 → $18,268 → $25,175 → mid-to-long term targets
$65,389 → ultimate historical high, only realistic in a strong macro bull cycle
---
🐂 Bullish Scenario
1. Rebound from demand → As long as weekly closes remain above $4,750, buyers can attempt to defend this zone.
2. First breakout trigger → A weekly close above $6,272 opens the door toward $7,251.
3. Momentum continuation → Breaking $7,251 with volume may confirm a shift back into a bullish cycle, targeting $10,623 – $12,956 – $18,268.
💡 Strategy: Swing traders may accumulate within the demand zone with tight stops below $3,800. Conservative traders may wait for a breakout above $6,272/$7,251 before entering.
---
🐻 Bearish Scenario
1. Breakdown of demand zone → A weekly close below $3,800 – $4,750 would invalidate multi-year support.
2. Downside targets → The next major support sits near $3,000, with further downside possible if selling accelerates.
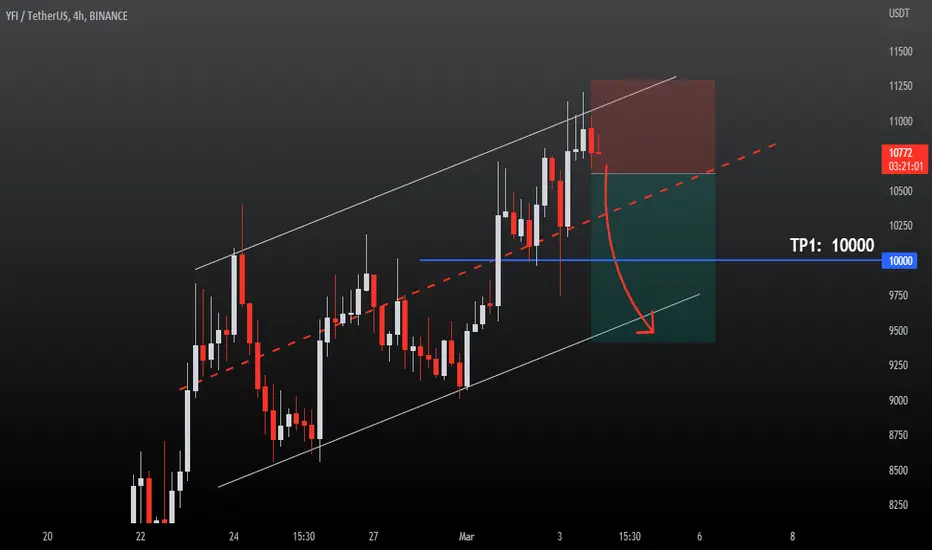
3. False breakout risk → A rally toward $7k–$10k followed by a sharp rejection could send price back into the demand zone, increasing the chance of a breakdown.
💡 Strategy: If breakdown occurs, short setups or waiting for entries at lower supports may provide better risk/reward.
---
📐 Pattern Structure
Accumulation Base / Long-Term Range → price consolidating for multiple years above a key demand zone.
Range-Bound Market → current trading range remains between $3,800 – $7,251.
Decision Point → the longer the consolidation, the more powerful the breakout will likely be.
---
🔑 Key Takeaways
YFI is at a critical decision point: hold above demand or break down to new lows.
Bullish Case: breakout above $6,272 → confirmation at $7,251 → potential rally to $10k – $12k+.
Bearish Case: breakdown below $3,800 – $4,750 → likely move to $3,000 or lower.
The yellow zone = the battleground that will define YFI’s multi-month trend.
---
📝 Important Note
This analysis is based on price action & historical levels. Always combine with indicators (RSI, MACD, volume) and keep an eye on market sentiment (BTC dominance, macro conditions).
This is not financial advice — do your own research before making trading decisions.
#YFI #YFIUSDT #YearnFinance #Crypto #TechnicalAnalysis #SupportResistance #PriceAction #SwingTrading #Altcoin
Yfiusdtidea
YFIUSDT 1W AnalysisYFI ~ 1W Analysis
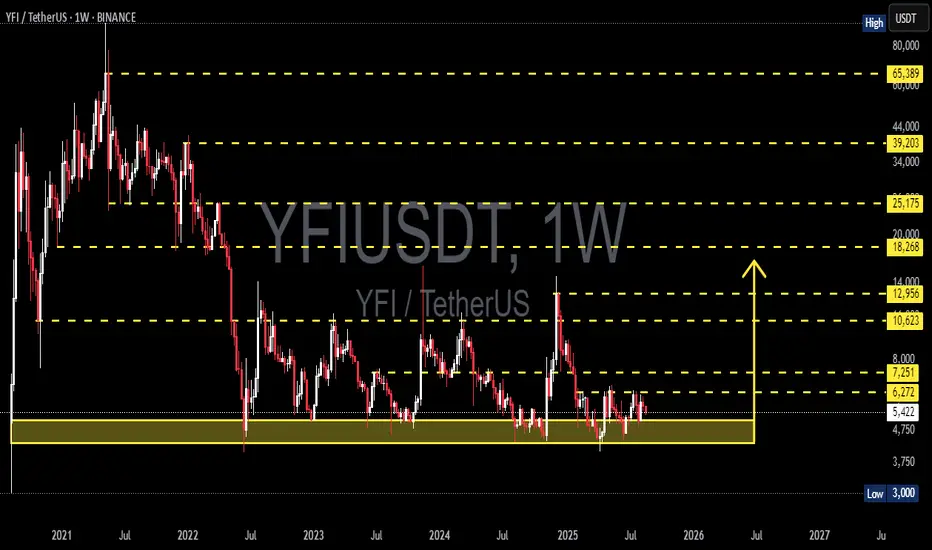
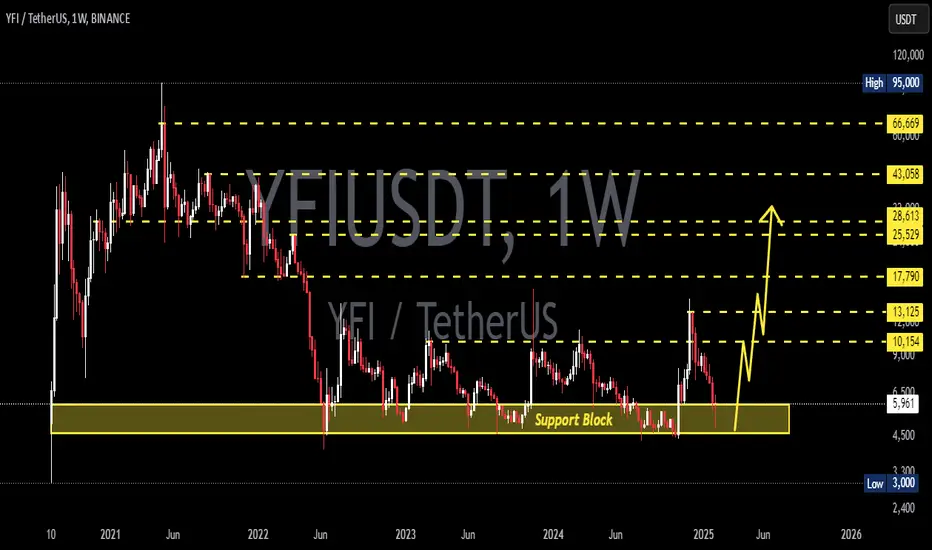
#YFI This is the lowest support block for now. Buy gradually from here with a short term target of at least 20%+ from this support.
YFIUSDT 1WYFI ~ 1W Analysis
#YFI Buy gradually from here with a short -term target of at least 20%+. This is a strong support for now.
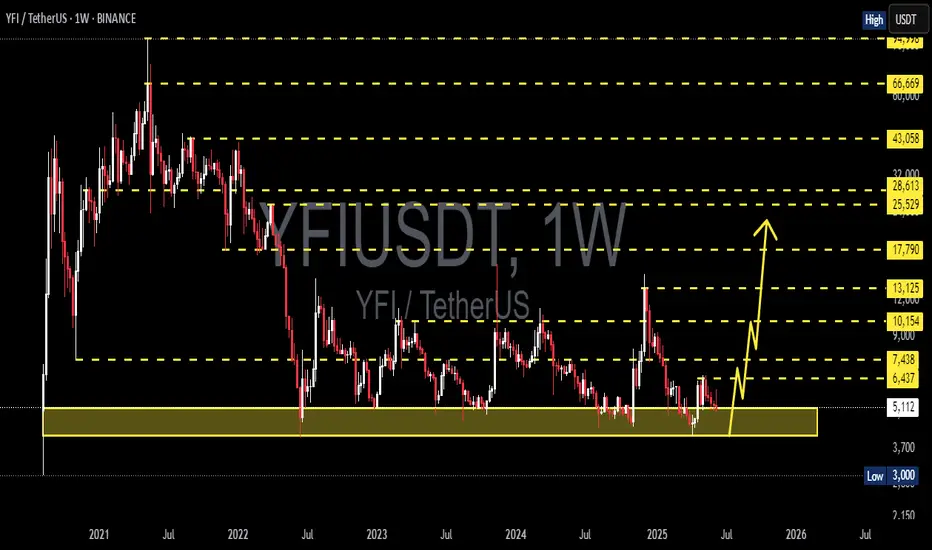
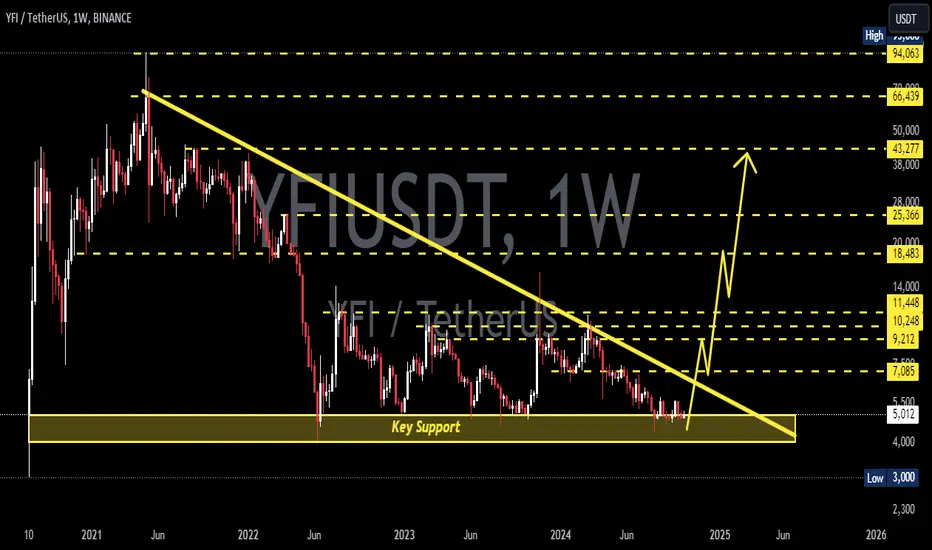
YFIUSDT 1WYFI ~ 1W Analysis
#YFI This is the lowest support for now. Buy from here if you still have a Conviction on this coin with a minimum target of 20%+
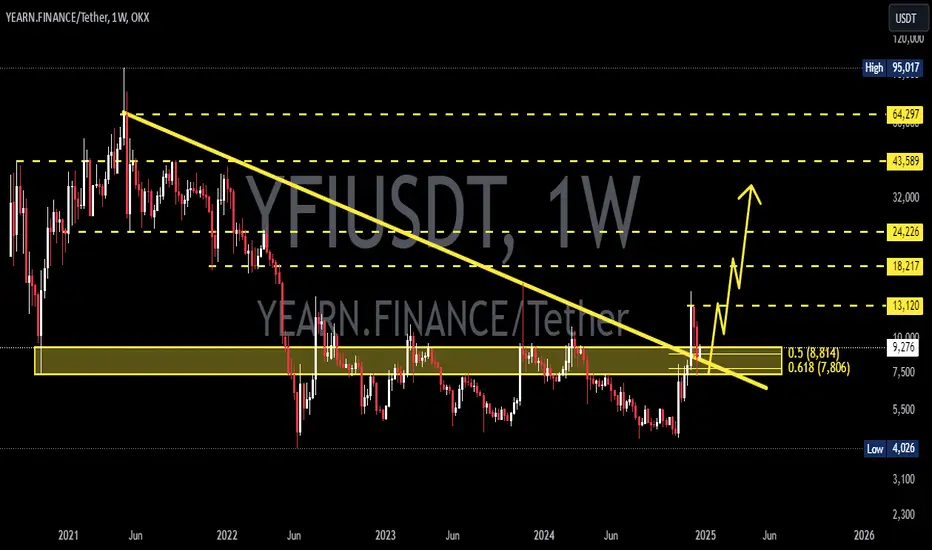
YFIUSDT 1WYFI Update ~ 1W
#YFI So far it is still maintaining its Bullish structure. and the current price successfully retested this rupport line + this Golden ratio. Buy gradually from here with a target of at least 20%+ from here.
YFIUSDTYFI ~ 1W
#YFI 1It is at its lowest price currently. if you still have Conviction on this coin. this should be a very good price to start buying again.
YFIUSDTYFI ~ 1W ✅
#YFI Make purchases gradually on this support block. with a minimum target of 20%+ 🟡
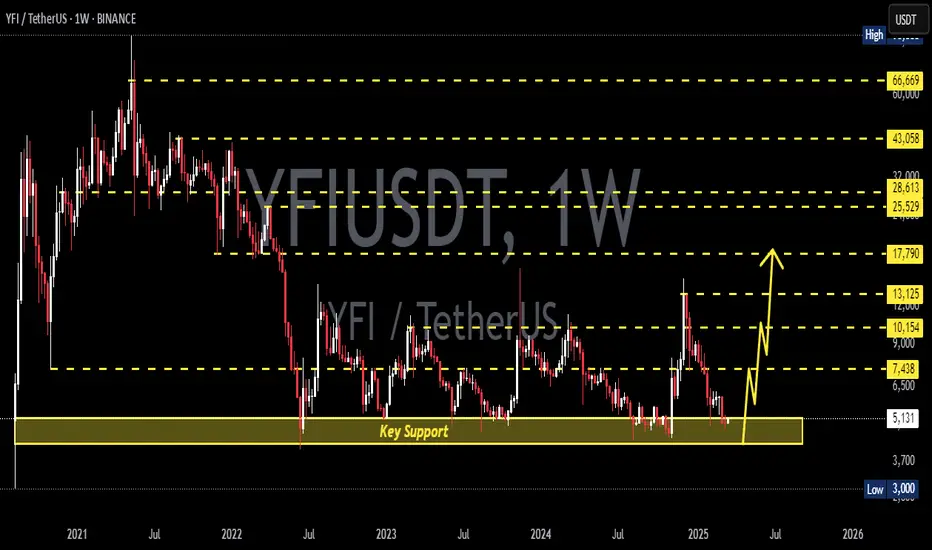
YFIUSDT 1WYFI ~ 1W
#YFI So far this support line is holding the price of COINBASE:YFIUSD from falling any lower.
Make purchases gradually in this pattern. with a target of at least 15%+ from here.
YFIUSDT IdeaYFIUSDT - YFIUSD
✅ ✅ Risk warning, disclaimer: the above is a personal market judgment and analysis based on published information and historical chart data on The trading view,
And only some of these analyzes are my actual real trades.
I hope Traders consider I am Not responsible for your trades and investment decision.
YFIUSDT IdeaYFIUSDT Idea | YFIUSD| YFI vs US Dollar |YFI vs USDT
✅ ✅ Risk warning, disclaimer: the above is a personal market judgment and analysis based on published information and historical chart data on The trading view,
And only some of these analyzes are my actual real trades.
I hope Traders consider I am Not responsible for your trades and investment decision.
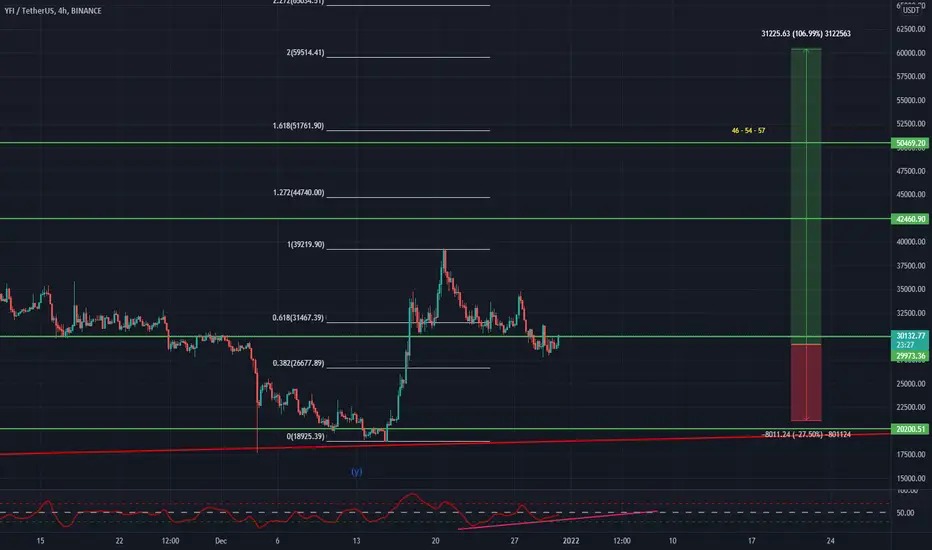
YFIUSDT Analysis (LOCAL VISION)Hello friends.
Please support my work by clicking the LIKE button👍(If you liked).Thank you!
Everything on the chart.
Entry: market and lower
Target: 46k - 54k - 57k
after first target reached move ur stop to breakeven
Stop: under 21k(depending of ur risk). ALWAYS follow ur RM .
Risk/Reward: 1 to 4
risk is justified
Good luck everyone!
Follow me on TRADINGView, if you don't want to miss my next analysis or signals.
It's not financial advice.
Dont Forget, always make your own research before to trade my ideas!
Open to any questions and suggestions.