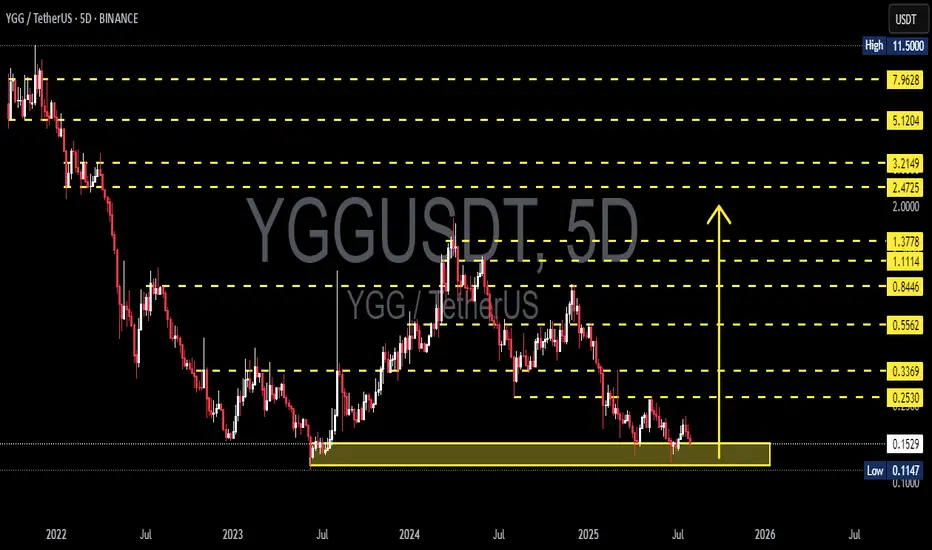
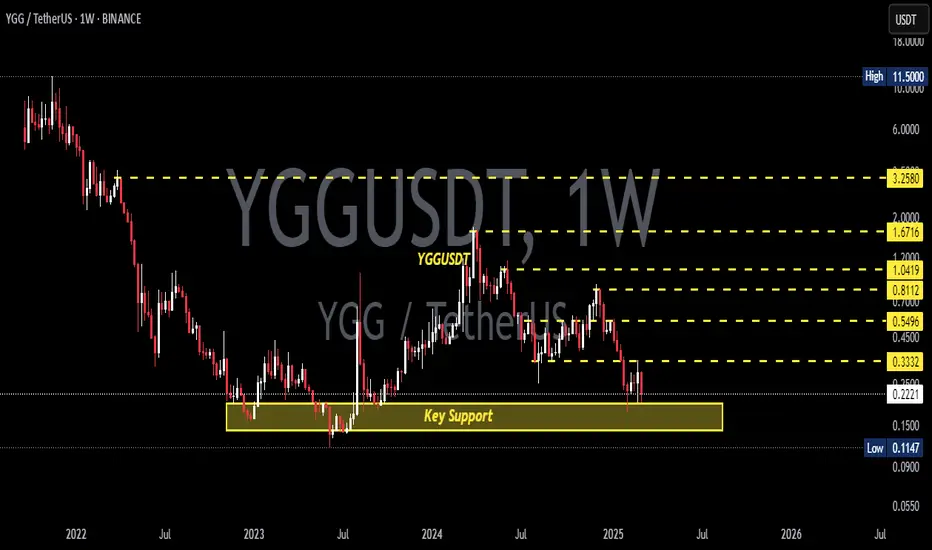
YGGUSDT Retesting Historical Support Zone! Bounce or Breakdown?YGG/USDT is currently at a critical crossroad. After a long-term downtrend from the peak at $11.50, the price has once again returned to the historical demand zone between $0.1147 and $0.1535 — an area that previously served as a strong base for reversals in the past.
Will this level act as a launchpad for a strong rebound, or are we about to witness a fresh breakdown?
---
🔍 Comprehensive Technical Analysis:
📌 Mid-Term Market Structure:
Price remains in a macro downtrend, but is now entering a potential accumulation phase.
This support zone has been tested multiple times throughout 2023–2025, confirming it as a key psychological level.
The current structure resembles a bottoming range, setting the stage for a possible trend reversal.
📊 Key Support & Resistance Levels:
🟩 Major Demand Zone: $0.1147 – $0.1535 (highlighted green box on the chart)
📈 Bullish Upside Targets:
$0.2530 (initial resistance & breakout trigger)
$0.3369 (early trend strength confirmation)
$0.5562 – $0.8446 (realistic mid-term targets)
Up to $1.11 and $1.37 (longer-term resistance)
---
🐂 Bullish Scenario (Reversal Potential):
If price holds this support and forms a clear reversal pattern:
A strong rebound toward $0.2530 – $0.3369 is highly likely.
A breakout above $0.3369 would confirm a double bottom or falling wedge breakout.
Additional catalyst: positive sentiment in the broader crypto market could accelerate the move.
🔔 Confirmation needed: a strong bullish candle + rising volume = reversal validation.
---
🐻 Bearish Scenario (Breakdown Risk):
If support at $0.1147 fails:
Price could slide lower toward $0.10 or even create a new all-time low.
This would extend the current bearish structure and invalidate short-term recovery hopes.
---
🧠 Pattern Insight:
The current setup resembles a sideways accumulation range.
Possible bullish formations:
Double Bottom
Rounding Bottom
Falling Wedge Breakout (typically bullish)
---
🎯 Strategy & Trader Perspective:
Aggressive Traders: May consider entering near support with tight stop-loss below $0.1147 and targets around $0.2530 – $0.3369.
Conservative Traders: Wait for a confirmed breakout above $0.2530.
Long-Term Investors: This area could present a gradual accumulation opportunity if you believe in YGG’s long-term fundamentals.
---
📝 Conclusion:
This isn't just a technical support level — it's a battle zone between bullish hope and bearish pressure. The next few candles will be crucial to determine whether the bulls will regain control or the bears will break through.
#YGG #YGGUSDT #CryptoSupport #CryptoRebound #AltcoinAnalysis #BullishReversal #CryptoBearish #CryptoTrading #TechnicalAnalysis
Yggusdtidea
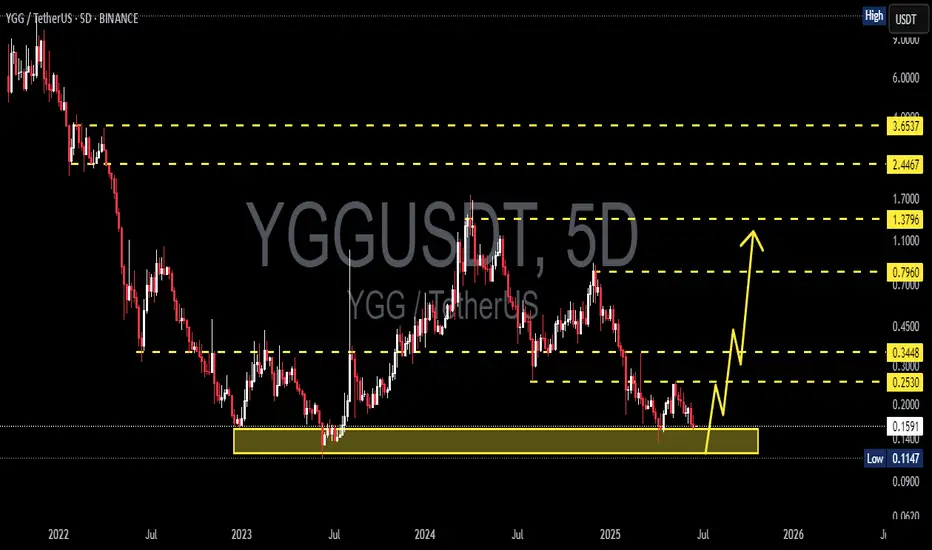
YGGUSDT 5D AnalysisYGG ~ 5D Analysis
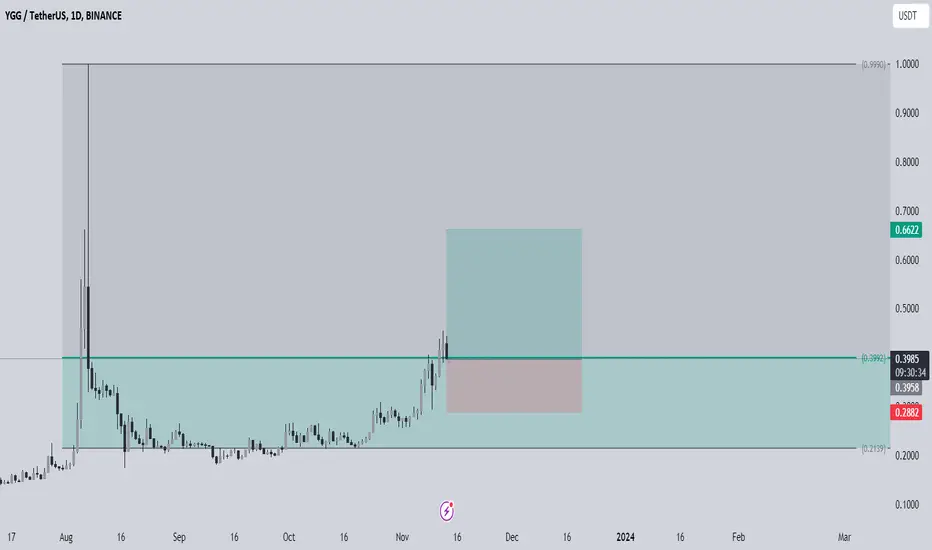
#YGG This is the lowest support for now. Buy if you still have faith in this coin with a short term target of at least 15%+ from here.
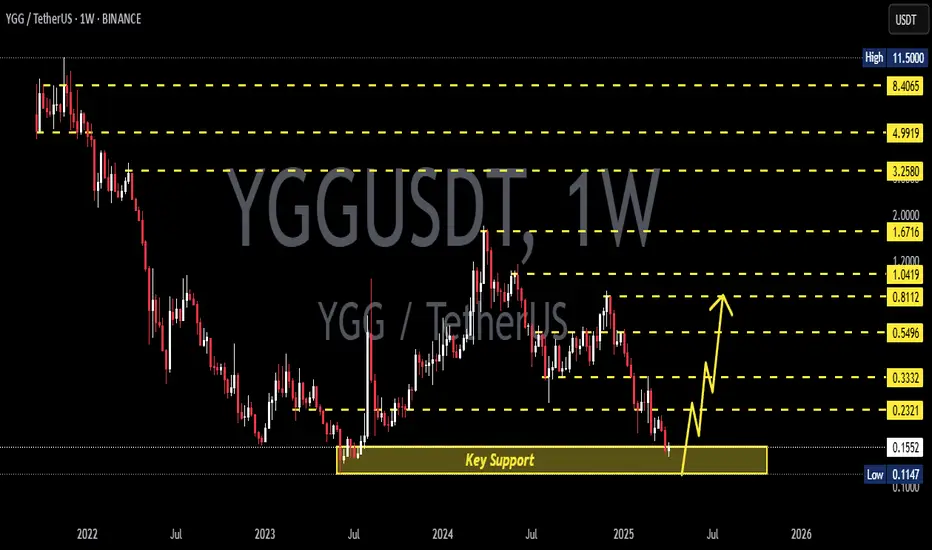
YGGUSDT 1WYGG ~ 1W Analysis
#YGG This is the lowest support that you might be able to consider to start buying back from here with a short -term target of at least 15%+.
YGGUSDT 1WYGG ~ 1W Analysis
#YGG Support blocks that you might be able to consider to start buying again from here, with a short -term target of at least 15%+.
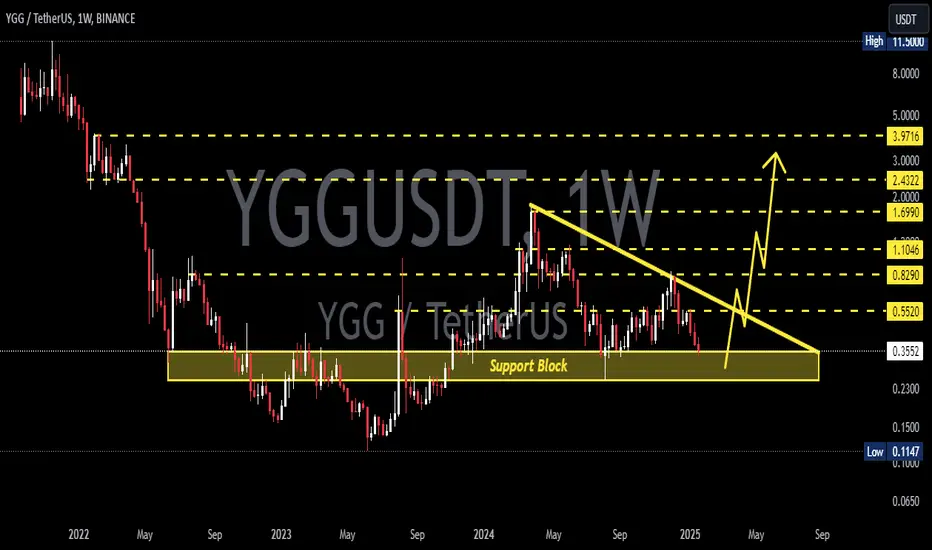
YGGUSDT 1WYGG ~ 1W Analysis
#YGG Re -testing this support block. Buy from here if you still have a Conviction on this coin with a minimum target of 20%++
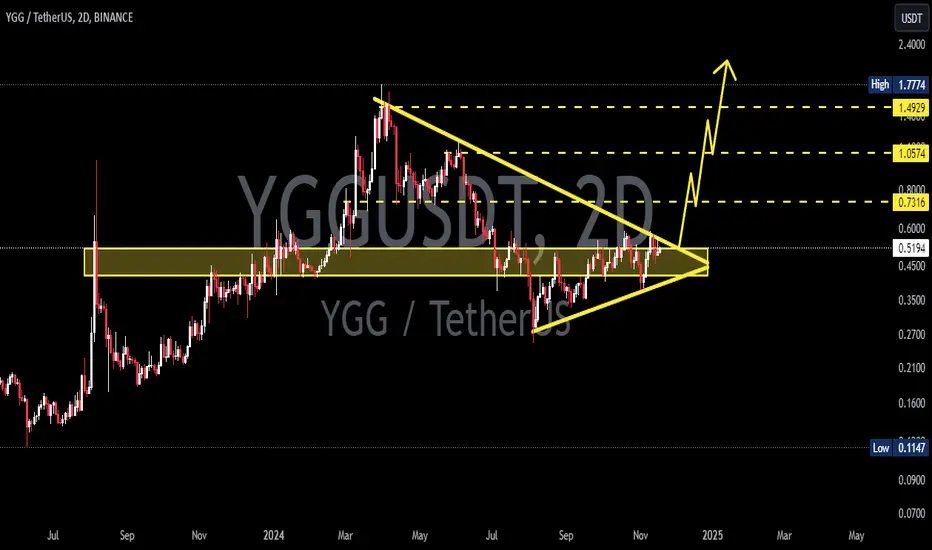
YGGUSDT 1WYGG ~ 2D
#YGG look at this graph,. Looks Bullish. If you have Conviction on this coin,. Buy after successfully breaking out this bullish pattern. With a minimum target of 15%++
YGG / YGGUSDTGood Luck >>
• Warning •
Any deal I share does not mean that I am forcing you to enter into it, you enter in with your full risk, because I'll not gain any profits with you in the end.
The risk management of the position must comply with the stop loss.
(I am not sharing financial or investment advice, you should do your own research for your money.)
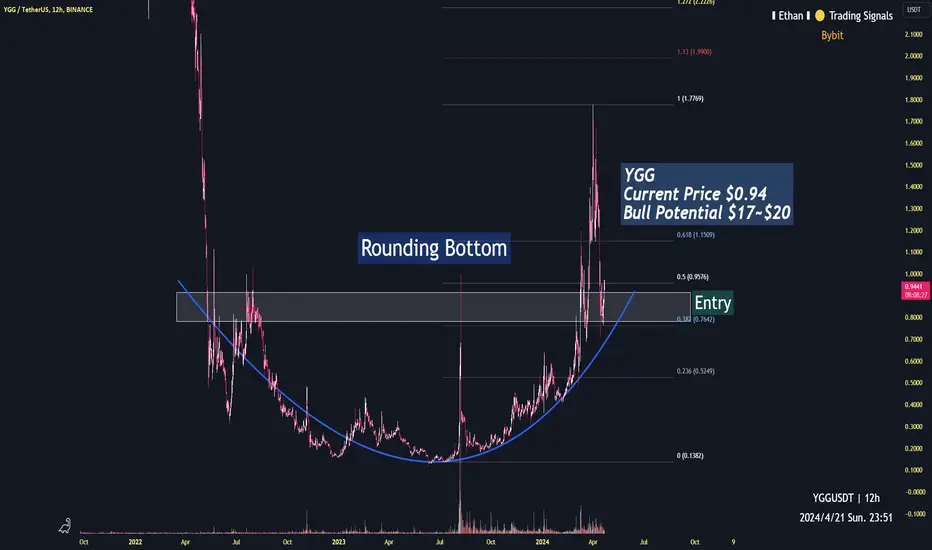
YGG target $1712h time frame
-
YGG increased over 100% while broke out its prevailing resistance zone of a huge rounding bottom structure. Price is still testing this zone that had been converted to support at approximately $0.86, this price zone aligns closely with YGG's 0.382 Fibonacci projection, an attractive point to purchase YGG. Also, current market cap is around 300 million, a conservative target is set at $17 with total supply when bull push its cap to 15 billion.
-
Bull target: $17~$20
YGGUSDT Good Bullish!YGGUSDT technical analysis update
YGG Price Breaks Resistance Line After 670 Days of Consolidation, we can expect a good bullish move coming days.
Buy zone : Below $1.08
Stop loss : $0.91
Regards
Hexa

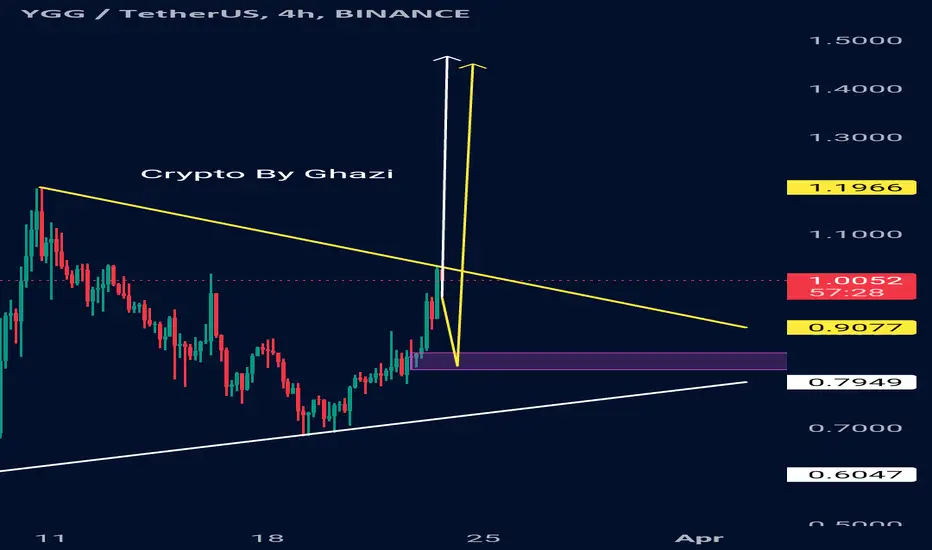
YGG/USDT IDEA YGG/USDT is presently showing a symmetrical triangle pattern on the price chart. An imminent breakout is anticipated. In the event of a successful breakout, there is the potential for a notable bullish movement in the short term, with an expected range of 40-80%. Please note that this information is not intended as financial advice.
YGGUSDTBINANCE:YGGUSDT Long idea
risky one 👀🛑
⛔"Daily crypto market analyses I provide are personal opinions & not financial advice. Trading carries risks, so do your own research & seek advisor's help.#DYOR"
Don't forget to like and comment
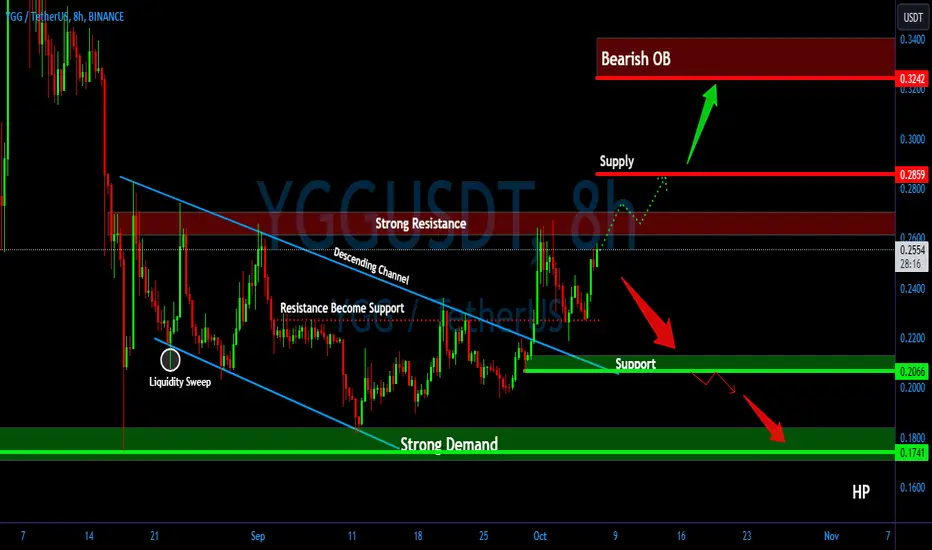
YGG/USDT We will see Significant Upward movement if YGG Break💎 Paradisers, YGG has certainly piqued our interest. Currently stationed at a formidable resistance zone, YGG's historical behavior indicates a pattern of rejections upon reaching this threshold.
💎 Previously, after breaking out of the descending channel pattern, YGG experienced a robust upward trajectory. However, upon encountering the strong resistance, it faced a sharp decline, retreating to retest the breakout support zone. Given the current chart dynamics and the powerful bullish candle that closed yesterday, there's a heightened potential for YGG to breach this resistance.
💎 On the flip side, if YGG once again struggles to surpass this resistance, we might witness a pronounced pullback. In such a scenario, YGG could revert to its support zone, aiming to fortify its position. A bounce from this level could set the stage for another attempt at the resistance. However, prolonged consolidation at the support might risk a breakdown, potentially sending YGG towards the more pronounced demand zone.
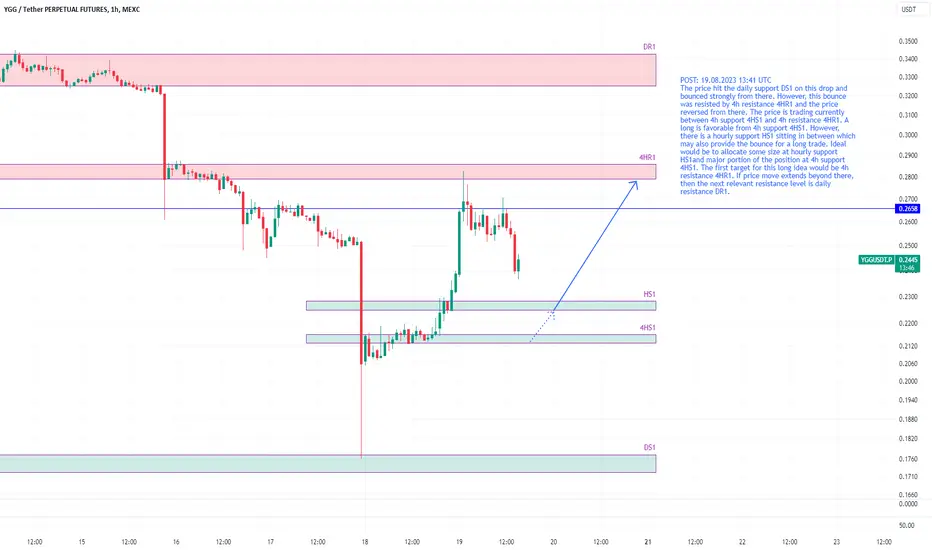
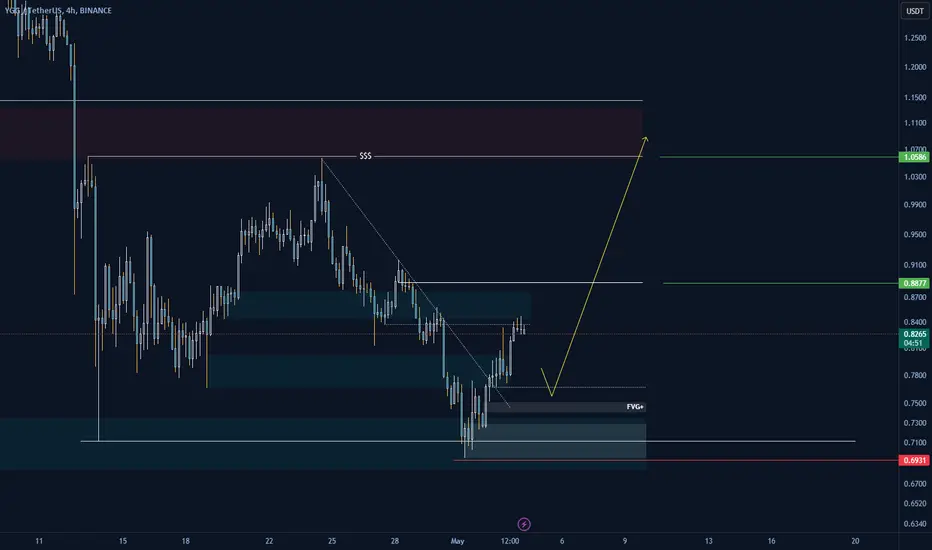
YGGUSDT levels for long tradeThe price hit the daily support DS1 on this drop and bounced strongly from there. However, this bounce was resisted by 4h resistance 4HR1 and the price reversed from there. The price is trading currently between 4h support 4HS1 and 4h resistance 4HR1. A long is favorable from 4h support 4HS1. However, there is a hourly support HS1 sitting in between which may also provide the bounce for a long trade. Ideal would be to allocate some size at hourly support HS1and major portion of the position at 4h support 4HS1. The first target for this long idea would be 4h resistance 4HR1. If price move extends beyond there, then the next relevant resistance level is daily resistance DR1.