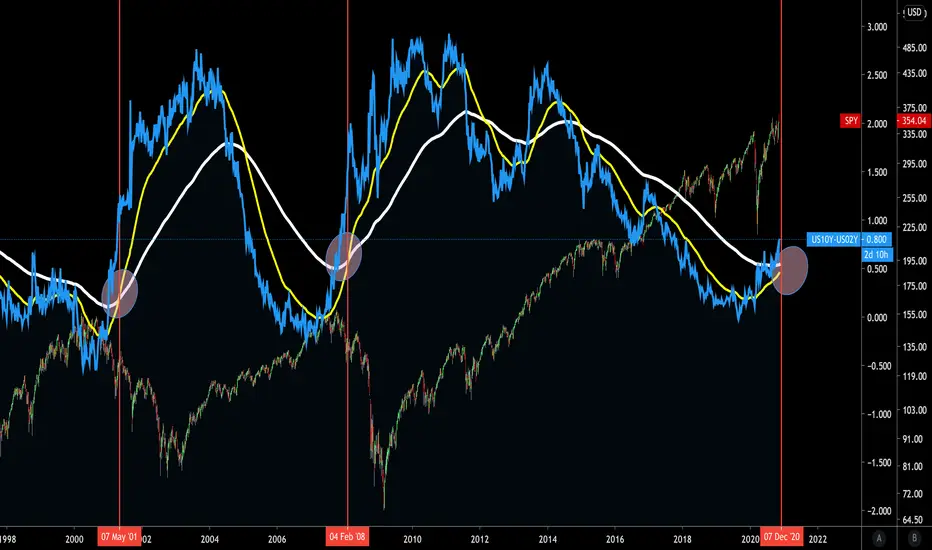
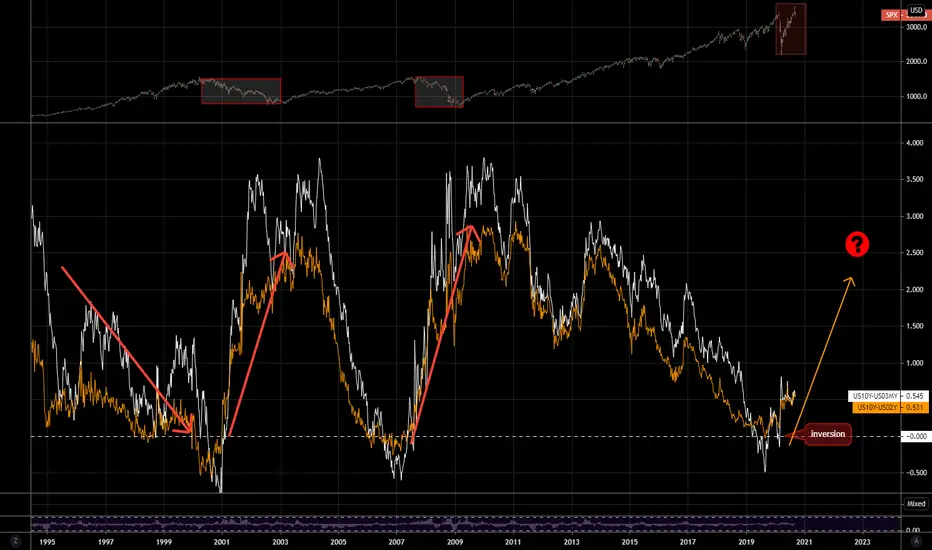
Bond Yields point to recession....or this time it's different?The 10y-2y bond yields are important because it is the long-short of market expectations; that is, how people view the near-term market vs. their perceived evolution of the market (that also anticipates the FOMC's likely reaction. It's several signals in one). The 10y2ys (blue) is the 10 year Treasury constant maturity (now at 0.96%) Minus the 2-Year Treasury constant maturity (now at 0.19%). When the spread increases, it means there's falling demand for long-term Treasury bonds, which means investors prefer higher risk, higher reward investments. Investors think interest rates will now rise in the short term.
Currently, the 10y-2y is at 0.8 and rising which last happened in December 2007, April 2001, December 1990, July 1986, October 1971... you get it. It's a reliable indicator, and in the past, a negative 10-2 spread has predicted every recession from 1955 to 2018 (SOURCE), but has occurred 6-24 months before the recession occurring. The last time it went negative was in August 2019.
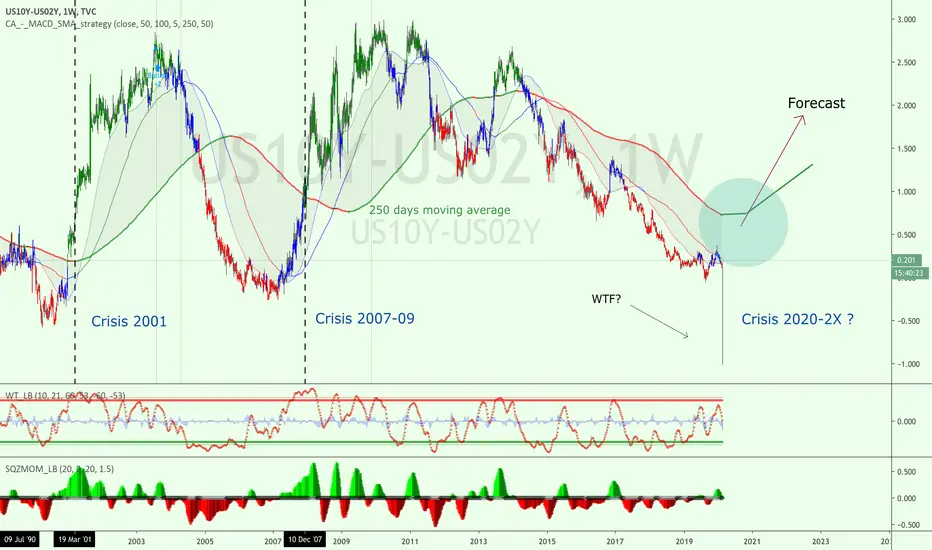
THE ANALYSIS
Notice that we're approaching a golden cross (yellow 50ema crossing the white 200ema). The last time this happened was January 2008, and May 2001. I've overlaid the S&P- you can see it's crashed.
So is this a new paradigm of monetary policy? Or does nothing change? Is this time really different?
Here's the historical US Yield Curve source.
MORE ABOUT THE YIELD CURVE
Bond prices and yields move inversely of each other. When bond prices go up yields go down, and vice versa. The reason that lower yields in the long term are a indicator for the economy is because longer term bonds are seen as safe investments meant for preserving wealth; while stocks, forex, and derivatives are riskier and used for growing wealth. When investors have a good outlook on the economy, they will sell their long term bonds and put that money into the riskier investments listed above. This flight from longer term bonds to riskier investments causes demand for the longer term bonds to fall, causing bond prices to fall ,and yields to increase. In times of bad economic outlook, people will start moving their money from stocks into the longer term bonds as a way to protect themselves from potential future downturns. This flight from stocks to longer term bonds causes demand to increase, causing bond prices to increase, and yields to go down. The change in bond yields is based on bond price, which is based on supply and demand .
HISTORICAL CONTEXT:
The 10-2 spread reached a high of 2.91% in 2011, and went as low as -2.41% in 1980. During recession, central banks lower rates pushing down the i.r. curve. When the spread starts contracting, market expects a coming cut of the i.r. and a future lower curve. For this reason, real world curves (vs academic ones) are decreasing on the long terms: a kind of economic cycle is implied. You may also read the spread under a credit risk point of view: a tight spread means "if an issuer can survive 2y, it is very likely that it will survive also 10y therefore a small extra premium is required". This is very clean in distressed bond issuers: implied yields usually form a reversed term structured (decreasing like an hyperbola).
See more:
Yieldcurve
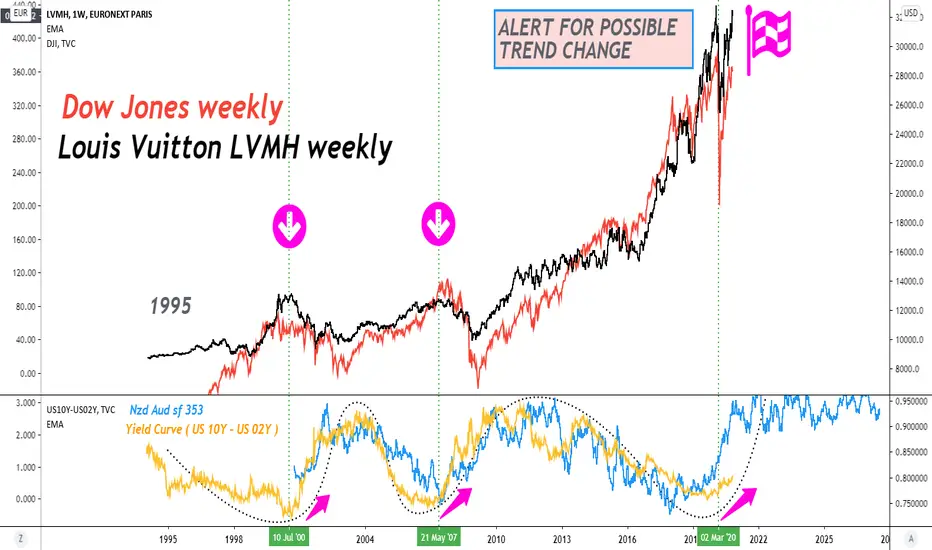
Louis Vuitton & Dow Jones Intermarket correlation between Dow Jones and Louis Vuitton , and the fractal correlation between Yield curve ( US 10Y - US 02 Y ) and NZD AUD shift forward 353 weeks ,this technique of moving forward is used by Larry Williams and aims to align the same Wyckoff phases of two out of phase, unrelated graphs. The Yield curve is the most powerful indicator for the stock markets, the inversion of the curve predicts the trend change, I have devised a fractal system that predicts the yield curve, moving the Nzd Aud chart forward I get a fractal correlation that has existed for 25 years, will it continue to exist? if the answer is yes then it is telling us that the yield curve will change direction, but if it changes direction it means that the dow jones will also change direction, if this "law" is maintained, if the fractality is maintained I also have the information that will change the trend for Louis Vuitton too.
What could go wrong with the yield curve ?New Fed policy will allow inflation to run above its 2% target. To achieve higher inflation the Fed is is expected to hold short-term rates very low for a long time.
A sudden steepening of the yield curve after an inversion almost always coincides with recession.
Aggressive expansion of the money supply through fiscal and Fed policy has led to concerns of rising inflation. The US government needs to fund relief packages and pump money into a weak economy. Excess supply of longer-dated Treasury supply hitting the market may put additional pressure on prices and keep long dated yields moving higher. Institutions may aim to unload expensive long-term Treasuries onto the market which could depress prices and increase yields.
Investors may soon demand higher yields on longer-term debt. But are we ready for higher back-end rates & a steeper curve?
The inflation break-even rate between 10 year Treasury Inflation Protected Securities (TIPS) and regular 10 year Treasuries hit 1.8% last month, the highest since February.
Was yield control implemented in April for US10Y at 0,7 % ?The US10Y yield has barely moved since April. Has the FED implemented yield curve control?
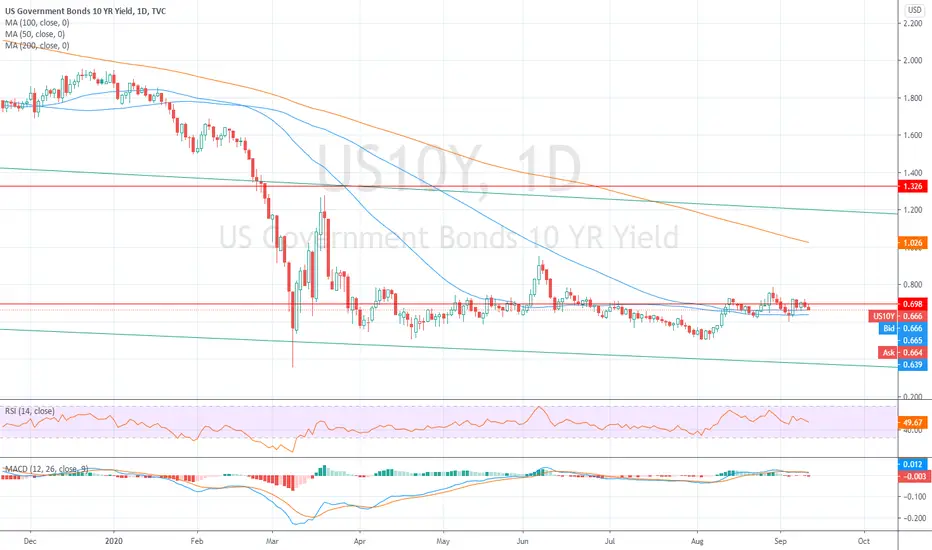
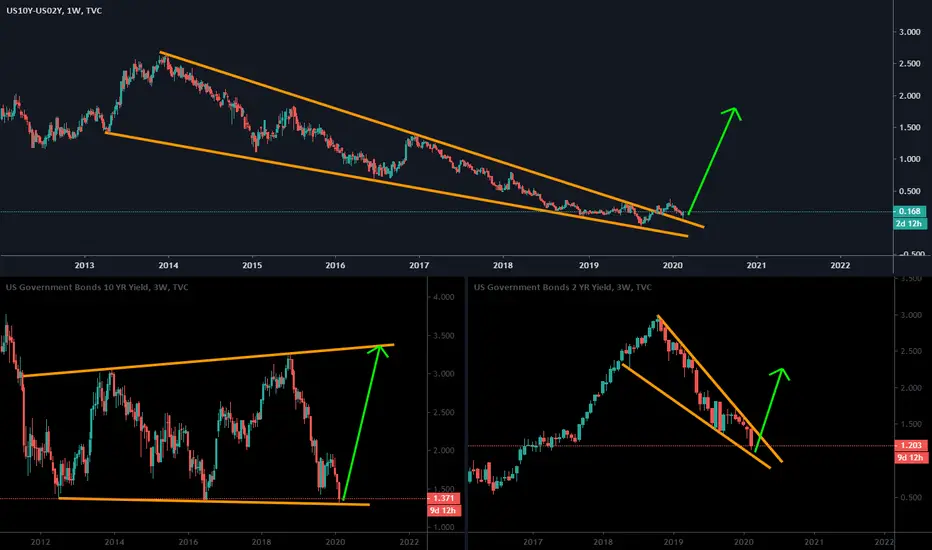
US10Y seems like it is on its way upCould this be the time that the long-term yields will start to rise in the US?
It looks like it from a technical view. RSI and MACD are both pointing towards an upward turn.


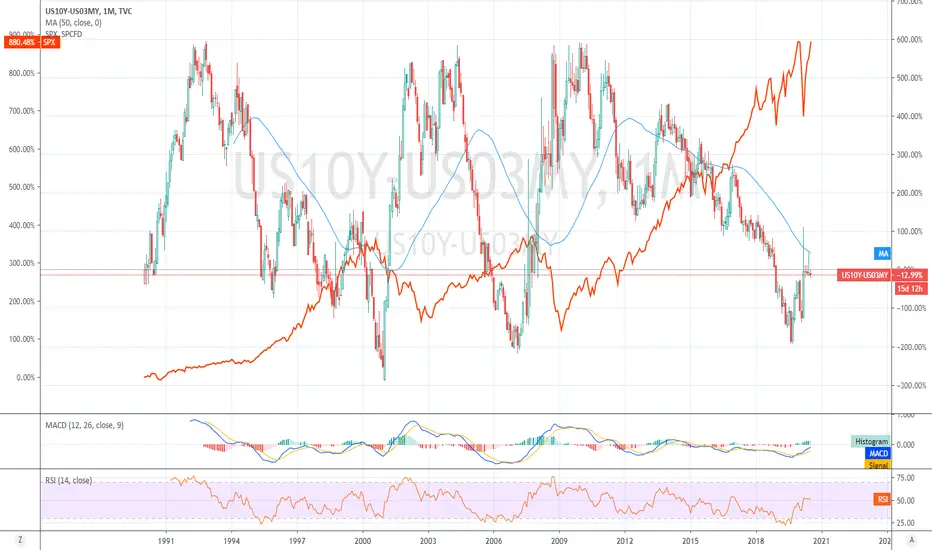
Is the relationship between the yield curve and SP500 dead?Looking at the TVC:US10Y - TVC:US03MY and the AMEX:SPY it seems that during a recession like this TVC:US10Y - TVC:US03MY should rise and AMEX:SPY should fall.
Will it be the case this time as well or is this time different?
Maybe the FED cannot allow TVC:US10Y to rise this time due to the amount of debt and will instead impose yield curve control like in Japan by printing money to buy TVC:US10 ?
Yield Curve Indicator strikes again!The inverted yield curve (3mo vs 10yr) predicted the COVID-19 recession
FEDERAL RESERVE PREP -- 0.75% Key level in US 10-YEAR YIELDBond yields have broken out beyond 0.75% - coming just shy of 1% - 0.75$ is now support
The Fed could try to stop yields moving higher in its decision today by new policies including:
1. Yield Curve Control (YCC) - or
2. Forward Guidance

The Best Yield Curve Tutorial You've Ever ReadThe two year has remained relatively flat since this week's open. However it did gap up significantly. Why is the 30 year falling (see linked article) while the two year remains consistent?
Bonds of different maturities care about different things. In particular, the shorter end of the spectrum cares less about the long term effects of inflation and the general position in the economic cycle than the long end. Why? Those effects will be felt less in two years than the short term effects of interest rate decisions or the sentiment about it.
Conversely, the 30 year has more time to price in these factors. It has to take in the considerations above, and more. Hence why the 30 year is tumbling right now, as it's more sensitive to risk sentiment and longer term factors.
Don't forget that bonds are fixed income products, meaning they pay a yield that is inversely proportional to the price. The difference between the yield at either end of the spectrum is commonly referred to as the yield curve . The yield curve could also refer to a plot of the set of all yields on treasury products of various maturities.
The difference between the two ends could narrow, or flatten . It could also steepen . Furthermore, that flattening or steepening could be driven by either end. In this case it is led by the long end. Since prices are decreasing (on account of risk on sentiment), we call this a long end led bear steepener .
If you liked this analysis, subscribe for more content. Also check us out at Ghost Squawk!

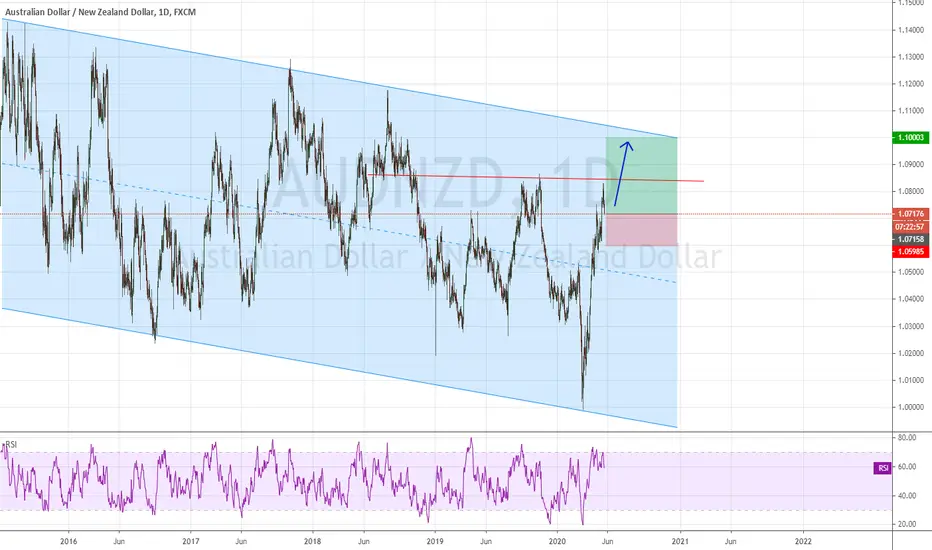
Long AUD/NZD, targeting 1.1000Recent developments
A dovish RBNZ policy announcement has been conducive to the pair's push to a six-month high. Further monetary policy of asset purchases over negative rates was largely expected.
Technical analysis
The pair has given back a bit since rallying at its fastest pace since 2014 (around 7% increase in just over a month). If it can break past previous 1.0850 key level, then there should be a chance to test 1.10 or at the very least trade up the channel with ease.
Primary drivers for a further move up
On the fundamental side, elevated risk sentiment on the backdrop of bottoming growth in markets, as well as the continued divergence between RBA and RBNZ should support the upward direction of the pair. Policymakers have remained quite dovish, which should be risk-positive as central banks have incentive to ease rather than tighten. With that being said, the RBNZ policy stance is looking more dovish than the RBA's. We can look at both policy stances and yield curves for an indication of what's to potentially come.
The RBNZ have kept the official cash rate at 25 bp, while the base of asset purchasing have been expanded to a cap of NZ$60bn. Although the market seems to be pricing in negative rates, I don't think it's likely that we will see that, given that the RBNZ effectively guided that it won't happen (at least for this year - although this could be on the cards for 2021). Why lose all credibility on forward guidance when there are other methods of easing such as bond purchasing or fixed term loans? Either way, the base case is further easing and I would look towards August and June meetings as further catalysts if financial conditions tighten.
On the contrary, the RBA has stopped purchasing bonds since early May after hitting 25 bp on the 3Y; keeping the curve at the current levels should be supportive to Australia, which remains a relatively high yielding Aaa country (despite slight rating downgrade).
Risks
Downside risk on AUD/NZD lie in 1) narrowing policy differentials, 2) risk sentiment softening, 3) and/or a more hawkish RBNZ that would lead to NZD strength, thus pushing the pair lower.
As such, targeting top end of the channel 1.1000 with a stop of 1.05985.
Prediction of next financial downturn Pt.2Dow Jones dropped over 1200 points in one day, that's the biggest downward move ever happen.
Interest rates are going down FED Watch Tool shows over 99% that FED will cut at least 25pts.
More cuts will come soon, please check www.cmegroup.com
I follow this website and 3-5 days ago there was only 10% for a single interest rate cut.
Unfortunately, due to the Coronavirus outbreak global economy suffers and the whole world will soon enter Great Depression!

CANADIAN HYPERINFLATION: GUARANTEED!!!CANADA WILL SUFFER FROM HYPERINFLATION WITHIN 2 YEARS!
I AM THE ONLY ONE SCREAMING THIS FROM THE ROOFTOPS!
THE EVIDENCE IS SIMPLY INCONTESTABLE! LOOK AT THAT SELL-OFF!

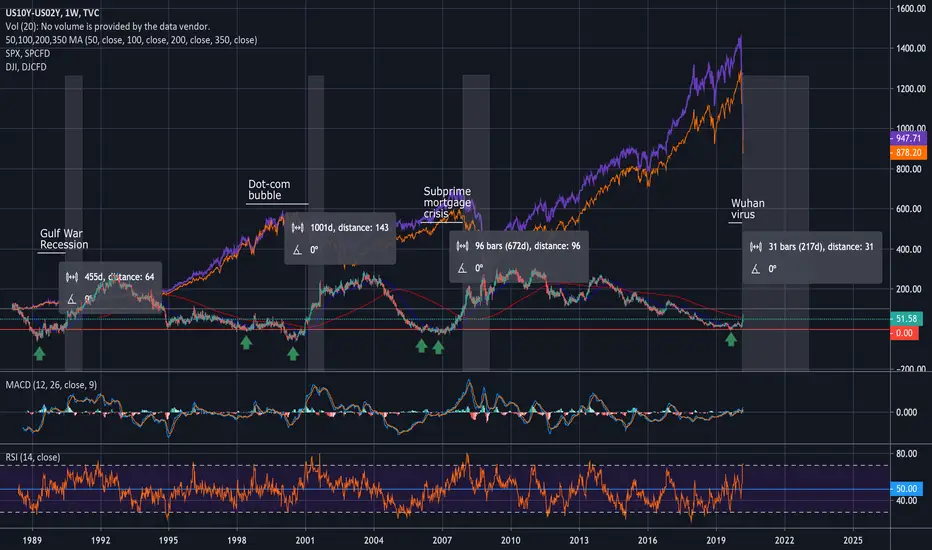
Brace YourselvesGreen arrows pointing at instances where the Yield Curve is Inverted. Info line shows how many days are in between the yield curve inversion and the beginning of a recession. As you can see, the yield curve inverted again in Aug 2019.
YIELD CURVE IS NOT WELL UNDERSTOOD!BOND MARKETS SAVANTS CLAIM THAT THE DEEPER THE YIELD-CURVE INVERSION, THE DEEPER THE RECESSION!
HOWEVER, VISIBLE INVERSIONS HAVE BEEN INCREASINGLY SHALLOW WHILE FOLLOWING RECESSIONS HAVE BEEN INCREASINGLY SEVERE, CULMINATING IN THE 2008 GLOBAL FINANCIAL CRISIS!
BY THIS LOGIC, WILL THIS RECESSION BE MORE SEVERE THAN 2008?


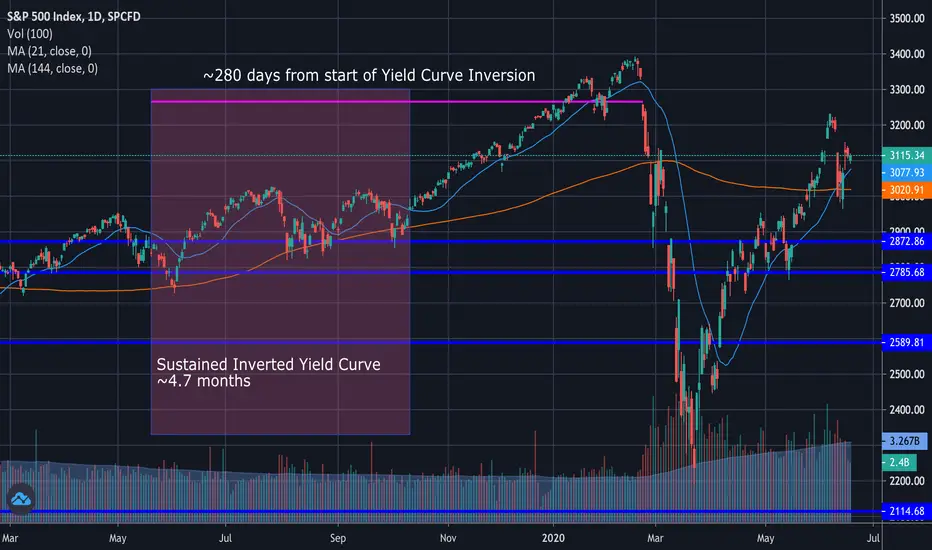
Yield Curve and the SPYIf we take some of the information that past yield curve signals have shown us we can expect about 18 Months of correction. Funny enough the average bear market is about a year and a half as well so there's a bit of confluence with what the charts suggesting and what we know as good trading rules of thumb.
Based on this information i'll be letting part of my SPY Put position go into next month and look for reversals to exit and begin hunting long setups into April-May 2020. As with all trading the market can and will do anything it wants to haha so keep that in mind as well and be good about risk management ALWAYS.
More Info:
www.investopedia.com
www.investopedia.com


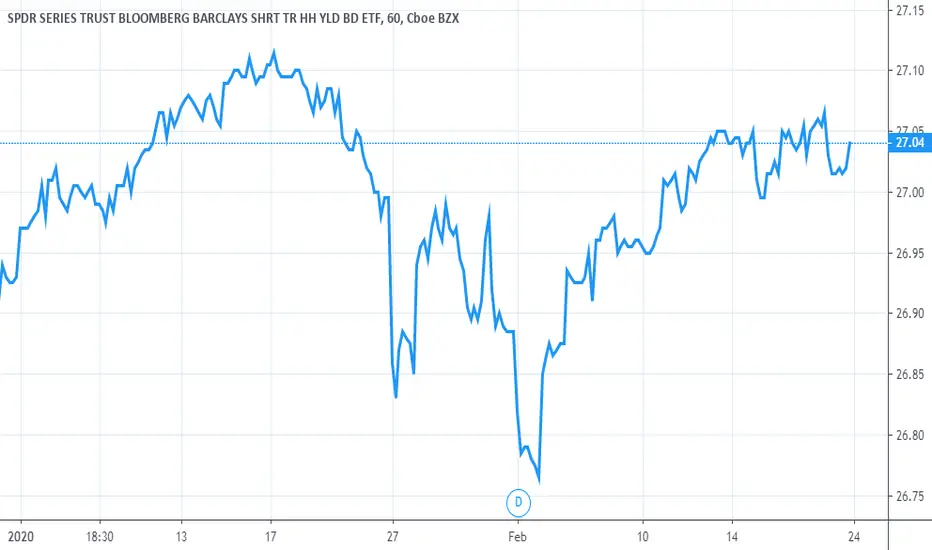
Junk bonds high risk as economy deteriorates and spreads widenWith inflation rearing its head of late, and sectors of the economy prone to deteriorate due to coronavirus, narrow junk bond spreads will likely widen - pushing down the prices of high yield bonds.