10 YEAR TREASURY YIELD SIGNALLING INFLATION EXPECTATIONSSince mid-summer 2014 the 10-Year Treasury Yield started correlating with WTI Crude Oil, which can be seen on the image below:
The correlation was established as a result of dynamics of oil prices, when falling oil was perceived as a risk to inflation. Expectations of lower inflation have driven the 10-Year Yield down with the WTI Oil. Market has perceived the situation correctly, as the CPI inflation has fallen down to about 0% on y/y basis consequently, where it stands now.
Recently, however, the 10-Year Yield started to diverge from WTI Oil price dynamics. As can be seen on our chart, the oil is trading laterally in the range of 57-62 USD per barrel since May 2015. The 10-Year Yield, on the other hand, actually started to move upwards since then, along the upper 1-st standard deviation from its quarterly (66-day) moving average.
Our idea is that current upwards dynamics of the 10-Year Yield in relation to lateral WTI Oil reflects positive inflation expectations of market participants. It means that in the observable future the CPI and PPI inflation measures are likely to start bottoming out on y/y basis.
If our proposition is true, it will be a positive development in terms of financial markets, as higher inflation expectations will offset the deflationary impact of current slow CPI and PPI inflation measures on the perceptions of market participants.
Yields

Watch for the Bund to bottom around 148.50The sharp rise in sovereign yields in Europe has taken a lot of people by surprise, and the sentiment in the market is more and more bearish as people are starting to believe Bill Gross's "short of a century" statement made two months ago. We should all be asking ourselves if it's reasonable to expect yields to keep rising over the long term as the ECB will clearly continue buying up excess supply for the next 15 months. If you think this is the case, then you must believe that the euro will head back above $1.20 during the second half of the year (this isn't necessarily out of the question given the risk with Fed rate forecasts). Whatever you may think on a fundamental basis, you should be watching the Bund's long-term bullish trend line closely in the days ahead. This support comes in at around 148.50, which is the 50% retracement level from the 2013 lows to this year's highs. Any daily candlestick indicating a bullish reversal after having tested this support would make me want to attempt a long strategy. I'd like to see the EUR/USD hit $1.145-1.15 with the Bund at support to have the best timing possible on such a strategy.

The Big Bubble - Correlation S&P500 vs Treasury 30y2007-2012: Convergence between S&P500 trend and yield on Treasury 30y USA:
- Downhill stocks leads to a reduction in yields on the bond market . The flow of money coming out of the US stocks and goes to US bonds for the "safe haven" - RISK OFF.
- Rise in share prices on stocks leading the market yield bonds to rise due to the vendite.Flow of money out of the US bond market and goes on US stocks - RISK ON.
START THE BUBBLE: The first divergence for Fed QE & BoJ: A rising index corresponds to a fall in yields = excess liquidity in the market - Bubble begins to swell and then be absorbed
THE BIG BUBBLE: The divergence between performance of the stocks and lower yields on the bond market is the highest ever. The bubble is always more swollen and the two lines more and more divergent. A Fed rate hike (and therefore yield) approaches the two lines (seen in early 2015) but if this were not enough the bubble may deflate and bring down the stocks..fly to normality?!
BE CAREFUL

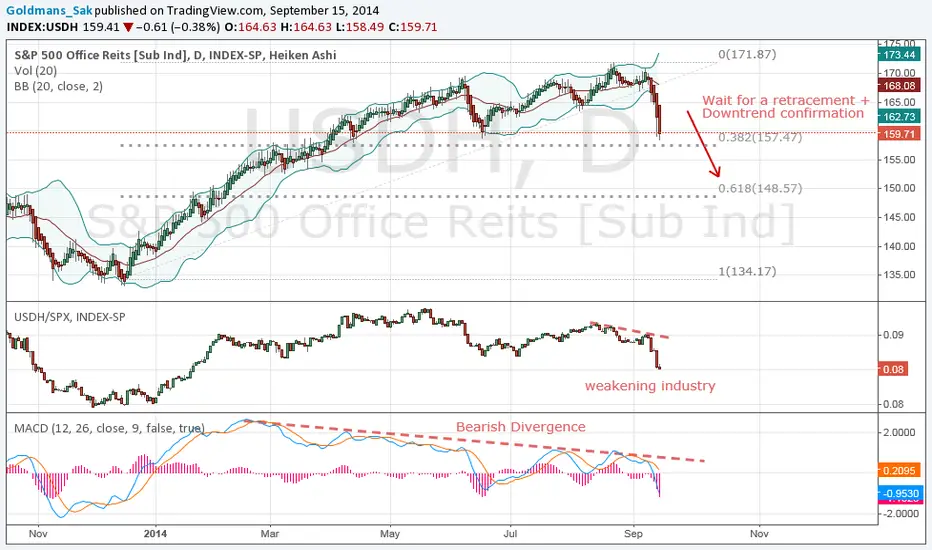
Short Office REITSMacro:
The Short term spike in yields triggered a large selloff in REITS. As mentioned in the 10 Year yield post, The yields are likely to rebound until at least end of year which could put downward pressure on REITS.
Technicals:
USDH is underperforming the S&P which is setting up for a possible short across the board over the next weeks.
The bearish divergence YTD and the recent new low today suggests that price could start reversing from the uptrend YTD.
Ideally, a short position should be entered on a weak stock within that weak industry after a retracement to the 20 DMA and a downtrend confirmation on the day chart.
Initial target: the 61.8% fibo retracement to 148