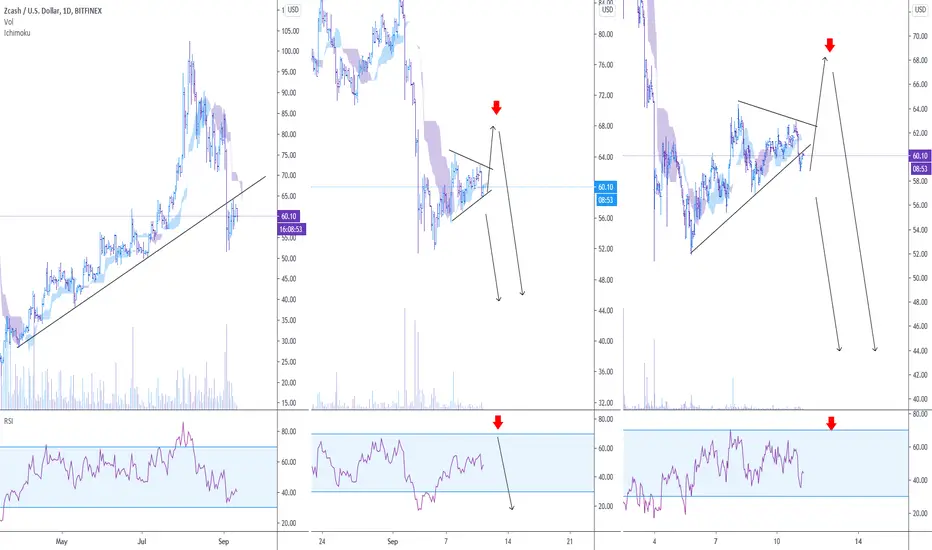
ZECUSD: Downtrend (11.09.2020)On D1, the cloud is directing downward, indicating a downtrend.
On H4, the price fluctuates around the cloud, which indicates the formation of a correction.
Besides, on H4 and H1, the correction model in the form of a triangle is visually well visible.
We recommend selling on the breakdown of the downward correction model boundaries, or in case of false growth to the level of 68 (when RSI will reached overbought level on H1 and H4).
Zecsell
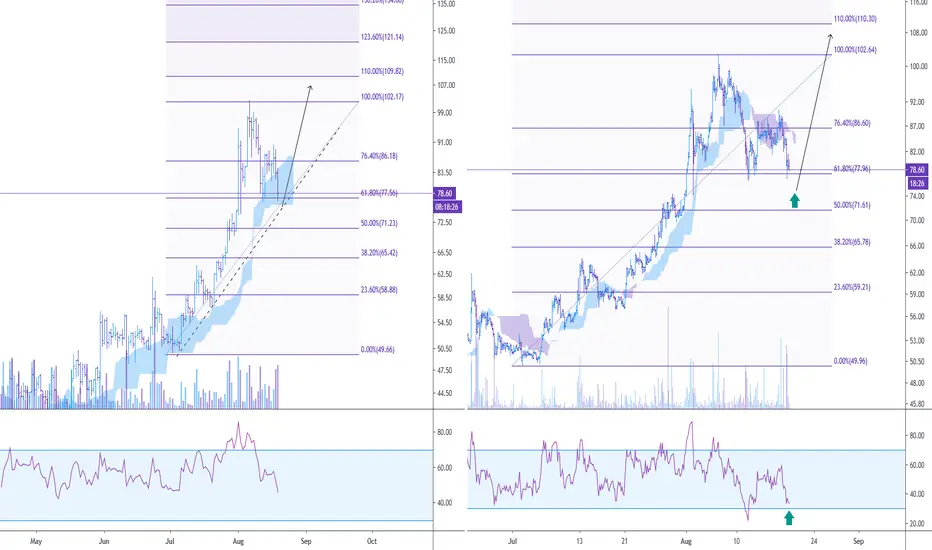
ZECUSD: Good opportunity for LongAt D1, the cloud is directing upward, indicating an uptrend. The RSI moved down and the price found support on the Ichimoku cloud.
At H4, the cloud is directing downward, indicating a price correction at the D1 timeframe.
Besides, RSI is at the oversold level, which indicates the weakness of sellers.
We recommend buying ZECUSDT near the 50% Fibonacci level and take the profit near the level of 108.
ZECUSD: Analysis using Ichimoku 30/06/2020H4
On D1, the cloud is directing upward, indicating an uptrend.
Conclusion:
Locally, we recommend buying when the RSI reaches an oversold level on the H4.
H1
At H4, the cloud is directing downward, indicating a downtrend.
Conclusion:
Locally, we recommend selling when the RSI reaches an overbought level on the H1.
