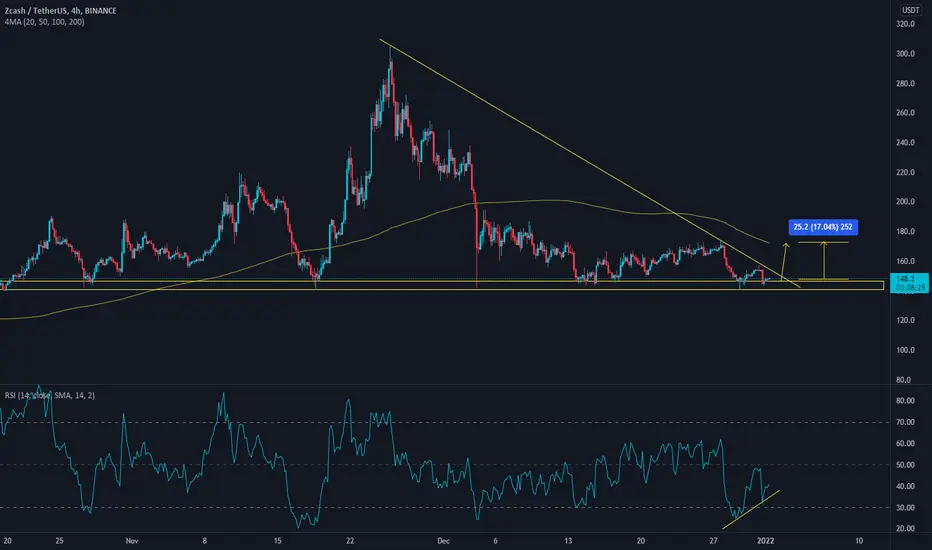
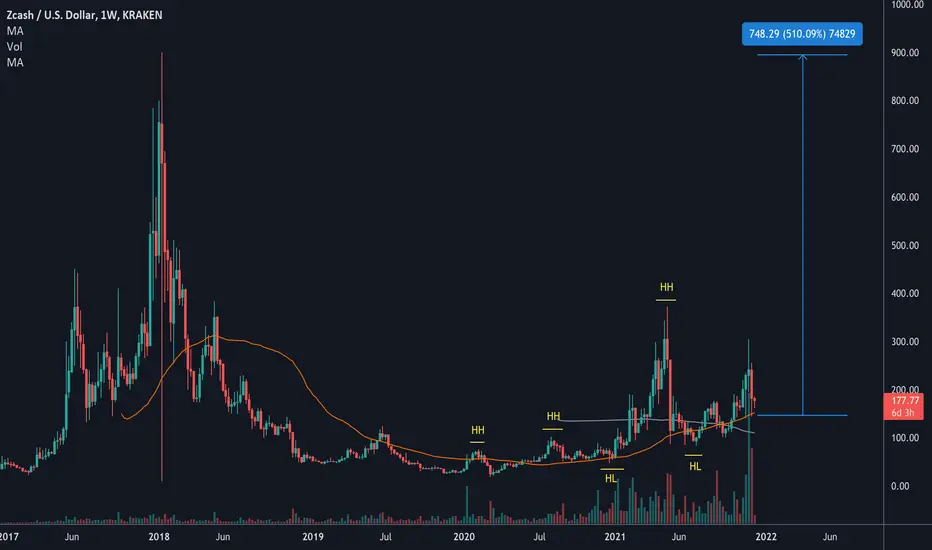
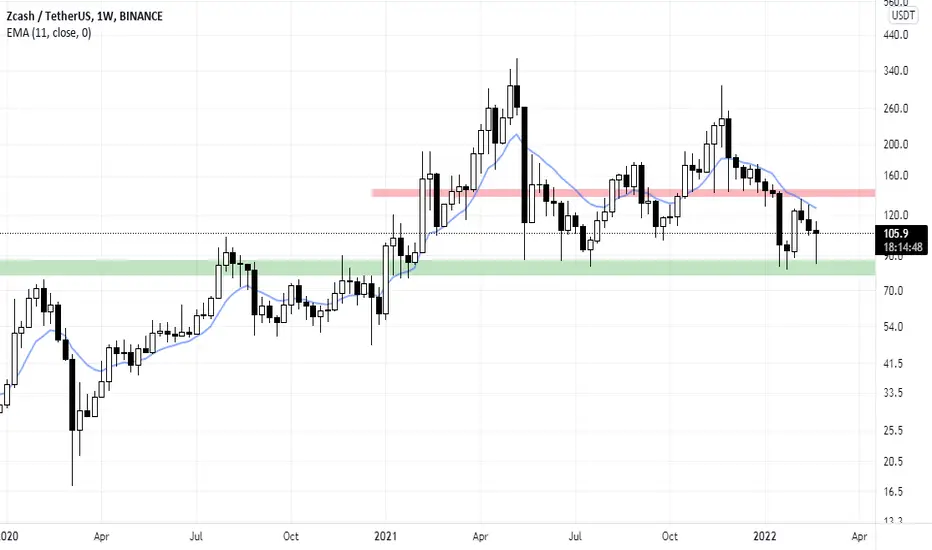
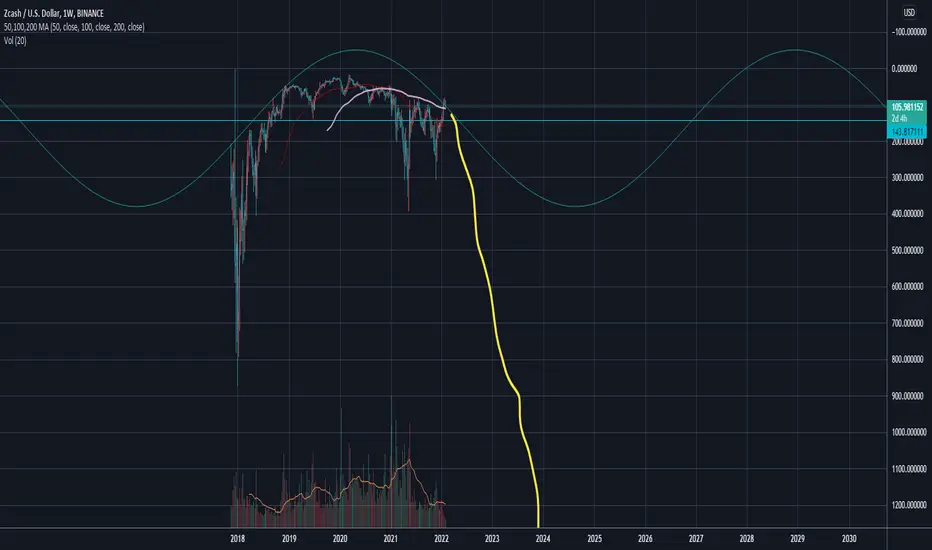
A potential weekly chart double bottom on zecusd forming as wellThis weekly chart double bottom is much more massive and currently far more speculative than the 1 day chart double bottom I posted an idea about just before this idea. However I felt it worth mentioning as it would be fun to see this actually unfold then come back to this idea later to click play on the chart and see the pattern play out from its second bottom. If this one were to play out, then ZECUSD’s target would be $520. Of course again, this one is much more speculative at this point, but still worth keeping an eye on. *Not financial advice*
ZECUSD

Zcash (ZEC) - March 9Hello?
Traders, welcome.
If you "follow", you can always get new information quickly.
Please also click "Like".
Have a good day.
-------------------------------------
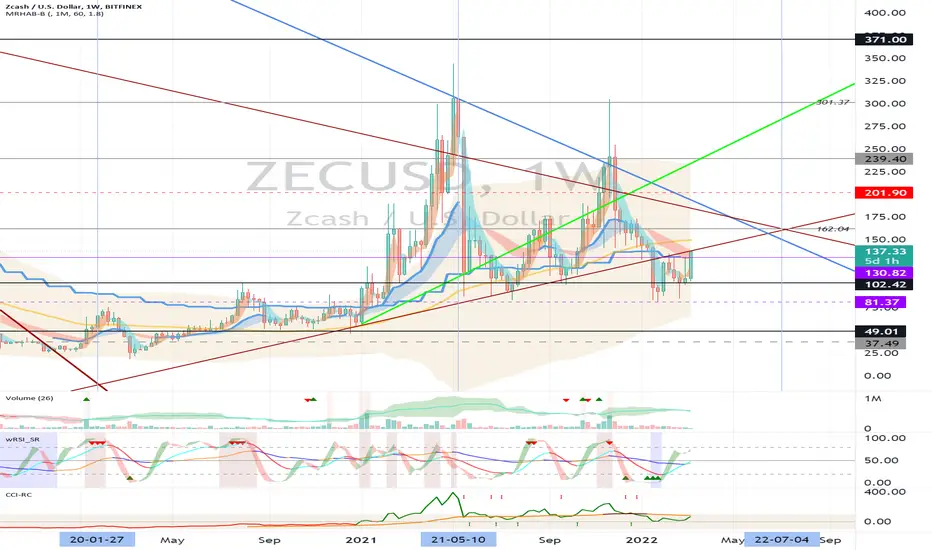
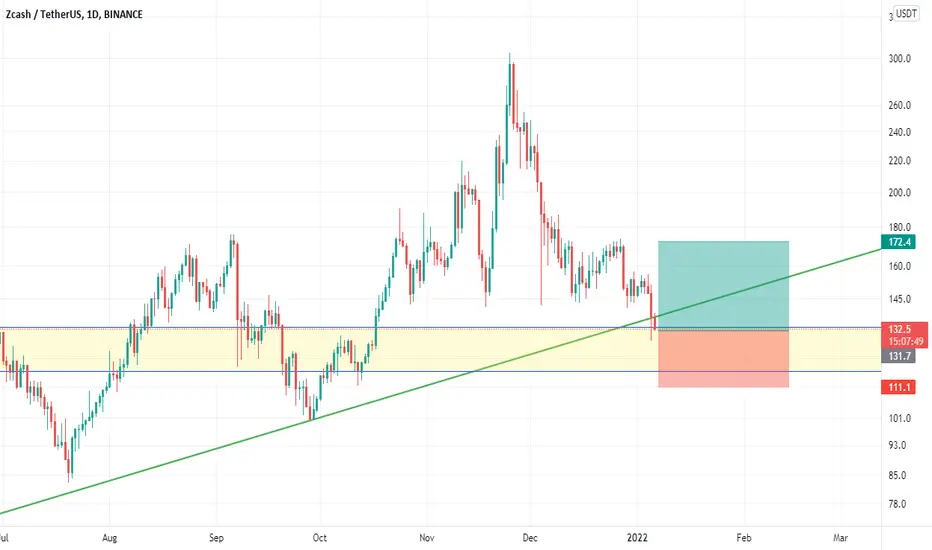
(ZECUSD 1W Chart)
If the price holds above the 130.82 point, it is expected to turn into an uptrend.
However, since the volume profile section is formed over the section 162.04-301.37, it is expected that the upward trend will accelerate when it is out of this section.
-----------------------------------------
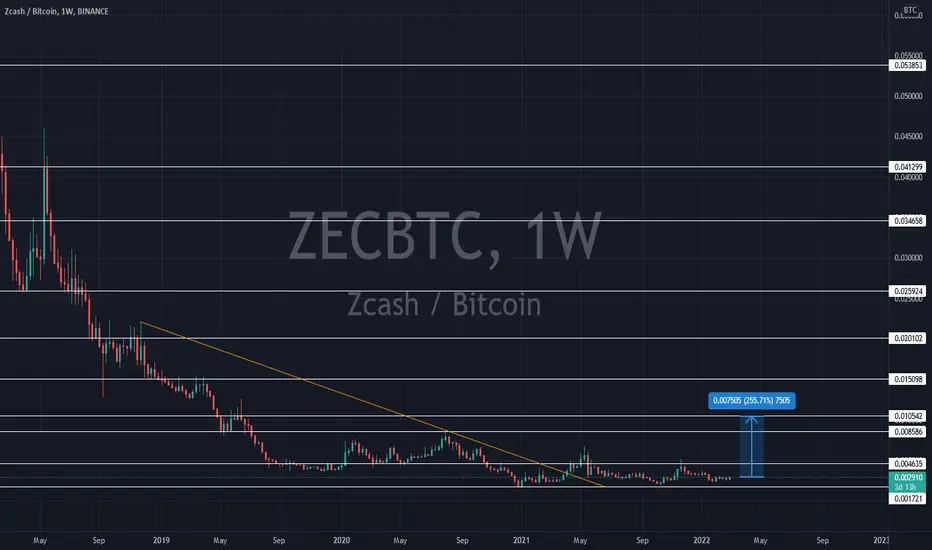
(ZECBTC 1W chart)
Above the 0.005954 point: Expect to create a new wave.
As it appears that the Bollinger Bands have entered the final convergence phase, we expect movement outside the range of 0.002058-0.004650 in the near future.
------------------------------------------
We recommend that you trade with your average unit price.
This is because, if the price is below your average unit price, whether the price trend is in an upward trend or a downward trend, there is a high possibility that you will not be able to get a big profit due to the psychological burden.
The center of all trading starts with the average unit price at which you start trading.
If you ignore this, you may be trading in the wrong direction.
Therefore, it is important to find a way to lower the average unit price and adjust the proportion of the investment, ultimately allowing the funds corresponding to the profits to be able to regenerate themselves.
------------------------------------------------------------ -------------------------------------------
** All indicators are lagging indicators.
Therefore, it is important to be aware that the indicator moves accordingly with the movement of price and volume.
However, for convenience, we are talking in reverse for the interpretation of the indicator.
** The MRHAB-O and MRHAB-B indicators used in the chart are indicators of our channel that have not been released yet.
(Since it was not disclosed, you can use this chart without any restrictions by sharing this chart and copying and pasting the indicators.)
** The wRSI_SR indicator is an indicator created by adding settings and options to the existing Stochastic RSI indicator.
Therefore, the interpretation is the same as the traditional Stochastic RSI indicator. (K, D line -> R, S line)
** The OBV indicator was re-created by applying a formula to the DepthHouse Trading indicator, an indicator disclosed by oh92. (Thanks for this.)
** Support or resistance is based on the closing price of the 1D chart.
** All descriptions are for reference only and do not guarantee a profit or loss in investment.
(Short-term Stop Loss can be said to be a point where profit and loss can be preserved or additional entry can be made through split trading. It is a short-term investment perspective.)
---------------------------------
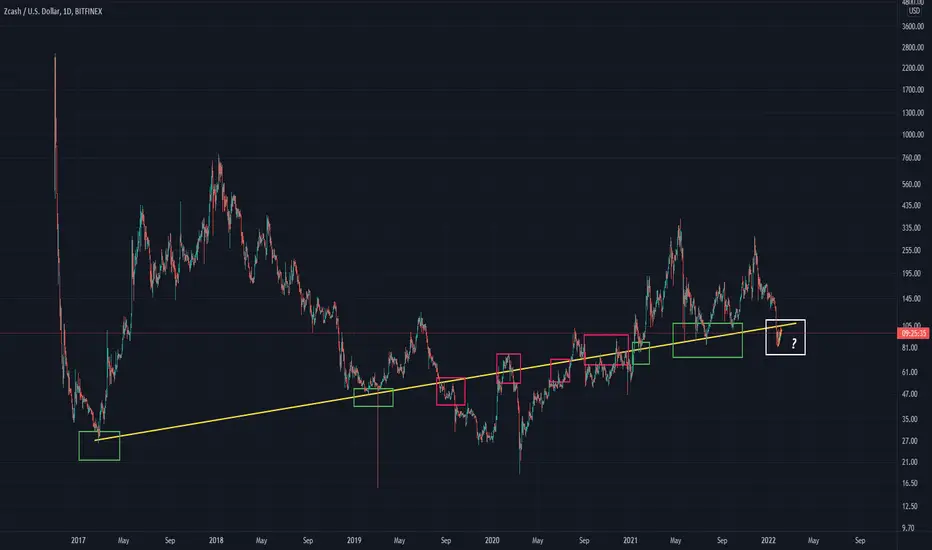
ZCASH LONG TERM TREND LINE ANALYSIS This yellow line has been very significant since 2017. For the most part, overtaking this yellow line leads to bullish action with exception to that fake out and capitulation we saw from the March 2020 Covid dump. In the green box we see where this line has acted like significant support and the red boxes display it acting as resistance. The last dump dumped us under the yellow line with no bounce, acknowledgement, or F's given about that line. We have seen a kind of weak bounce and have faced one rejection from that line since the dump. I personally think we have another dump ahead, especially with the pending crypto regulation coming from our well respected Statesman and Commander and Chief, Joseph Robinette Brandon Jr. Before every major move up in the market we first see a flash capitulation dump. If we see another leg down I will expect significant selling to come in and maybe then we will see the bounce. I suppose my bearish bias is bullish sign given how treacherous the marker has been. If we break the yellow line expect what looks like a bull trap then turn into a beartrap on a retest of that yellow line.
What are your thoughts?
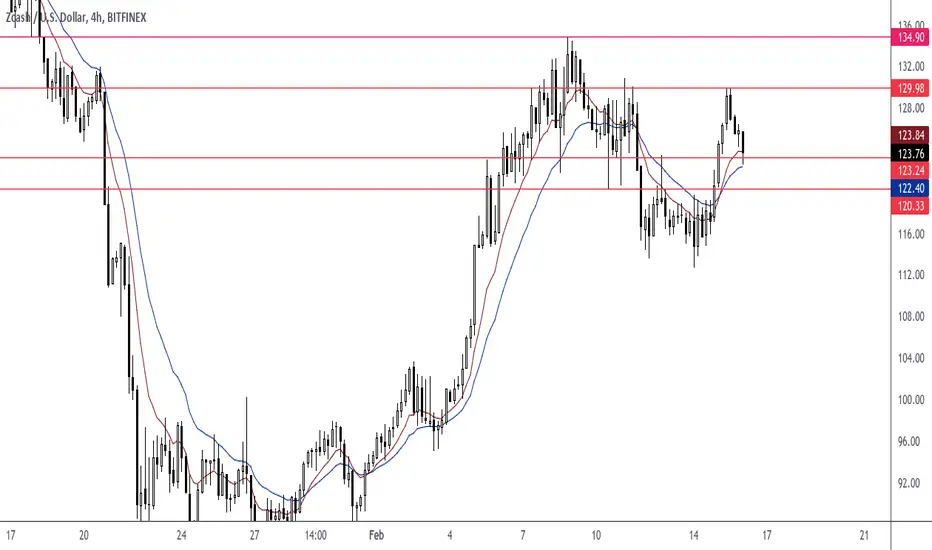
ZECUSD Target Price 134.90ZECUSD (Zcash) Cryptocurrency Market Is Bullish. Only enter long positions.
ZECUSDT - Bull flag pattern long positionZECUSDT Pair
The chart shows a bull flag pattern with a breakout and support retest.
For further continuation of growth, Bitcoin FLAT is also suitable for us!
Goals are indicated on the chart ☑️
Deal (SPOT) - Medium-term
ZECUSDT - Bull flag pattern long position

💡Don't miss the great buy opportunity in ZECUSD @ElectricCoinCoTrading suggestion:
". There is a possibility of temporary retracement to the suggested support line (118.5).
. if so, traders can set orders based on Price Action and expect to reach short-term targets."
Technical analysis:
. ZECUSD is in a range bound, and the beginning of an uptrend is expected.
. The price is above the 21-Day WEMA, which acts as a dynamic support.
. The RSI is at 70.
Take Profits:
TP1= @ 129.4
TP2= @ 134.7
TP3= @ 140.8
TP4= @ 145.5
TP5= @ 150.0
SL= Break below S2
❤️ If you find this helpful and want more FREE forecasts in TradingView
. . . . . Please show your support back,
. . . . . . . . Hit the 👍 LIKE button,
. . . . . . . . . . Drop some feedback below in the comment!
❤️ Your support is very much 🙏 appreciated!❤️
💎 Want us to help you become a better Forex / Crypto trader?
Now, It's your turn!
Be sure to leave a comment; let us know how you see this opportunity and forecast.
Trade well, ❤️
ForecastCity English Support Team ❤️

💡Don't miss the great buy opportunity in ZECUSD @ElectricCoinCoTrading suggestion:
". There is a possibility of temporary retracement to the suggested support line (118.5).
. if so, traders can set orders based on Price Action and expect to reach short-term targets."
Technical analysis:
. ZECUSD is in a range bound, and the beginning of an uptrend is expected.
. The price is above the 21-Day WEMA, which acts as a dynamic support.
. The RSI is at 69.
Take Profits:
TP1= @ 129.4
TP2= @ 134.7
TP3= @ 140.8
TP4= @ 145.5
TP5= @ 150.0
SL= Break below S2
❤️ If you find this helpful and want more FREE forecasts in TradingView
. . . . . Please show your support back,
. . . . . . . . Hit the 👍 LIKE button,
. . . . . . . . . . Drop some feedback below in the comment!
❤️ Your support is very much 🙏 appreciated! ❤️
💎 Want us to help you become a better Forex / Crypto trader ?
Now, It's your turn !
Be sure to leave a comment; let us know how you see this opportunity and forecast.
Trade well, ❤️
ForecastCity English Support Team ❤️

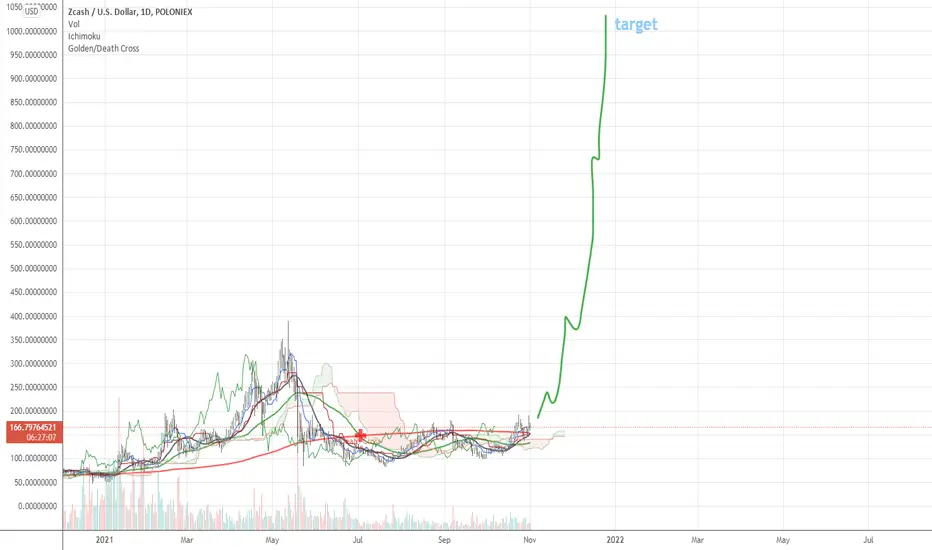
Zcash versus Dollars on the Pononiex Crypto Altcoin ExchangeSupply side will dry up when the Electric Coin Company confirms the conversion to Proof of Stake
Proof of Work miners will be triggered into Holding their coins in order to claim stakes in the future, rather than liquidating them on the market
Zcash will also roll-out an upgrade to Have Transaction Privacy by Default, transparency as an opt-in feature
Lastly the Breakthrough protocol upgrade to RZKSNARKS - Recursive Zero-Knowledge Succinct Non-Interactive Argument(s) of Knowledge
3,550 new zcash emitted daily, inflation by % is 11, inflated global 24-hour volume remains near 250-400 million dollars
the current circulating supply is 11.7 million ZEC, by the end of the year it will be 12 million
Price Target is $990 to $1770 within 90 days
Zcash | take eyes on it and wait for herif you use it on spot , you dont need to worry about that stoploss , because the target I showed you is where price must go even if she willing to fall into the hell after

Zcash will Crashhhhhhhhhhh ZEC Looking at the Chart is obvious Zec is in Trouble
Not a Financial advice
ZECUSD Bouncing on Structural SupportMarket structure is the enduring shape of a market through multiple cycles (major trends).
This particular structure was formed by bottoms in the first major bull trend of ZEC in 07/17 and 09/17.
It was then reinforced through tops in the first major bear trend of ZEC in 06/19 and 08/20 forming a two-year accumulation zone.
It has now been used as bottoms again in 05 /21, 06/21, and 07/21.
It has been revisited as a bottom now 01 /22.

ZEC/USDT UPDATE:This level is getting tested like crazy and it will break eventually.
Break + retest --> entry LONG
TP: Supply zone + nVPOC downtrend.

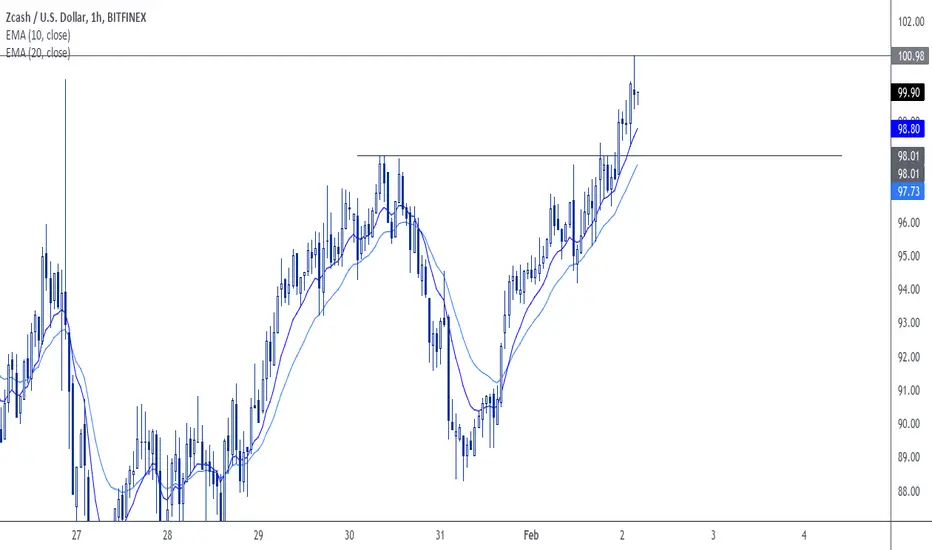
ZECUSD Target Price 100.98Price closed above 98.01. Watch for a buying opportunity near the 98.01 price area.
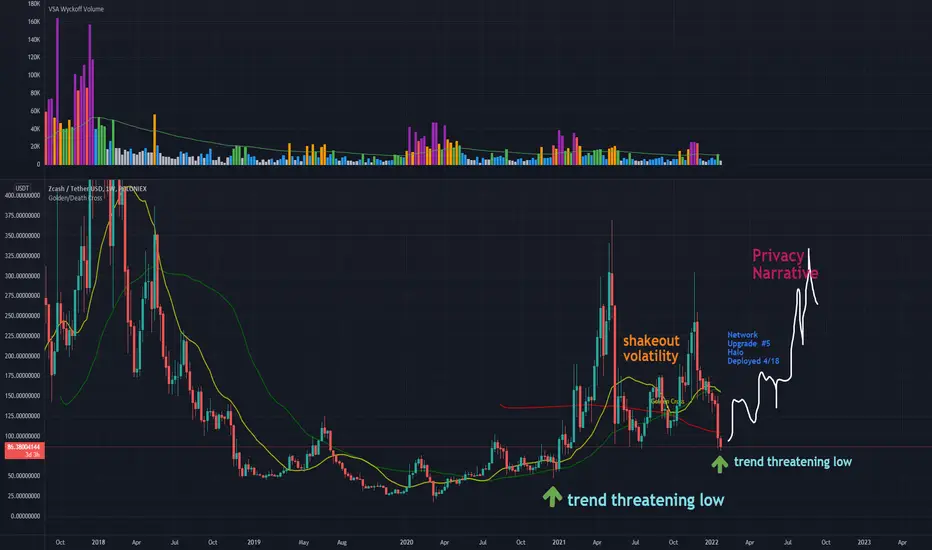
Privacy Narrative 2022 Zcash Defends against Threatening LowAll upward price potential for ZEC-USD is predicating on Bitcoin reversing off of the low $30,000 area and then making another ATH rally in spring and summer of 2022
Barry Silbert remains in Zcash
Electric Coin Company has a committment to Deliver the Network Upgrade in Mid-April
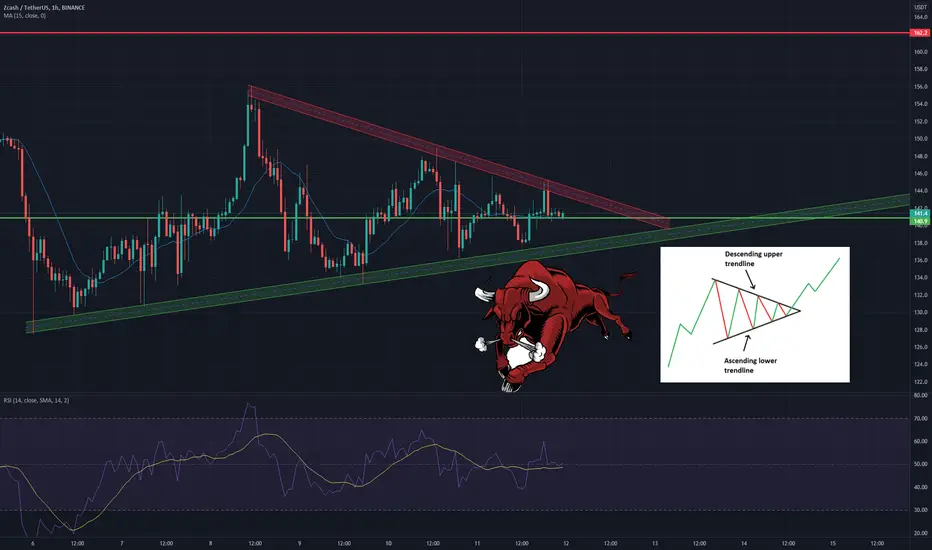
ZEC DESCENDING UPPER TRIANGLE PATTERN!Hi! this is my ZEC/USDT IDEA
I got a feeling we will see a breakout soonl.
Hope you will like it! if
you have any feedback about the chart pls feel free to tell me:)
MY IDEA ONLY NOT A FINANCIAL ADVICE!!!
Love Yall :)
Zcash (ZEC) Analysis Updated 07/03/2021this is an update of Zcash Analysis which we did on 01/02/2021
as we can see our Hidden Bullish Divergence Implemented, price made a rally and higher high, touched the TP Zone Green Box, where we had our 161.8% level Fibonacci projection Triggered.
price corrected itself and retraced down to the past ATH and Top of our Ascending Channel, so we got our confirmation for the 261.8% level of the same Fibonacci Projection, which is our new higher TP (250USD)
as of now we have total of 3 targets where the 1 TP is the 161.8% of the same Fibonacci Projection where it is very obvious and 2 TP is also well confirmed now.
we can target the 3 TP (315USD), after a retracement from 2TP or if the Bull pressure was high, we can simply Trill our Stop Loss and target our ultimate Target.
i have linked the previews analysis too.

spot & hold ZECevery time such as a crocodile buy cheep
and hold.
now our strategy in 2022 is SPOT.
we buy ZEC/USDT for 30% profit
ZECUSDT Triangle formation!ZECUSDT (1H Chart) Technical analysis update
ZEC/USDT currently trading at $153.9
zec forming symmetric triangle in 1h chart, if triangle breakout we can expect up move in zec.
Buy level: Above 154.5 (only buy after symmetric triangle breakout
TP 1: $158
TP 2: $163
TP 3: $170
TP 4: $180
Stop loss:$146
Max Leverage: 2x

lONG ZECASH Price action is resting at the bottom of a strong level of demand . Slight signs of seller weakness on the RSI off of these lows
Low risk entry at this zone !

ZECUSDT is ready to MOVE UP !💎 ZECUSDT / 4H 💎
we have a Good Support zone in 4H time Frame , also we have Good news on RSI indicator !
we can see a possible bounce from here !