ZEC Holding Support Nicely. Target 40%Thought this is not a breakout but long boys can get into this early before the crowd gets in at the breakout. Breakout is at $245.4
ZECUSD

ZECUSD H16: XABCD 75% gains BEST LEVEL TO BUY(SL/TP)(NEW)Why get subbed to me on Tradingview?
-TOP author on TradingView
-2000+ ideas published
-15+ years experience in markets
-Professional chart break downs
-Supply/Demand Zones
-TD9 counts / combo review
-Key S/R levels
-No junk on my charts
-Frequent updates
-Covering FX/crypto/US stocks
-before/after analysis
-24/7 uptime so constant updates
🎁Please hit the like button and
🎁Leave a comment to support our team!
ZECUSD H16: XABCD 75% gains BEST LEVEL TO BUY(SL/TP)(NEW)
IMPORTANT NOTE: speculative setup. do your own
due dill. use STOP LOSS. don't overleverage.
🔸 Summary and potential trade setup
::: ZECUSD 16hours/candle chart review
::: XABCD setup in progress
::: currently ACCUMULATION MODE
::: BULLS reload low near point C
::: BUY/ACCUMULATE near market
::: strong bullish chart
::: up to 75% gains possible later
::: short-term pullback possible
::: bulls wait for pullback
::: SPECULATIVE SETUP
::: do your own due dill
::: and use proper risk management
::: TP bulls is +75% gains
::: details: see chart
::: FINAL TP is +75%
::: recommended strategy: BUY/HOLD after correction
::: best entry near C
::: TP BULLS +75% gains
::: SWING TRADE: BUY/HOLD IT
::: bull run not over yet
::: good luck traders!
::: BUY/HOLD and get paid. period.
🔸 Supply/Demand Zones
::: N/A
::: N/A
🔸 Other noteworthy technicals/fundies
::: TD9 /Combo update: N/A
::: Sentiment mid-term: BULLS
::: Sentiment short-term: BULLS
RISK DISCLAIMER:
Trading Crypto, Futures , Forex, CFDs and Stocks involves a risk of loss.
Please consider carefully if such trading is appropriate for you.
Past performance is not indicative of future results.
Always limit your leverage and use tight stop loss.

Scalp ZECUSDT - Ascending TriangleType of Breakout: Ascending Triangle
EP TP SL on Chart.
Buy some on Market and buy on retest of breakout line.

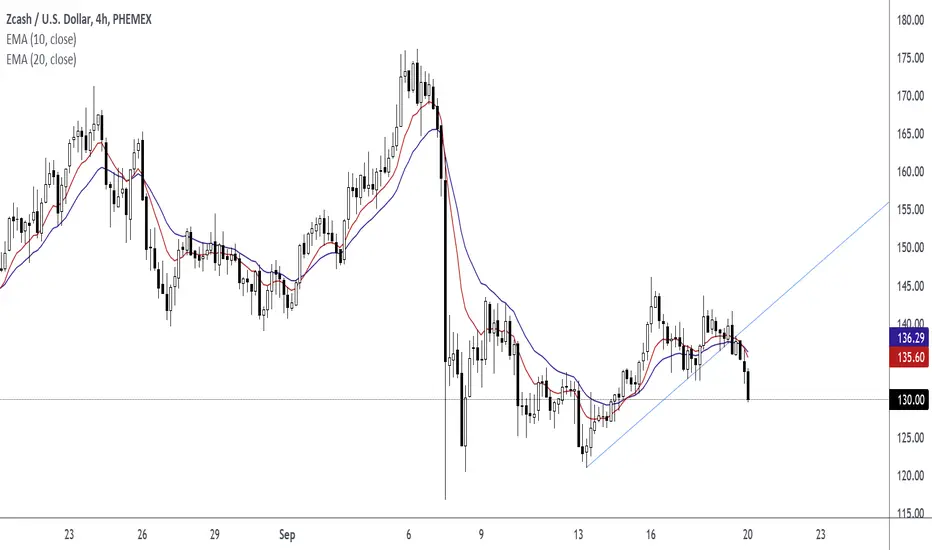
ZECUSD. Wait For The Next Pull Back For A Long Entry.ZECUSD (Zcash). Watch Zcash for another pull back to the EMA 10, EMA 20, and Fibonacci Retracement Level.
Measured Move and Measured Objective
Horizontal Support and Resistance Level
Reward Risk Ratio

imagine ZCASH upside when it gets a decent run above 50 rsizcash seems to have always pumped wit the rsi low.
the last push up to 300+ popped momentarily above 50 before dropping back below and forming a mild bullish divergence on the monthly
the orange trend line heading up suggest this is just the start of a big run, and breaking up from the wedge would confirm that.
price currently stagnates on the 20ma mid bband, is it privacy coins time?

Zec slowly risingA long term trade could be taken on ZEC/USDT with huge 18 R/R
Trade could be triggered any day soon

ZECUSDTHi everyone,
This is my description:
Blue Lines: Resistance (Target for sell)
Orange Lines: Support (Step for buy)
Pink Rectangle: PRZ
Thanks for your attention.

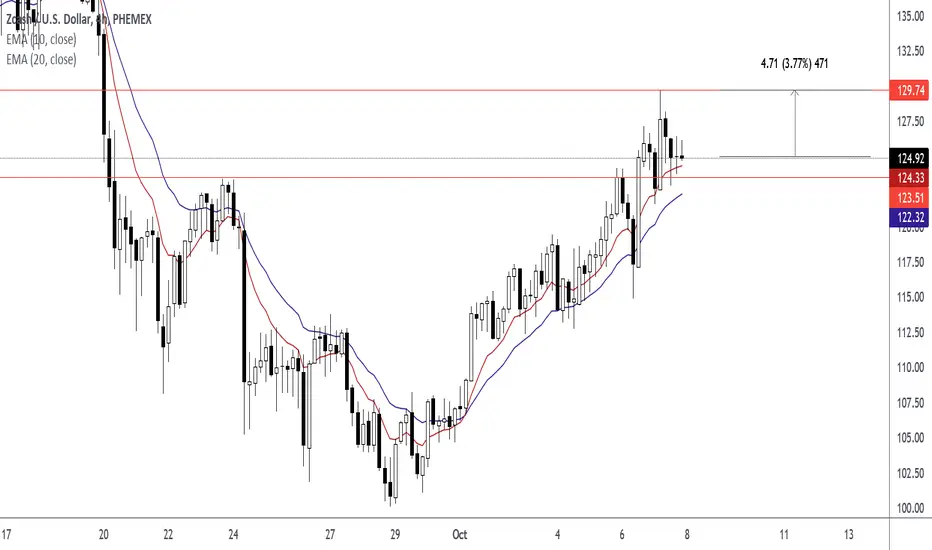
ZECUSD Entry Price 125.03 Target Price 129.74ZECUSD (ZCASH)
High Price 126.44
Open Price 125.01
Close Price 125.03
EMA 10 Close Price 124.20
--------------------------------------
Low Price 123.80
EMA 20 Price 122.05
--------------------------------------
Set Your Stop Loss Below 123.80
Set Your Stop Loss Below 122.05
---------------------------------------
Enter Two Trades. Two Entries with the same target with two different stop losses.
ZECUSD ZCASH Entry At The Exponential Moving Average (H4 Chart)ZECUSD (Zcash). Pin Bar Trading Strategy Using EMA 10, EMA 20, Trend Line, and Momentum. Action: Wait For Price To Pull Back And Form A Rejection Candlestick At The EMA 10 EMA 20. (H4 Chart)
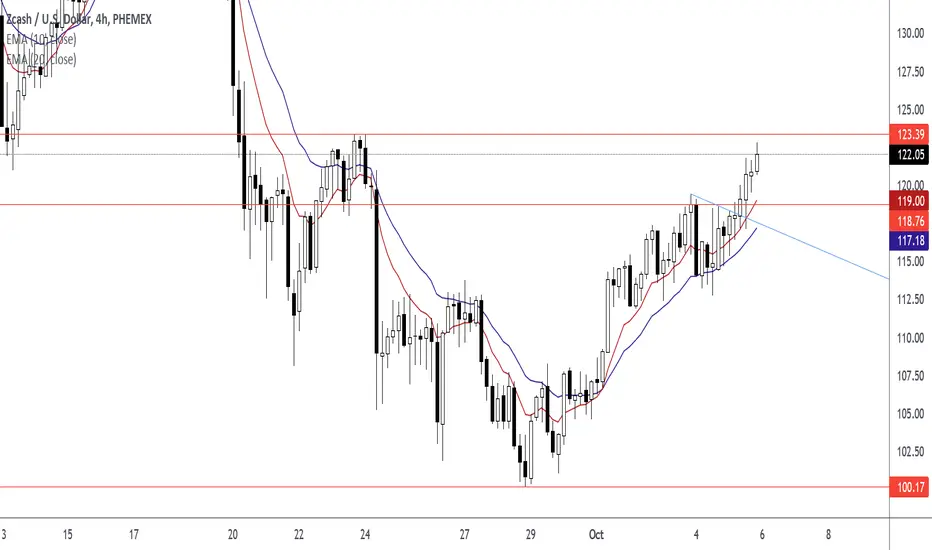
ZECUSD ZCASH Entry At The Exponential Moving Average ZECUSD (Zcash). Pin Bar Trading Strategy Using EMA 10, EMA 20, Trend Line, and Momentum. Action: Wait For Price To Pull Back And Form A Rejection Candlestick At The EMA 10 EMA 20.

ZEC/USDTZec is out of bearish trendline.
Volume is growing, break looks good.
You can pul SL below low on 95USD or you can take second entry on the main POC level.
ZEC/BTC - on chart with BTC is still in consolidation. When comes bitcoin to the consolidation, then ZEC should go up faster.

Privacy decadePrivacy coins will have their time in coming years (XMR, ZEC). Control is getting more and more disqusting, that people are forced to seek freedom.
See you at $1000+

ZECUSD | Watch For Short OpportunitiesZECUSD. Watch for a pull back to the exponential moving averages for a short opportunity.
ZEC/USD - Livermore Accumulation CylinderPossible Livermore Accumulation Cylinder can be seen on chart of Zcash (and some others alts, btw).
Already made similar idea with Fib circles, but didn't know, that it is called that way :
Also, chart vs BTC shows consolidation and attempts to break downtrend line :

ZECappears to be still correcting but only a matter of time b4 this beast starts pushing back above $200 IMO.
A look at what's happening with ZEC-BTC in the short termHead and shoulders? Or will we break macro resistance?

ZEC/USD - buy it nowZEC in near future :
1) Fast and secure money transfer (already exists)
2) Blockhain for anonymous transfer other currency (BTC,ETC....)
3) Anonymous messanger
ZCash is true cryptocurrency.
Fib Channel is also useful :

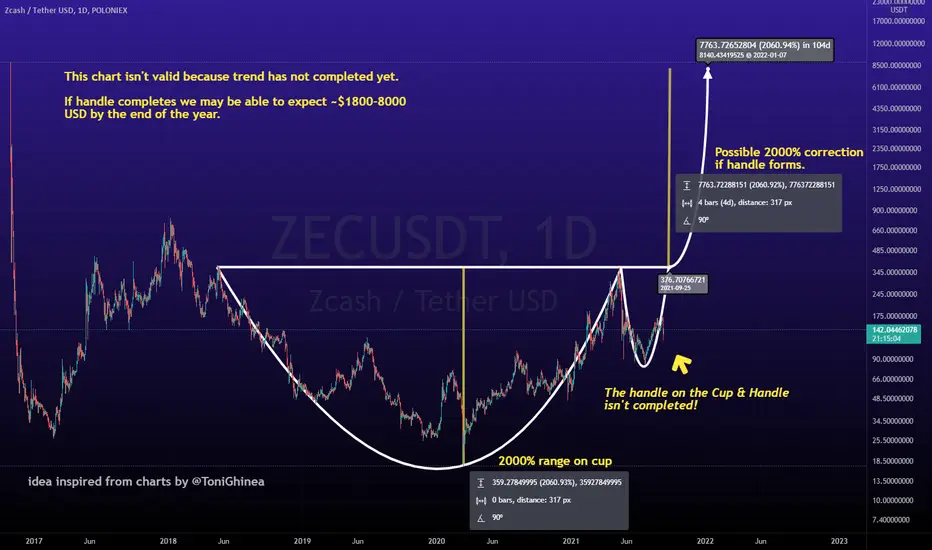
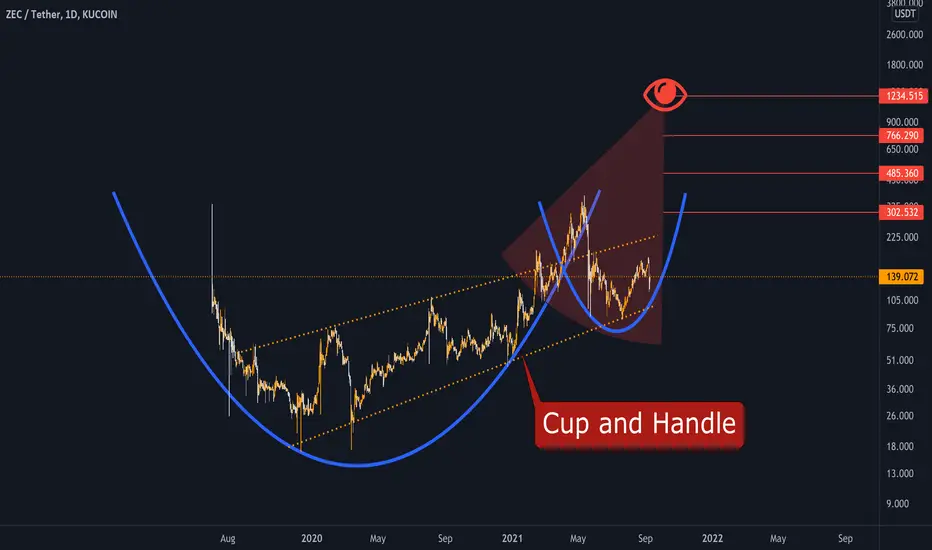
Possible Cup and Handle Forming on the Macro Viewinspired by charts made by twitter user @ToniGhinea
Zcash is preparing for a big UPMOVE!people seem to have forgotten privacy coins. Focusing on all kinds of short term coins, instead of real value
$ZEC is one of them and the big boys (Grayscale) are buying a ton of it
Wonder why..Thinking face
MY MINIMALIST CHART ANALYSIS FOR $ZEC9.6.21
My Minimalist Analysis of $ZEC
Indicated are key levels of support and resistance using small and large range boxes TO ENTER A SWING TRADE (Short - Long).
Watch out for patterns, EMA, and your Fibs.
Further Analysis on price action is required on a 1HR-4HR chart when entering or closing a trade, depending on your risk appetite and trading style.
Disclaimer: The findings/predictions of the following analysis are the sole opinions of the publisher of this idea and must not be taken as investment advice.
If you like my published ideas and for more daily analysis, you can support my work by pressing the like and follow buttons on Trading View and Etoro Platforms.
Thank You for your appreciation and support.
tradingview.sweetlogin.com
etoro.tw

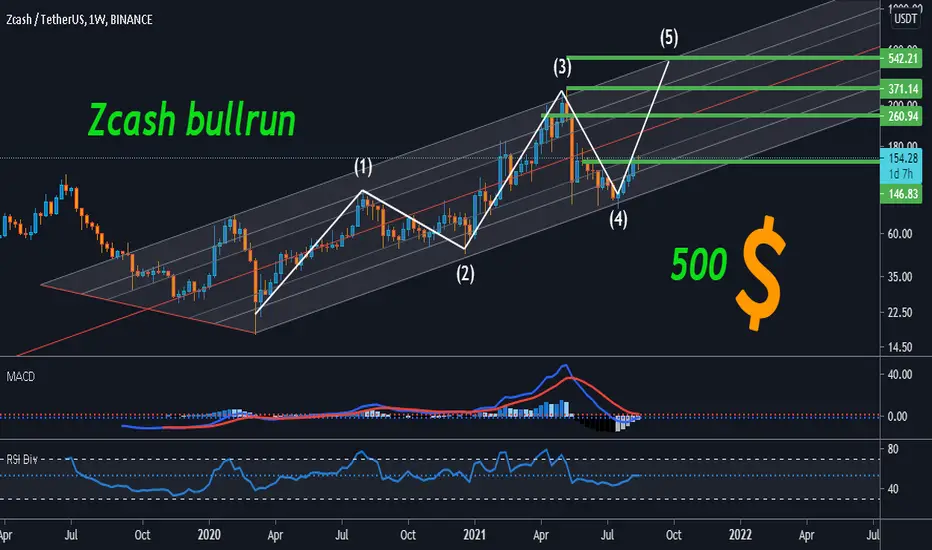
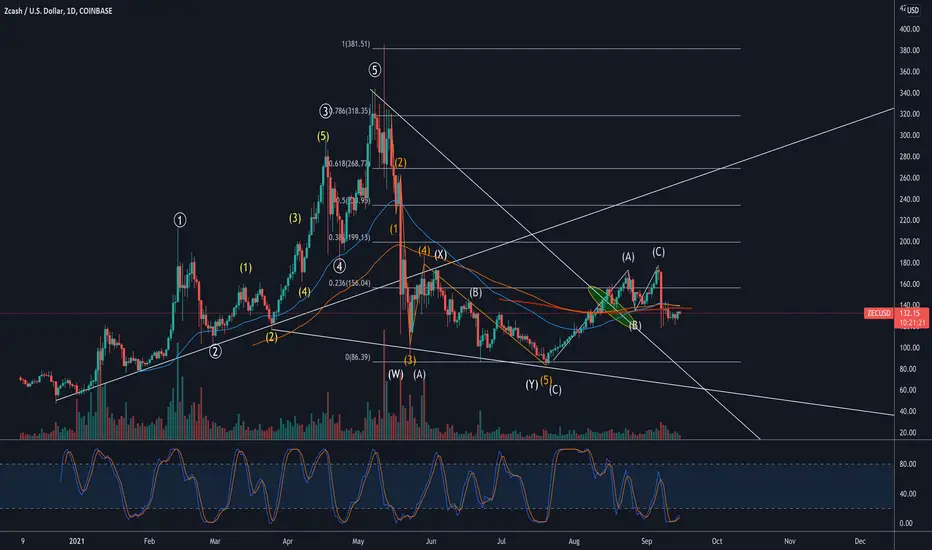
ZEC is the best !According to the Elliott waves shown in the figure above, the lovely #ZEC is at the beginning of a bull run. The fifth wave will end at the $ 500 target.
Buy this currency in Spot.