ZEN/BTC (Retest Recent Low Support?)BINANCE: ZENBTC
-Horizen tested the previous swing low at 5560 sat range
-We saw a good bounce but currently faces rejection by the trendline resistance
-If ZEN will pullback, it will likely to retest the recent low and form a double bottom
-A double bottom reversal will only confirm if the trendline resistance is broken up
-This will take a few days so please be patient and wait for a safer entry
-The ideal stop loss is placed under the green support line
-And the upside potential is up to the recent swing top at 9953 sat
^Trading involves High Risk
^Not Financial Advice
^Please exercise Risk Management
**If you like my daily Published Ideas
**A little help by supporting my Channel
**Through leaving a Thumbs Up, Comment & Follow
**Happy Trading! --> Thank you! :)
ZENETH

ZEN/BTC (Testing Key Resistance Top)ZEN/BTC
-Horizen is currently trying to retest the recent top at 10k sat
-It is crucial to buy at current market price
-Because we don't know if ZEN can break this resistance area
-I recommend waiting for the breakout confirmation
-That will give us a strong bias that the uptrend is valid
-You can either enter on breakout or retest (pullback)
-Upside scenario is up to 14k sat to 19k sat range

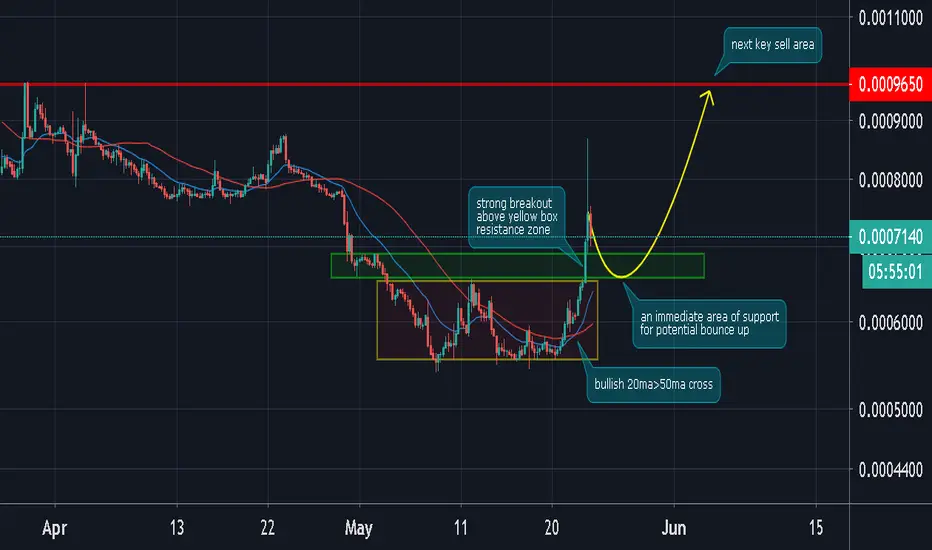
ZEN/BTC (Pullback Correction?)ZEN/BTC
-strong push up after breaking the yellow box resist
-we need to pullback to confirm old resist turn new support
-key areas to watch is between 6900-6500
-if we see rejection at this area of support
-it is likely we will see another leg up to test the next high
-target potential upside is 9650s

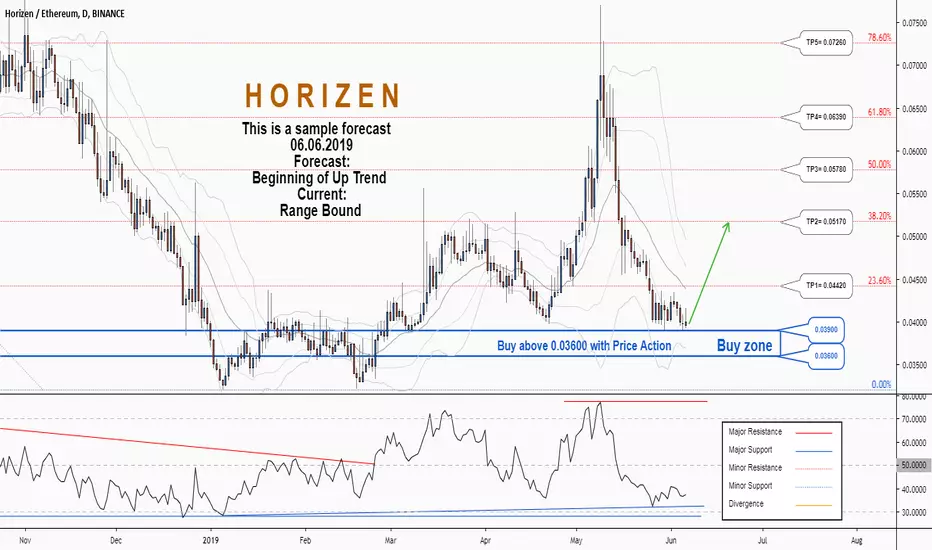
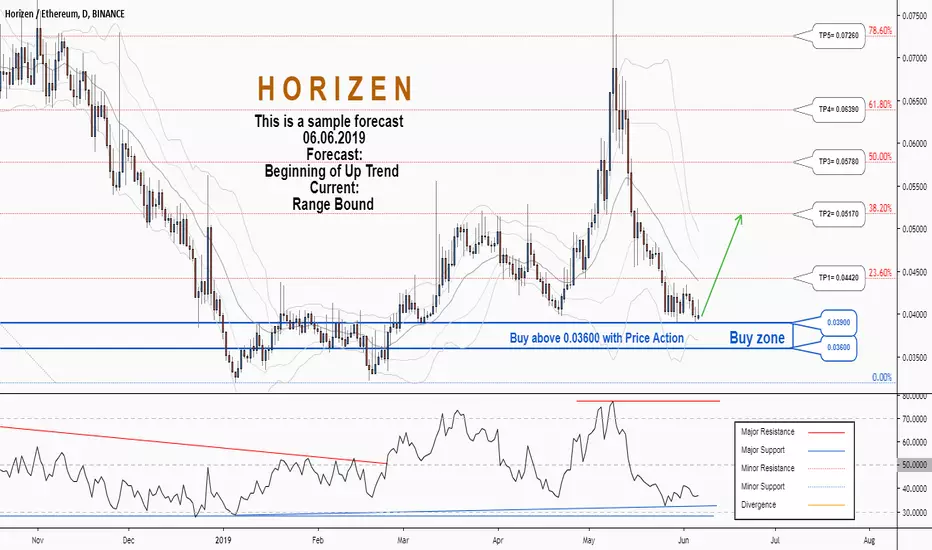
There is a possibility for the beginning of an uptrend in ZENETHTechnical analysis:
. Horizen/Ethereum is in a range bound and the beginning of uptrend is expected.
. The price is below the 21-Day WEMA which acts as a dynamic resistance.
. The RSI is at 37.
Trading suggestion:
. There is a possibility of temporary retracement to suggested support zone (0.03900 to 0.03600). if so, traders can set orders based on Price Action and expect to reach short-term targets.
Beginning of entry zone (0.03900)
Ending of entry zone (0.03600)
Entry signal:
Signal to enter the market occurs when the price comes to " Buy zone " then forms one of the reversal patterns, whether " Bullish Engulfing ", " Hammer " or " Valley " in other words,
NO entry signal when the price comes to the zone BUT after any of the reversal patterns is formed in the zone.
To learn more about " Entry signal " and the special version of our " Price Action " strategy FOLLOW our lessons:
Take Profits:
TP1= @ 0.04420
TP2= @ 0.05170
TP3= @ 0.05780
TP4= @ 0.06390
TP5= @ 0.07260
TP6= @ 0.08360
TP7= Free
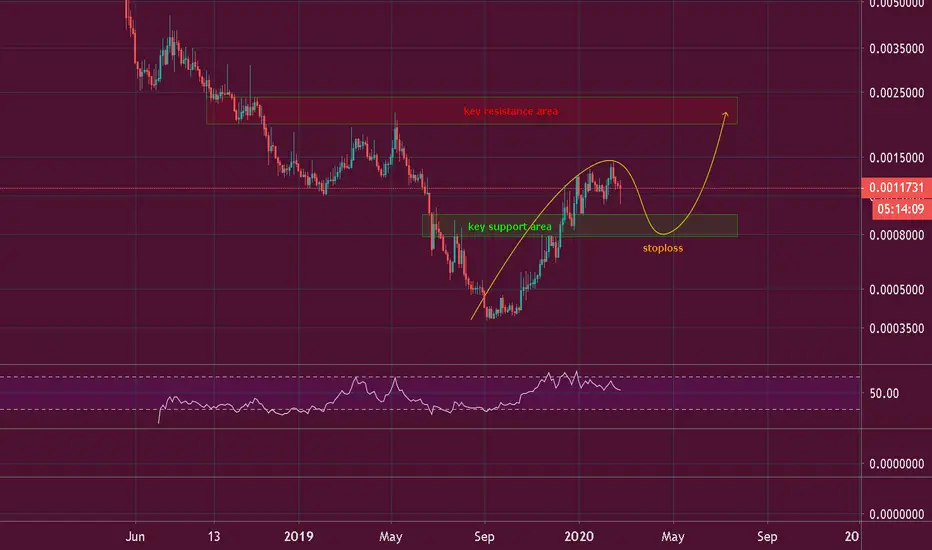
ZENBTCZENBTC is now above a significant pivot. If consolidation maintains bullish structure here I expect an ultimate target of 0.002375. Clear invalidation under pivot with daily closes below 0.001500.
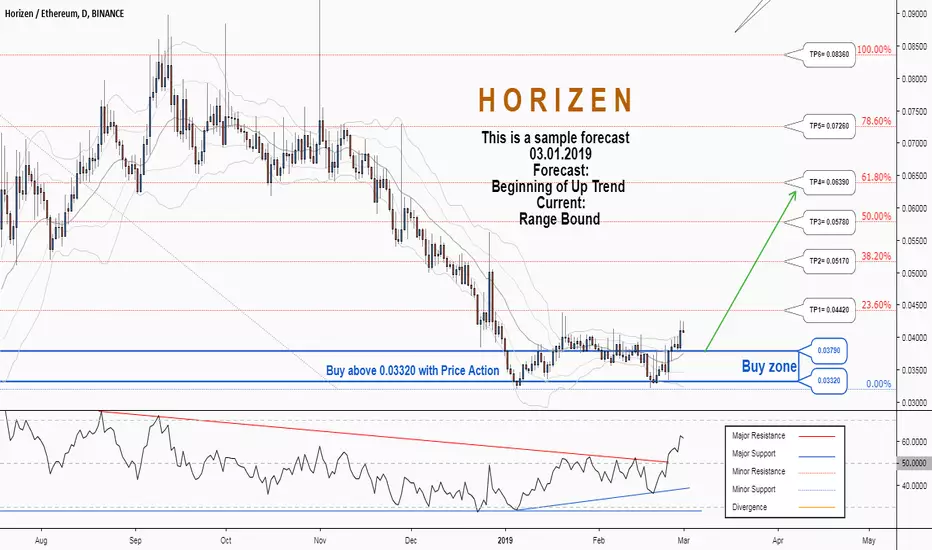
There is a possibility for the beginning of an uptrend in ZENETHTechnical analysis:
. HORIZEN/ETHEREUM is in a range bound and the beginning of uptrend is expected.
. The price is above the 21-Day WEMA which acts as a dynamic support.
. The RSI is at 62.
Trading suggestion:
. There is a possibility of temporary retracement to suggested support zone (0.03790 to 0.03320). if so, traders can set orders based on Price Action and expect to reach short-term targets.
Beginning of entry zone (0.03790)
Ending of entry zone (0.03320)
Entry signal:
Signal to enter the market occurs when the price comes to " Buy zone " then forms one of the reversal patterns, whether " Bullish Engulfing ", " Hammer " or " Valley " in other words,
NO entry signal when the price comes to the zone BUT after any of the reversal patterns is formed in the zone.
To learn more about " Entry signal " and the special version of our " Price Action " strategy FOLLOW our lessons:
Take Profits:
TP1= @ 0.04420
TP2= @ 0.05170
TP3= @ 0.05780
TP4= @ 0.06390
TP5= @ 0.07260
TP6= @ 0.08360
TP7= Free