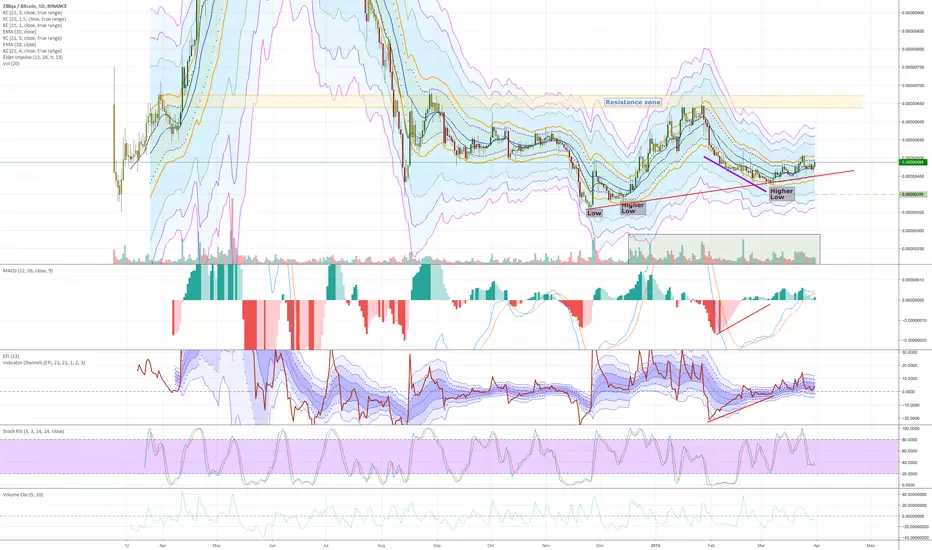
Zilliqua new uptrend ZILBTC
This is an interesting chart at the moment. We did see a price decline after hitting the resistance, generally with declining volume during this price decline.
It kept on going and formed a bottom, much higher then the previous bottom. I consider this as a rejection to go lower, together with the bullish missing-right-shoulder divergence on MACD-H and on Elder Force Index.
This is a Higher Low and possibly the beginning of a new uptrend for Zilliqa.
The amount of volume has risen the end of the year 2018. And now with this pattern forming, I consider this a a longer term swing trade, and valid up to the resistance zone
That would be a nice time to take profits and decide to see if it is strong enough to reenter or even stay in it.
Elder Impulse is green on the daily chart.
Price is around the EMA, so a good place to enter would be here, or a bit lower. A study of the 4H or 1H chart will help me to place a good entry.
I put my SL way below the previous higher low, on the current minus 3 ATR channel line.
I consider this trade interesting, as the reistance zone is around 62-64. That means a Risk Reward ratio of 1:2.
SL: 399
If you’re interested to get a signal right away on your Telegram, please consider my free signal channel on t.me
ZILBTC
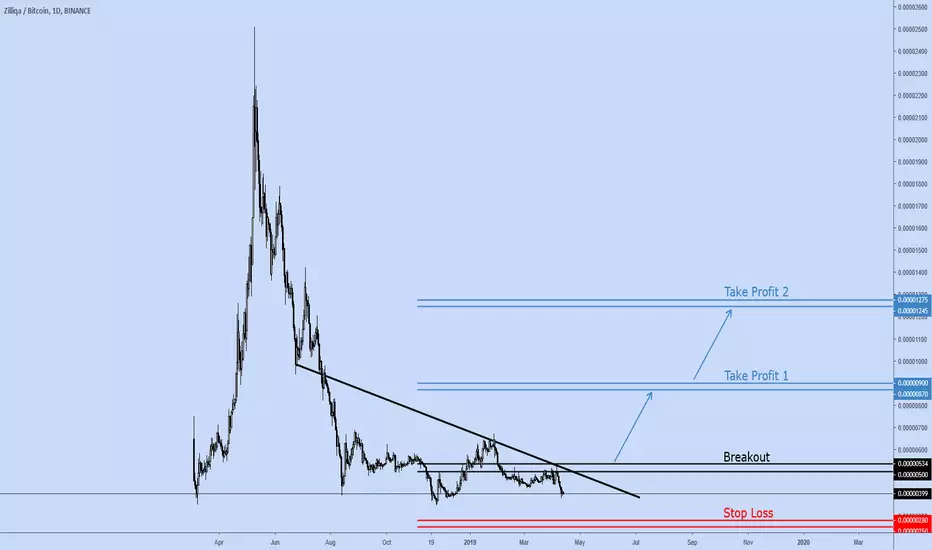
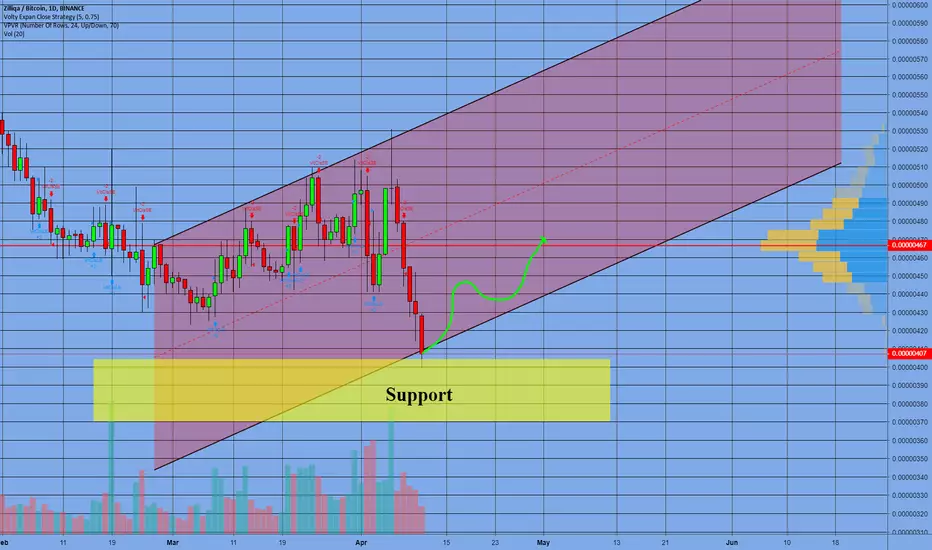
ZIL/BTC Long-Term-Price is in supportive zone
-Reduction in the slope of down trend
-After the breakout of specific black zone & down trend-line, the trend will change to bullish
Suggestive Position
- Entry=Trigger (according to trading strategy)
- Stop-loss=0.00000250-0.00000280
- Take Profit 1 =0.00000870-0.00000900
- Take Profit 2 =0.00001245-0.00001275
- Reward/Risk= 1.5
ZIL/BTC - Ready for 15% profit?BINANCE:ZILBTC Buy 380-400 Sell 445-460 This is my opinion only! DYOR
Ziliqa ZIL/BTCZiliqa Bitcoin Binance
clear divergence on daily
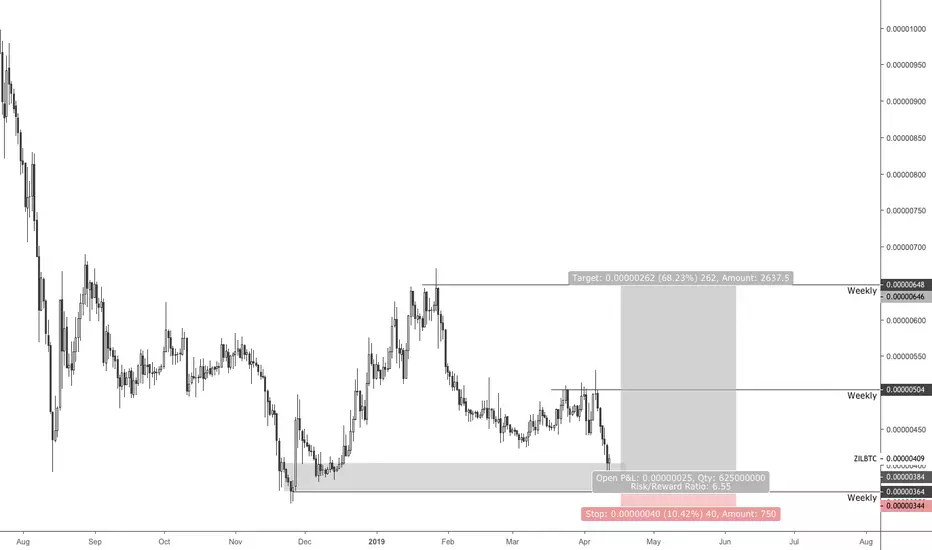
ZIL/BTC
PP: 452 s@
Tp1 670 R/R 2
Tp2 870 R/R 11.5
SL: 415 s@
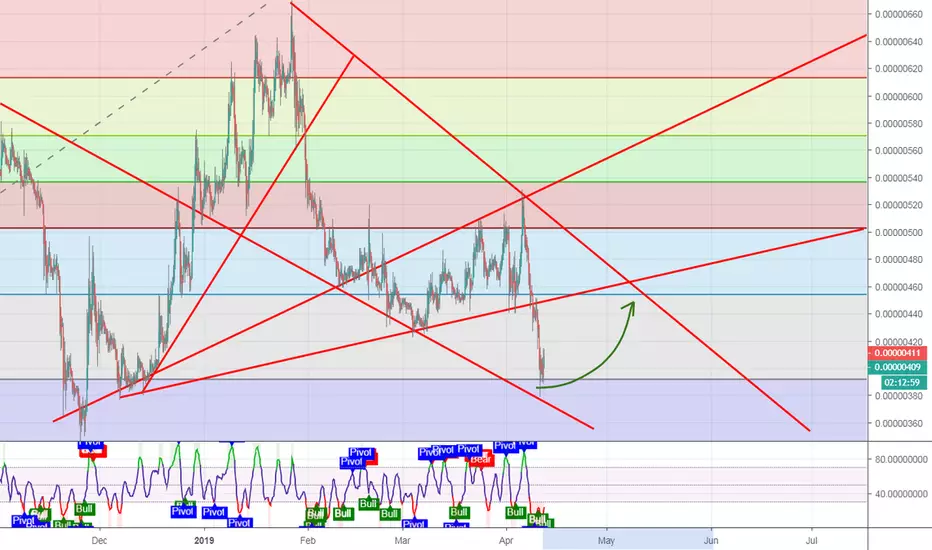
#Zilliqa BTC Sweet price
Now to the cue ball on the current well rolled back the project
The project is working, with a good team, with a dense set of news, I recommend buying it for the current.
#ZILBTC #ZIL $BTC UPDATE ON 30 MINPlease follow the triangle and big surprise is very soon :)
Please push the like button and follow me please Thank you
Ucgen kirilimini takip edin kirip yukari cikarsa uzariz :))))
LÜtfen like butonuna basisn ve takibe alin. Ayrica sosyal mediadan da takibe aliniz.
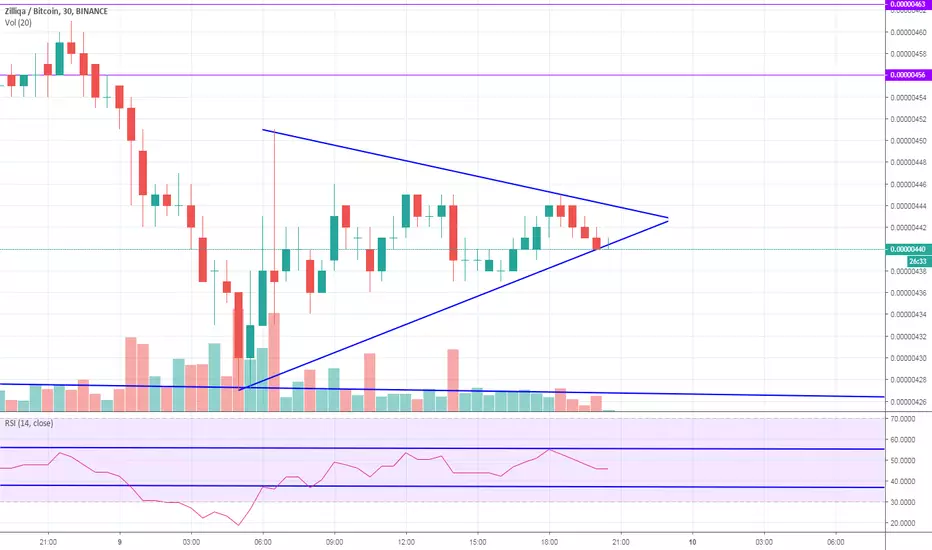

#ZILBTC #ZIL UPDATEPlease follow the triangle and big surprise is very soon :)
Please push the like button and follow me please
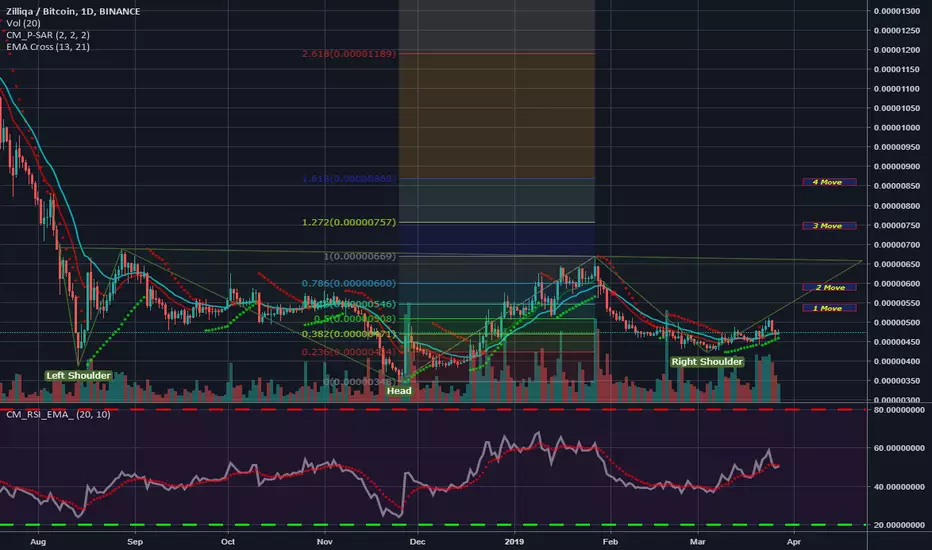
ZIL please do somethingZIL is moving to the rhythm of potential reversal head and shoulders pattern. All that we need is smash that resistance in to pieces. Possible targets on the chart.
ZLBTC ... Wants to break downI got many requests about ZIL in some groups.
I've decided to share my TA for long term.
This chart in my personal opinion is very perfectible and easy to read.
After and Extended wave 5 ZIL made a very big correction ...
Breaking even the top of the wave 1 that is very bearish for me ...
After C made a symetrical triangle same as BTC from 6k to 3K and broke down .
Now Zil if forming a potential symmetrical triangle again doing ABCDE
but there a lot of resistance EMAs are acting as very good resistance and Weekly Stoch is going down.
I don't see good support to go upside for making C wave.
If btc breaks down I am pretty sure ZIL will break down going lower .
I would be very careful with this coin.

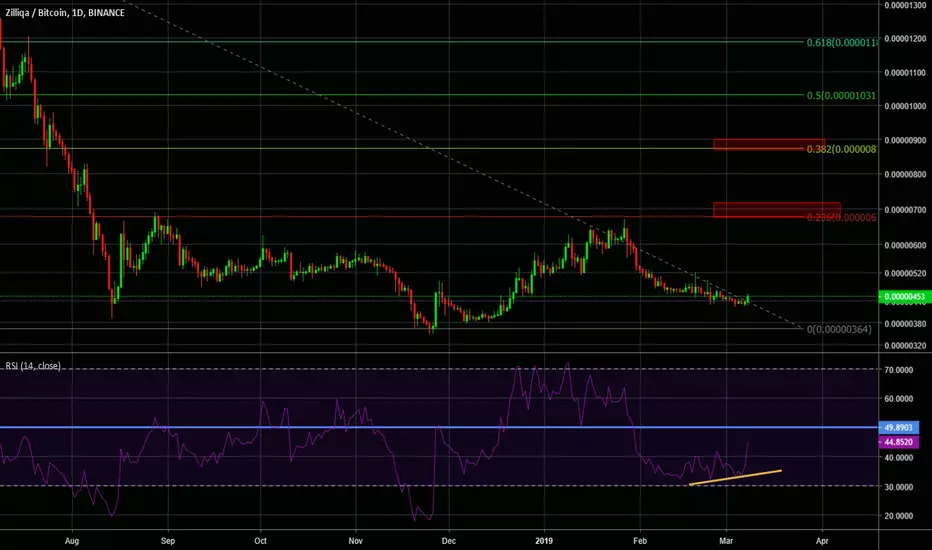
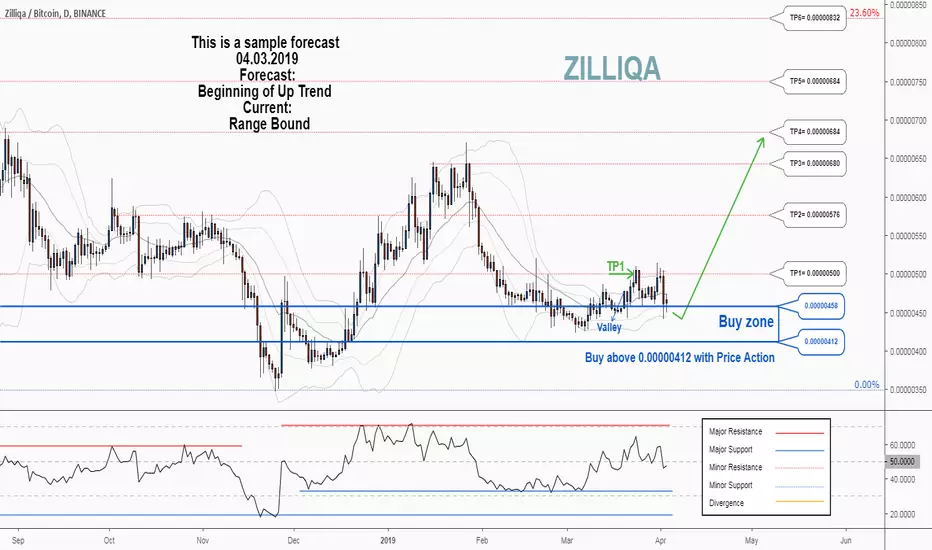
There is a possibility for the beginning of an uptrend in ZILBTCTechnical analysis:
. ZILLIQA/BITCOIN is in a range bound and the beginning of uptrend is expected.
. The price is below the 21-Day WEMA which acts as a dynamic resistance.
. The RSI is at 51.
Trading suggestion:
. There is a possibility of temporary retracement to suggested support zone (0.00000458 to 0.00000412). if so, traders can set orders based on Price Action and expect to reach short-term targets.
Beginning of entry zone (0.00000458)
Ending of entry zone (0.00000412)
Entry signal:
Signal to enter the market occurs when the price comes to " Buy zone " then forms one of the reversal patterns, whether " Bullish Engulfing ", " Hammer " or " Valley " in other words, NO entry signal when the price comes to the zone BUT after any of reversal patterns is formed in the zone. To learn more about " Entry signal " and the special version of our " Price Action " strategy FOLLOW our lessons :
Take Profits:
TP1= @ 0.00000500
TP2= @ 0.00000576
TP3= @ 0.00000680
TP4= @ 0.00000684
TP5= @ 0.00000684
TP6= @ 0.00000832
TP7= @ 0.00000960
TP8= @ 0.00001130
TP9= @ 0.00001370
TP10= @ 0.00001610
TP11= @ 0.00001955
TP12= @ 0.00002393
TP13= Free

ZIL 4hReally good place for buy ZIL
Over trend line also support line. We can see nice uptrend from here.
Stop under trend line
There is a possibility for the beginning of an uptrend in ZILBTCTechnical analysis:
. ZILLIQA/BITCOIN is in a range bound and the beginning of uptrend is expected.
. The price is below the 21-Day WEMA which acts as a dynamic resistance.
. The RSI is at 47.
Trading suggestion:
. There is a possibility of temporary retracement to suggested support zone (0.00000458 to 0.00000412). if so, traders can set orders based on Price Action and expect to reach short-term targets.
Beginning of entry zone (0.00000458)
Ending of entry zone (0.00000412)
Entry signal:
Signal to enter the market occurs when the price comes to " Buy zone " then forms one of the reversal patterns, whether " Bullish Engulfing ", " Hammer " or " Valley " in other words,
NO entry signal when the price comes to the zone BUT after any of the reversal patterns is formed in the zone.
To learn more about " Entry signal " and the special version of our " Price Action " strategy FOLLOW our lessons:
Take Profits:
TP1= @ 0.00000500
TP2= @ 0.00000576
TP3= @ 0.00000680
TP4= @ 0.00000684
TP5= @ 0.00000684
TP6= @ 0.00000832
TP7= @ 0.00000960
TP8= @ 0.00001130
TP9= @ 0.00001370
TP10= @ 0.00001610
TP11= @ 0.00001955
TP12= @ 0.00002393
TP13= Free
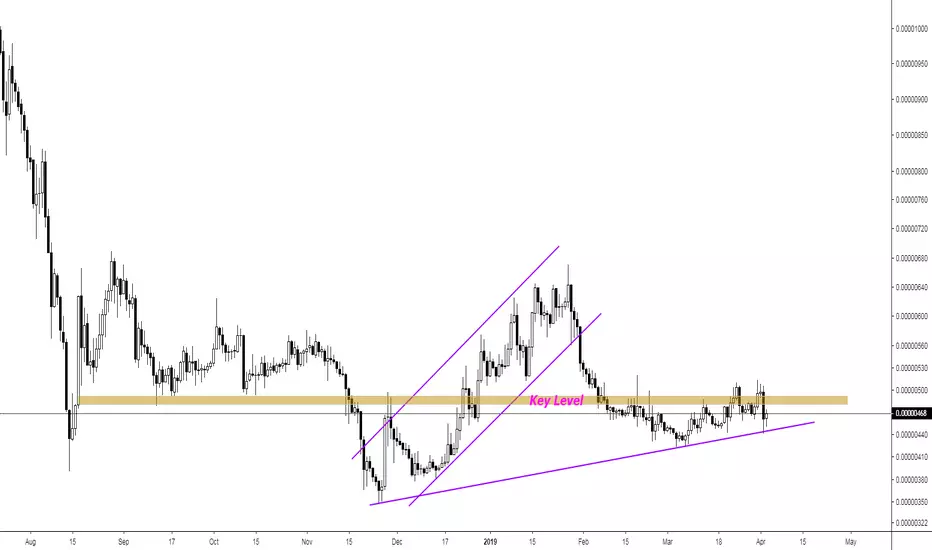
ZILBTC (Zilliqa) Can Boom AnyTime,,,!!#ZILBTC (Daily)
Looking Bullish..
If BrokeOut The Key Level (480-500 Sats)
Then We Can See Big Pump..
Lots Of Upcoming Events In Q2..
Keep An Eye On BTCUSD..
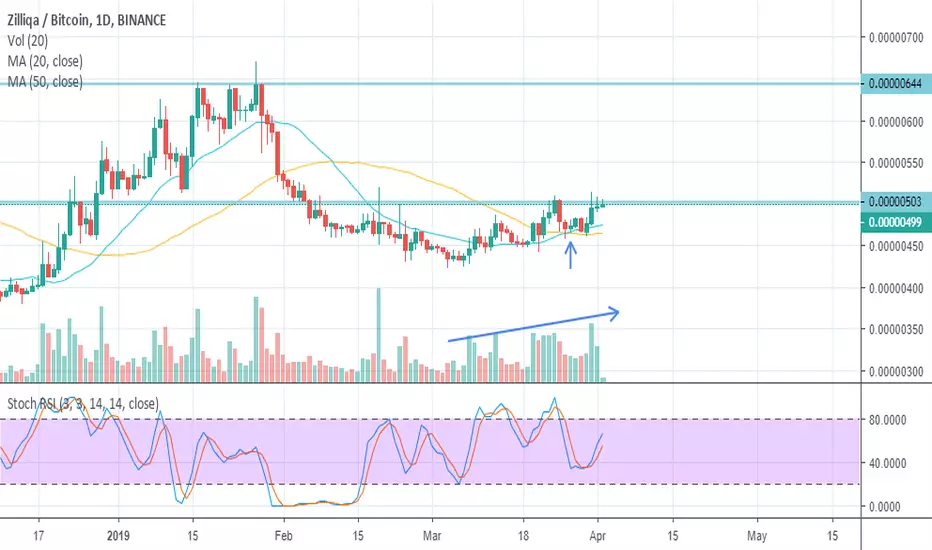
$ZIL looks ready to break resistance.Volume increasing and enough room to move up on the stochastic RSI.
20 and 50 MA crossed Bullish
Upcoming Tokenswap op 30 April.
Targeting next big resistance at 644
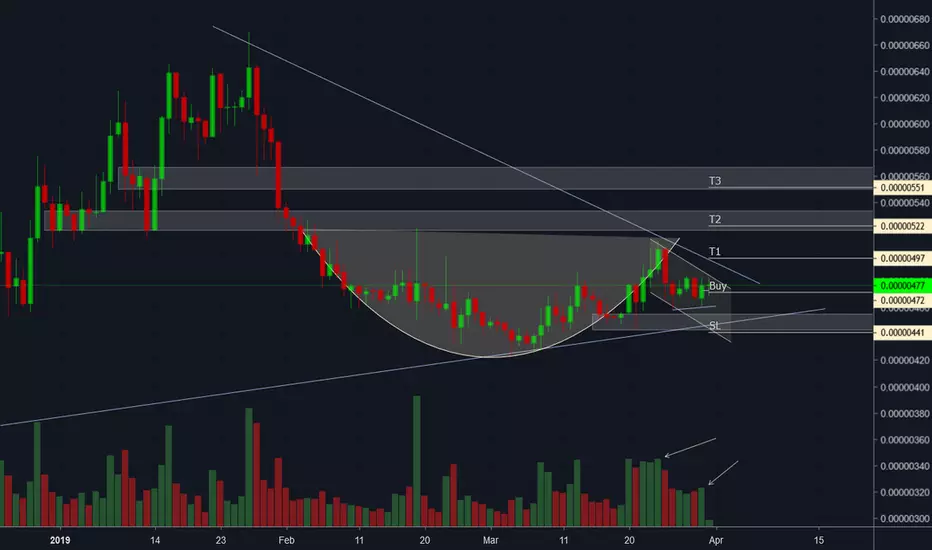
ZIL/BTC - Uptrend + Bull Pennant Breakout.Buy zone:
500
Sell targets:
524 +4.77%
559 +11.73%
593 +18.59%
Stop Loss: 486 -2.86%
Notes: Uptrend + Bull Pennant Breakout.

ZILBTC long swing trade setupHeres my TA for ZILBTC today... also covering BTCUSD in the video at around 8:08 .. youtu.be
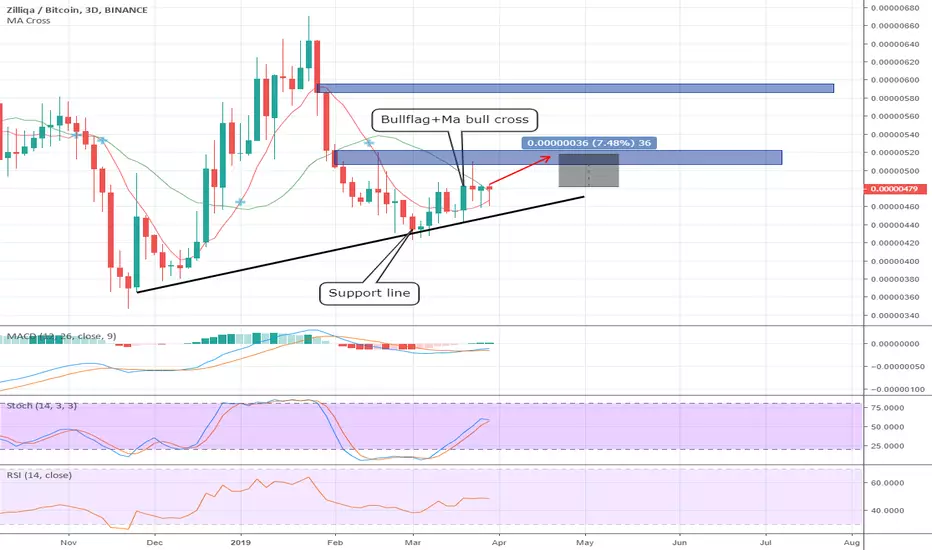
Ziliqa APRIL SHOOOOT
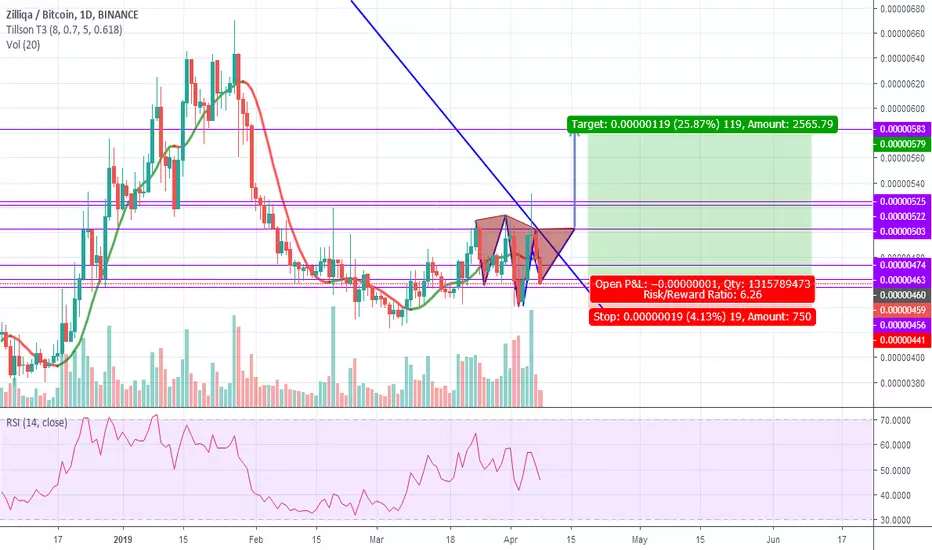
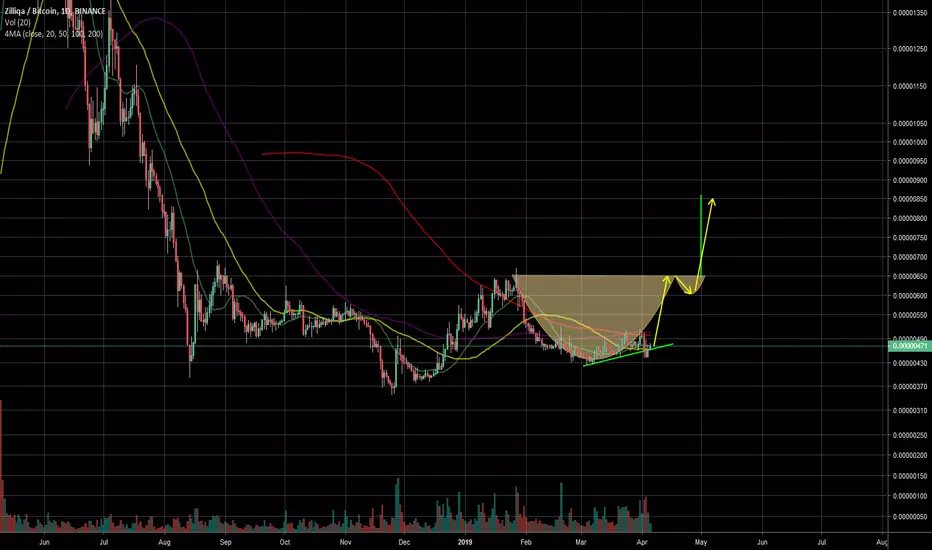
Ziliqa now is forming a bullflag in 3D timeframe + MA bullcross will happen what means this coin will go up untill 502-522 sats zone which is aprox 7% potentialy gains from here.
Macd bullcross and we still going up slowly,Rsi is below neutral zone at the moment but i expect a breakout soon because MA will help ziliqa a little bit
First target: 500-522
Second target 587-597 sats
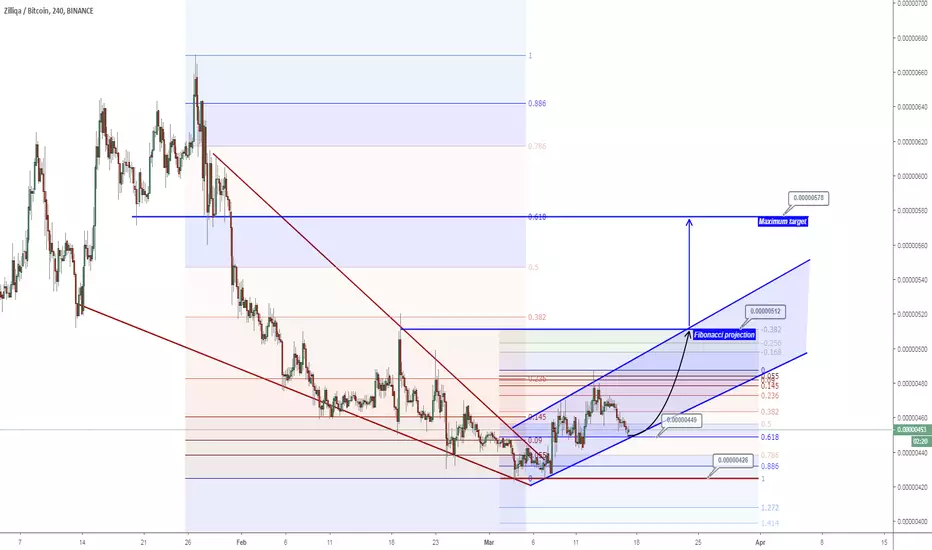
ZILBTC "support channel and 618 support"ZIL perform bullish channel up right now,
and today this coin touch support channel at 618 support. This is a good time to buy ZIL
For this setup, we have target at 512 with maximum projection at 578
If this pattern failed, ZIL will return to previous support at 426
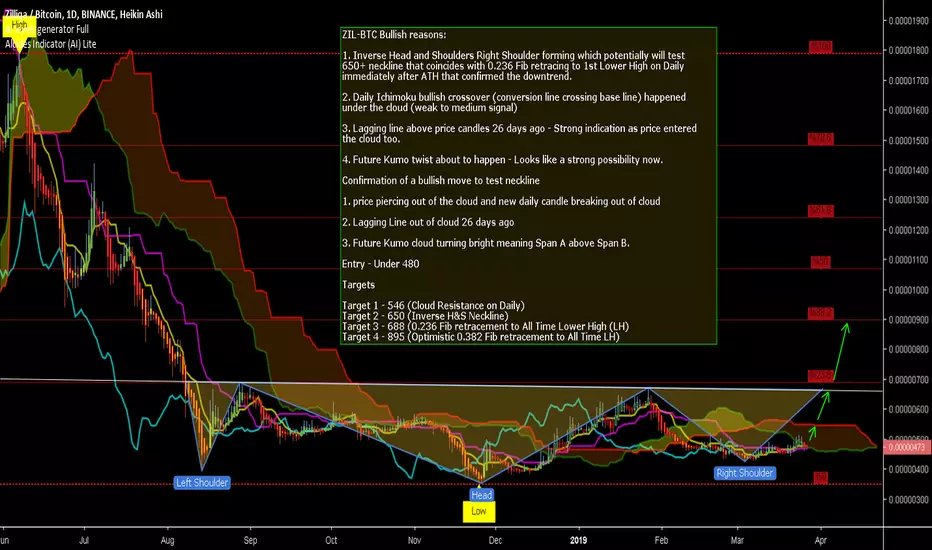
Time for Zilliqa to shine - Inverse H&S with Fibs/Ichimoku IdeaZIL-BTC Bullish reasons:
Inverse Head and Shoulders Right Shoulder forming which potentially will test 650+ neckline that coincides with 0.236 Fib retracing to 1st Lower High on Daily immediately after ATH that confirmed the downtrend.
Daily Ichimoku bullish crossover (conversion line crossing base line) happened under the cloud (weak to medium signal)
Lagging line above price candles 26 days ago - Strong indication as price entered the cloud too.
Future Kumo twist about to happen - Looks like a strong possibility now.
Confirmation of a bullish move to test neckline
Price piercing out of the cloud and new daily candle breaking out of cloud
Lagging Line out of cloud 26 days ago
Future Kumo cloud turning bright meaning Span A above Span B.
Trade Opportunity
Entry - Under 480
Stop Loss - 420
Targets
Target 1 - 546 (Cloud Resistance on Daily)
Target 2 - 650 (Inverse H&S Neckline)
Target 3 - 688 (0.236 Fib retracement to All Time Lower High (LH)
Target 4 - 895 (Optimistic 0.382 Fib retracement to All Time LH)
If you like this idea, give me a thumbs up. Also have a look at my AI Lite indicator which populates BUY/SELL signals on chart based on a high probability system that I have developed. If you would like to try it, PM me. If you are a new trader/beginner and would like a TA coaching session, PM me for a free 30m session on Team Viewer.
Happy trading.
Telegram - t.me
Twitter - @TradeChartist
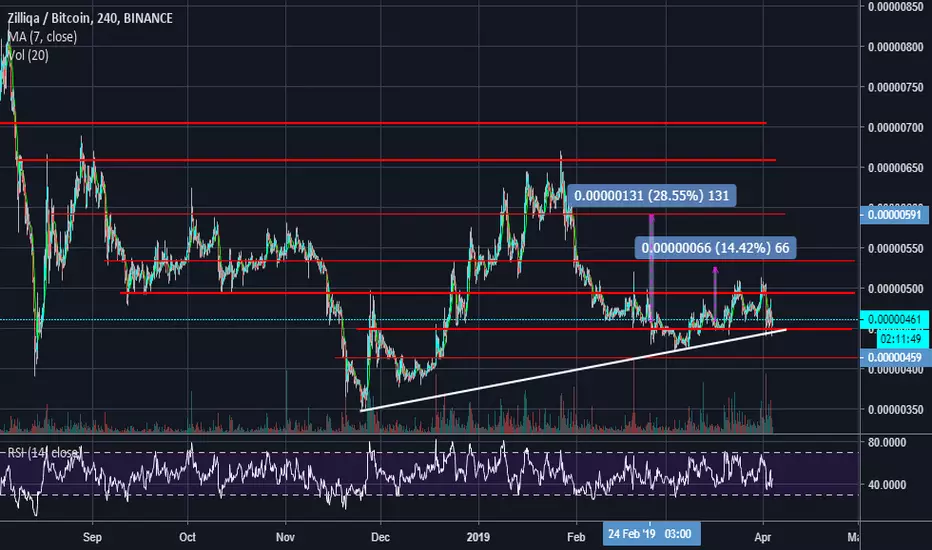
ZILBTC Pump incoming for 35% GAINS? #ZIL #ZILBTC $ZIL #CRYPTOAs we outlined in our previous analysis for BINANCE:ZILBTC
This coin has been heavily accumulated by whales during past few weeks.
Hence we have been TOO!
Now as per our analysis we may see a nice run up for ZIL up to recent highs of 620 sats.
CALL is shared in our Premium group with entries and targets.
Feel free to message us on Telegram!
Comments/likes/shares appreciated!
