Zilliqa (ZIL) - May 19Good morning?
Dear traders, nice to meet you.
By "following" you can always get new information quickly.
Please also click "Like".
Have a good day.
-------------------------------------
(ZILUSD 1W chart)
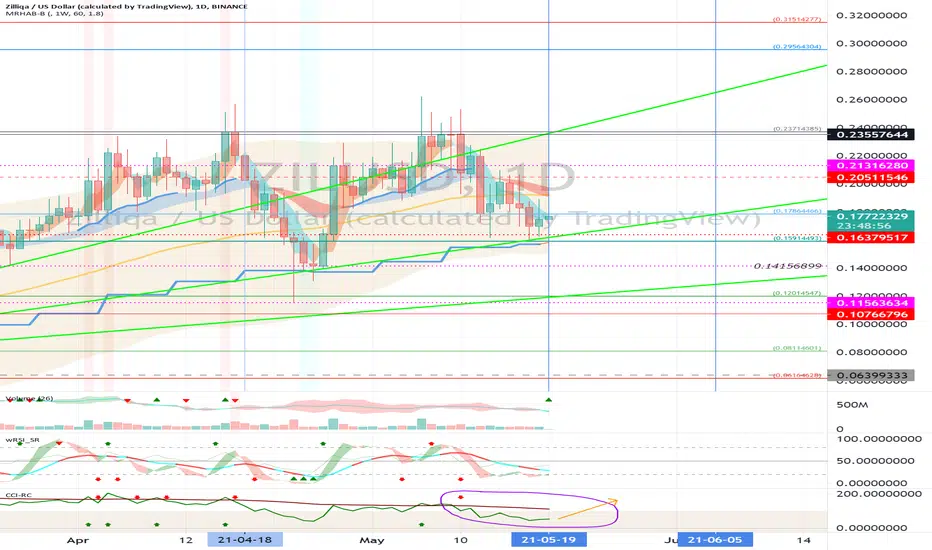
(1D chart)
We need to see if we can get support and climb in the 0.15914493-0.17864466 range.
If it falls at 0.15914493, you need a Stop Loss to preserve profit or loss.
However, you can touch the 0.14156899 point and go up, so you need to trade carefully.
------------------------------------
(ZILBTC 1W chart)
(1D chart)
We have to see if we can get support and ascend in the 398 Satoshi-421 Satoshi section.
If it falls, we need to see if we can get support at point 387 and move up along the uptrend line.
If the CCI line does not rise above 100 points and the EMA line on the CCI-RC indicator, it is likely to be in a downtrend and requires careful trading.
In order to maintain the uptrend, it must rise above the 0.20511546 point and be supported.
--------------------------------------
It is advisable to trade at your average unit price.
This is because if the price flows below your average unit price, which was on an uptrend or downtrend, there is a high possibility that you will not be able to earn a large profit due to the psychological burden.
The center of every trade starts with the average unit price you start trading.
If you ignore this, you may be trading in the wrong direction.
Therefore, it is important to find a way to lower the average unit price and adjust the proportion of the investment, so that the money that ultimately corresponds to the profit can regenerate the profit.
-------------------------------------------------- -------------------------------------------
** All indicators are lagging indicators.
So, it's important to be aware that the indicator moves accordingly with the movement of price and volume.
Just for the sake of convenience, we are talking upside down for interpretation of the indicators.
** The wRSI_SR indicator is an indicator created by adding settings and options from the existing Stochastic RSI indicator.
Therefore, the interpretation is the same as the conventional stochastic RSI indicator. (K, D line -> R, S line)
** The OBV indicator was re-created by applying a formula to the DepthHouse Trading indicator, an indicator that oh92 disclosed. (Thank you for this.)
** Check support, resistance, and abbreviation points.
** Support or resistance is based on the closing price of the 1D chart.
** All explanations are for reference only and do not guarantee profit or loss on investment.
Explanation of abbreviations displayed on the chart
R: A point or section of resistance that requires a response to preserve profits
S-L: Stop Loss point or section
S: A point or segment that can be bought for profit generation as a support point or segment
(Short-term Stop Loss can be said to be a point where profits and losses can be preserved or additionally entered through installment transactions. It is a short-term investment perspective.)
GAP refers to the difference in prices that occurred when the stock market, CME, and BAKKT exchanges were closed because they do not trade 24 hours a day.
G1: Closing price when closed
G2: Market price at the time of opening
(Example) Gap (G1-G2)
ZILKRW
Zilliqa (ZIL) - April 25Hello?
Dear traders, nice to meet you.
By "following" you can always get new information quickly.
Please also click "Like".
Have a good day.
----------------------------------
(ZILUSD 1W chart)
In order to continue the uptrend, it needs to be supported at 0.14156899.
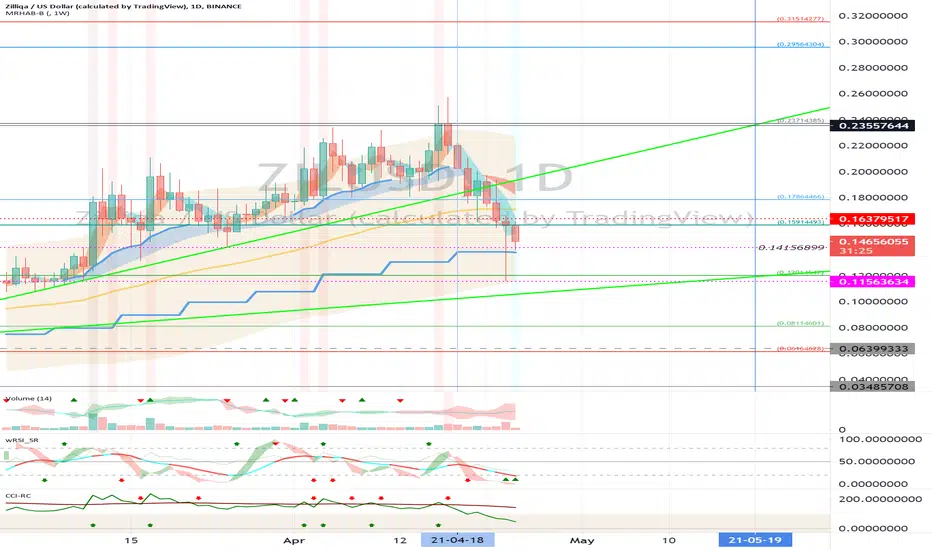
(1D chart)
We have to see if we can get support at 0.14156899 and climb to the 0.15914493-0.17864466 range.
In order to turn to an uptrend, it must rise above 0.17864466 points and gain support.
If it falls at 0.11563634, you need a Stop Loss to preserve profit or loss.
However, you can touch the 0.06399333 point and climb, so you need to think about how to respond.
----------------------------------
(ZILBTC 1W chart)
In order to continue the uptrend, it needs to be supported at the 287 Satoshi point.
(1D chart)
We have to see if we can get support at the 287 Satoshi point and climb above the 298 Satoshi point.
If it falls at the 262 Satoshi point, Stop Loss is needed to preserve profit and loss.
However, you need to trade carefully as you can touch and climb the 191 Satoshi point.
--------------------------------------
It is advisable to trade at your average unit price.
This is because if the price flows below your average unit price, which was on an uptrend or downtrend, there is a high possibility that you will not be able to earn a large profit due to the psychological burden.
The center of every trade starts with the average unit price you start trading.
If you ignore this, you may be trading in the wrong direction.
Therefore, it is important to find a way to lower the average unit price and adjust the proportion of the investment, so that the money that ultimately corresponds to the profit can regenerate the profit.
-------------------------------------------------- -------------------------------------------
** All indicators are lagging indicators.
So, it's important to be aware that the indicator moves accordingly with the movement of price and volume.
Just for the sake of convenience, we are talking upside down for interpretation of the indicators.
** The wRSI_SR indicator is an indicator created by adding settings and options from the existing Stochastic RSI indicator.
Therefore, the interpretation is the same as the conventional stochastic RSI indicator. (K, D line -> R, S line)
** The OBV indicator was re-created by applying a formula to the DepthHouse Trading indicator, an indicator that oh92 disclosed. (Thank you for this.)
** Check support, resistance, and abbreviation points.
** Support or resistance is based on the closing price of the 1D chart.
** All explanations are for reference only and do not guarantee profit or loss on investment.
Explanation of abbreviations displayed on the chart
R: A point or section of resistance that requires a response to preserve profits
S-L: Stop Loss point or section
S: A point or segment that can be bought for profit generation as a support point or segment
(Short-term Stop Loss can be said to be a point where profits and losses can be preserved or additionally entered through installment transactions. It is a short-term investment perspective.)
GAP refers to the difference in prices that occurred when the stock market or CME and BAKKT exchanges were closed because they are not trading 24 hours a day.
G1: Closing price when closed
G2: Cigar at the time of opening
(Example) Gap (G1-G2)
Zilliqa (ZIL) - April 10Hello?
Dear traders, nice to meet you.
By "following" you can always get new information quickly.
Please also ask for the "Like" clock.
Have a good day.
----------------------------------
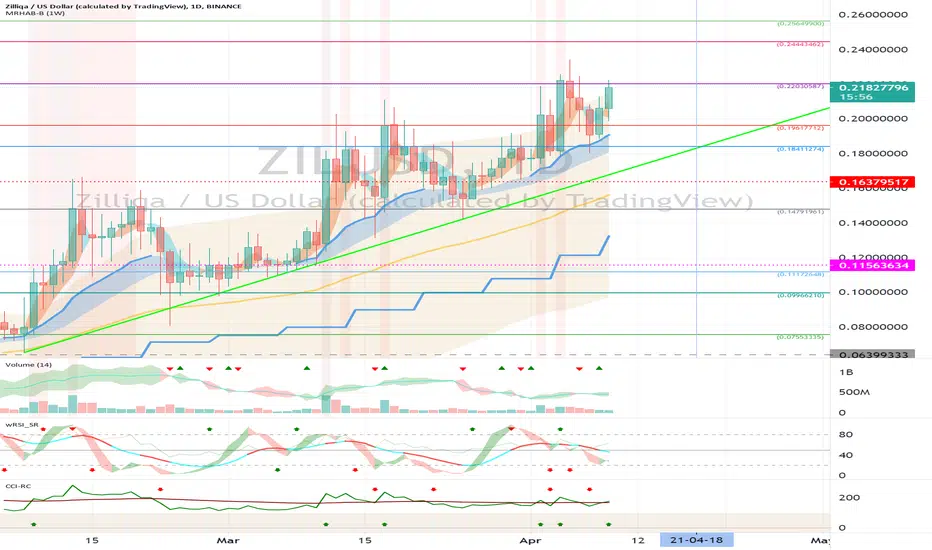
We'll have to climb above the 0.22030587 point and see if we can get support.
If it goes down, you need to make sure you get support at 0.19617712.
If you go down at 0.18411274, you need a short stop loss.
However, it may rise along the uptrend line, so careful trading is necessary.
In the CCI-RC indicator, it remains to be seen if the CCI line is supported by the EMA line and can continue the upward trend.
The next volatility period is around April 18th.
(1W chart)
----------------------------------
(ZILBTC 1W chart)
(1D chart)
We must watch for any movement that deviates from the 330 Satoshi-398 Satoshi section.
If it falls from the 330 Satoshi point, a short stop loss is required.
However, you need to trade carefully as you can touch and climb the 298 Satoshi point.
If it falls between 262 Satoshi and 274 Satoshi, you need Stop Loss to preserve profit and loss.
However, you need to trade carefully as you can touch and climb the 239 Satoshi point.
-------------------------------------------------- -------------------------------------------
** All indicators are lagging indicators.
So, it's important to be aware that the indicator moves accordingly with the movement of price and volume.
Just for the sake of convenience, we are talking upside down for interpretation of the indicators.
** The wRSI_SR indicator is an indicator created by adding settings and options from the existing Stochastic RSI indicator.
Therefore, the interpretation is the same as the conventional stochastic RSI indicator. (K, D line -> R, S line)
** The OBV indicator was re-created by applying a formula to the DepthHouse Trading indicator, an indicator that oh92 disclosed. (Thank you for this.)
** Check support, resistance, and abbreviation points.
** Support or resistance is based on the closing price of the 1D chart.
** All explanations are for reference only and do not guarantee profit or loss on investment.
Explanation of abbreviations displayed on the chart
R: A point or section of resistance that requires a response to preserve profits
S-L: Stop Loss point or section
S: A point or segment that can be bought for profit generation as a support point or segment
(Short-term Stop Loss can be said to be a point where profits and losses can be preserved or additionally entered through installment transactions. It is a short-term investment perspective.
GAP refers to the difference in prices that occurred when the stock market, CME, and BAKKT exchanges were closed because they do not trade 24 hours a day.
G1: Closing price when closed
G2: Cigar at the time of opening
(Example) Gap (G1-G2)
Zilliqa (ZIL) - March 31Hello?
Dear traders, nice to meet you.
By "following" you can always get new information quickly.
Please also ask for the "Like" clock.
Have a nice day.
----------------------------------
We'll have to see if we can get support at 0.18411274 and make a strong break above 0.19617712.
If it goes down, you need to make sure you get support at 0.16379517.
If you go down at 0.16379517, you need a short stop loss.
However, it may rise along the uptrend line, so careful trading is necessary.
In order to break through the 0.2 price range, we have to see if we can emit power in the 0.18411274-0.19617712 range.
-----------------------------------------
(ZILBTC 1D chart)
We must watch for any movement that deviates from the 298 Satoshi-330 Satoshi section.
If you fall from the 298 Satoshi point, you need a short stop loss.
However, it may rise along the uptrend line, so careful trading is necessary.
If support is received in the 330 Satoshi-350 Satoshi section and a strong break through the 350 Satoshi point, a movement toward the 423 Satoshi point is expected.
-------------------------------------------------- -------------------------------------------
** All indicators are lagging indicators.
So, it's important to be aware that the indicator moves accordingly with the movement of price and volume.
Just for the sake of convenience, we are talking upside down for interpretation of the indicators.
** The wRSI_SR indicator is an indicator created by adding settings and options from the existing Stochastic RSI indicator.
Therefore, the interpretation is the same as the conventional stochastic RSI indicator. (K, D line -> R, S line)
** The OBV indicator was re-created by applying a formula to the DepthHouse Trading indicator, an indicator that oh92 disclosed. (Thank you for this.)
** Check support, resistance, and abbreviation points.
** Support or resistance is based on the closing price of the 1D chart.
** All explanations are for reference only and do not guarantee profit or loss on investment.
Explanation of abbreviations displayed on the chart
R: A point or section of resistance that requires a response to preserve profits
S-L: Stop Loss point or section
S: A point or segment that can be bought for profit generation as a support point or segment
(Short-term Stop Loss can be said to be a point where profits and losses can be preserved or additionally entered through installment transactions. It is a short-term investment perspective.)
GAP refers to the difference in prices that occurred when the stock market, CME, and BAKKT exchanges were closed because they do not trade 24 hours a day.
G1: Closing price when closed
G2: Cigar at the time of opening
(Example) Gap (G1-G2)

Zilliqa (ZIL) - November 4Hello?
Dear traders, nice to meet you.
"Like" is a huge force for me.
By "following" you can always get new information quickly.
Thank you for always supporting me.
-------------------------------------------------- -----
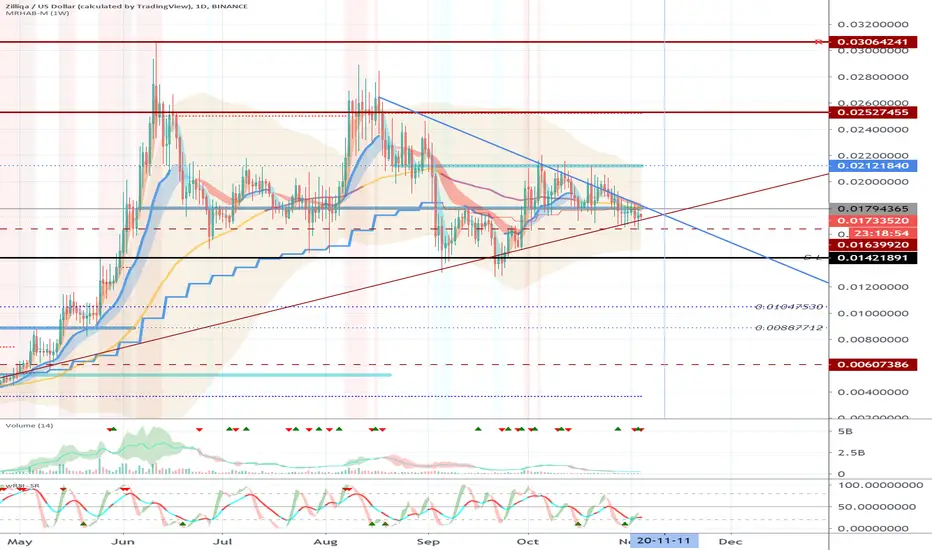
It remains to be seen if it can rise above the 0.01794365 point around November 11th, following the upward trend line.
If you gain support and rise at 0.01421891, it is expected to create a new wave.
-------------------------------------------------- -------------------------------------------
** Check support, resistance, and abbreviation points.
** Support or resistance is based on the closing price of the 1D chart.
** All explanations are for reference only and do not guarantee profit or loss on investment.
Explanation of abbreviations displayed on the chart
R: A point or section of resistance that requires a response to preserve profits
S-L: Stop-Loss point or section
S: A point or segment that can be bought for profit generation as a support point or segment
(Short-term Stop Loss can be said to be a point where profits and losses can be preserved or additionally entered through installment trading. You should trade from a short-term investment perspective.)