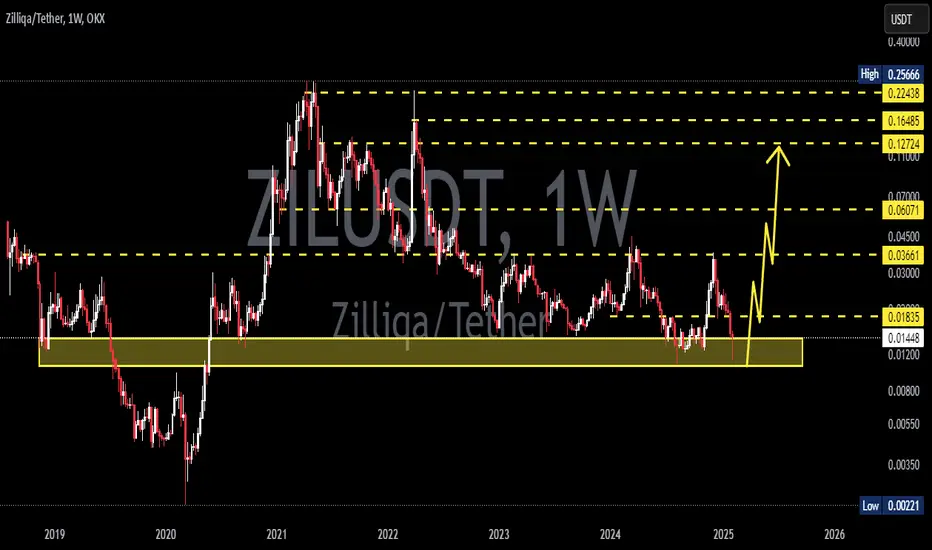
ZILUSDT 1WZIL ~ 1W Analysis
#ZIL Buy gradually from here if you still have a Conviction on this Coin with a minimum target of 20%++
Zilusdsignals
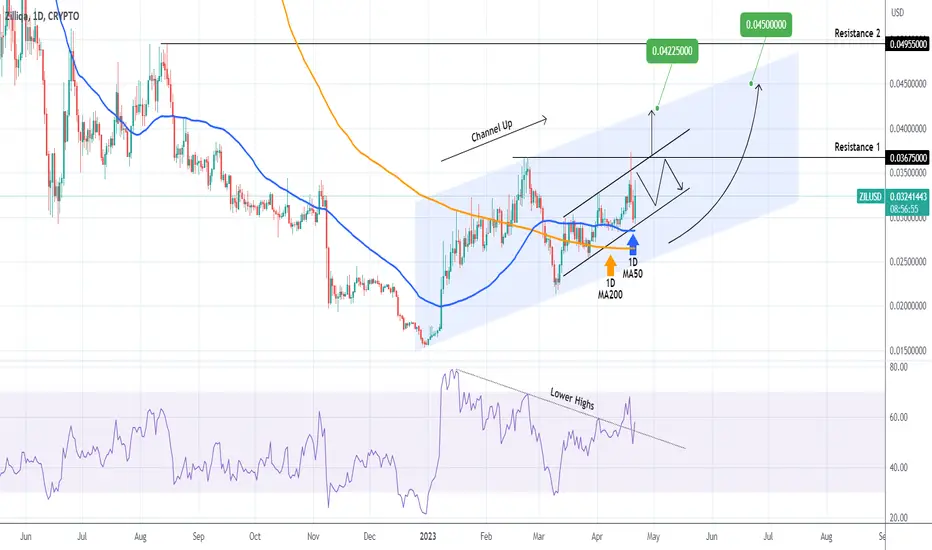
ZILUSD Break-out and pull-back buy levelsZilliqa (ZILUSD) is trading within two Channel Up patterns, supported by both the 1D MA50 (blue trend-line) and 1D MA200 (orange trend-line). With the 1D RSI breaking above its Lower Highs trend-line, the trend is slightly more bullish now and it is more probable to break above Resistance 1 (0.03675) than pull-back to its bottom. If we close a 1D candle above it, we will buy the break-out and target 0.04250. If instead the price pulls back to the Channel's bottom, we will buy on the 1D MA200 and then target long-term 0.04500.
-------------------------------------------------------------------------------
** Please LIKE 👍, FOLLOW ✅, SHARE 🙌 and COMMENT ✍ if you enjoy this idea! Also share your ideas and charts in the comments section below! **
-------------------------------------------------------------------------------
💸💸💸💸💸💸
👇 👇 👇 👇 👇 👇
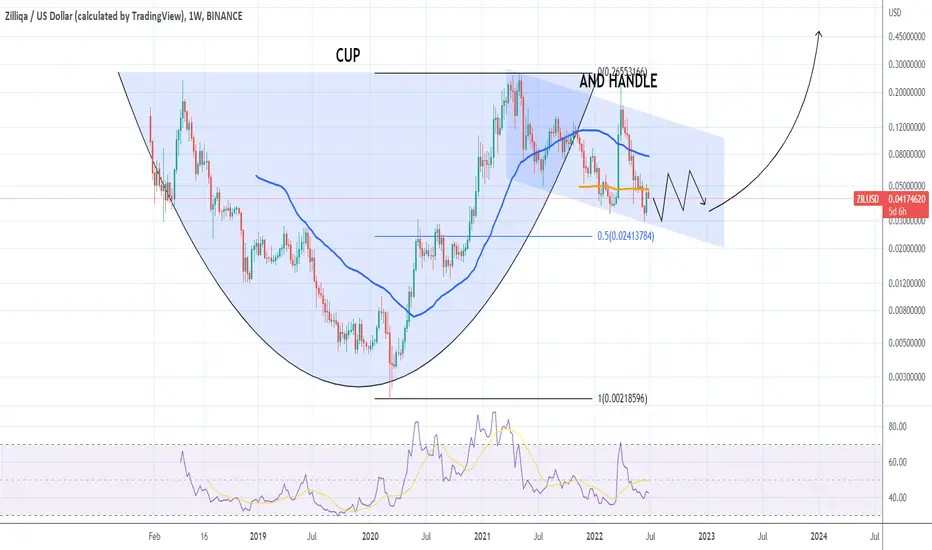
ZILUSD Giant Cup & Handle to start the new Bull CycleWe rarely see analyses of Zilliqa (ZILUSD) on the 1W time-frame but with a simple look at the chart we can see the huge Cup and Handle (C&H) pattern that has been formed since the start of the previous Cycle. The Resistance is perfect and since the May 2021 High, the pattern is forming the Handle. The 0.5 Fibonacci level is holding and the price should start forming the Support that will turn the trend sideways into the next bullish break-out that should start the new Bull Cycle. Optimal long-term buying levels here.
--------------------------------------------------------------------------------------------------------
Please like, subscribe and share your ideas and charts with the community!
--------------------------------------------------------------------------------------------------------
ZILUSD Perfect buy level for a complete recoveryZiliqa (ZILUSD) is rebounding after almost hitting the former Lower Highs trend-line, which happens to be just below the 1D MA200 (orange trend-line). The pattern is quite similar to the late February - mid March 2020 COVID market crash. Even in RSI terms, the sequences are fairly identical. As long as the former Lower Highs hold, we are expecting a strong recovery back to the April 01 High, even the 0.2650 High of May 2021.
--------------------------------------------------------------------------------------------------------
Please like, subscribe and share your ideas and charts with the community!
--------------------------------------------------------------------------------------------------------

ZILUSD Strong break-out but wait for the MA200 if you missed it.Zilliqa (ZILUSD) is on a strong bullish break-out since Saturday, having broken above the Lower Highs trend-line of its May 06 2021 High. At the same time it broke above the 1D MA200 (orange trend-line) as well, which should now act as the long-term Support if the market is to build a sustainable uptrend from now on.
If we exclude the COVID crash of March 2020, we see a similar bullish break-out on ZIL during the last Cycle. The 1D MA200 break-out on February 03 2020 was followed by this Black Swan event and after the market stabilized, ZIL made a last 1D MA200 test before the rally towards the previous long-term Resistance. So if you missed the current break-out, it would be best to wait for a pull-back near the 1D MA200 again, unless we witness another Black Swan event, which of course don't come and go every year. Our projection is that ZILUSD can test its 0.2600 - 0.2700 Resistance Zone by the end of June.
--------------------------------------------------------------------------------------------------------
** Please support this idea with your likes and comments, it is the best way to keep it relevant and support me. **
--------------------------------------------------------------------------------------------------------
