ZK/USDT — Testing Long-Term Downtrend: Breakout or Rejection at?Summary
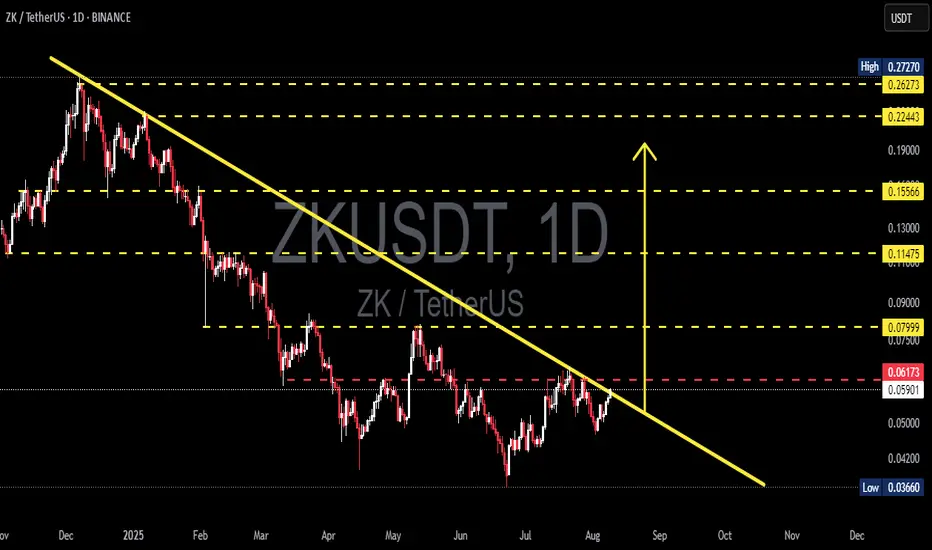
The daily chart shows a clear long-term downtrend from the previous highs — the descending trendline (yellow) has been capping price action, forming a sequence of lower highs and lower lows. Currently, price is hovering around 0.0591 USDT, testing both the trendline resistance and a key horizontal resistance at ~0.06173 (red dashed). Since the low at ~0.0366 (June), the market has been slowly forming higher lows, suggesting potential accumulation, but the main downtrend structure is still intact until a confirmed breakout occurs.
---
Pattern Overview
Descending trendline (yellow) = downtrend structure remains valid until a daily close above it.
Accumulation signs from the 0.0366 low → forming several higher lows.
Key resistance: 0.06173 (decision zone).
Next resistances (yellow dashed): 0.07999 → 0.11475 → 0.15566 → 0.22443 → 0.26273 → 0.27270.
Key support: ~0.042 (intermediate) → structural low at 0.03660.
---
Bullish Scenario (confirmation needed)
1. Breakout confirmation: A daily close above the descending trendline and above 0.0617 with stronger-than-average volume.
2. Post-breakout behavior: Potential retest of the broken trendline as support — a conservative entry point.
3. Upside targets:
Target 1: 0.07999 (~+29% from 0.06173; ~+35% from current price 0.05907)
Target 2: 0.11475 (~+86% from 0.06173)
Extended targets: 0.15566 → 0.22443 → 0.26273 → 0.27270
4. Risk management: Initial stop-loss under retest zone or, for aggressive entries, just below breakout candle’s low.
---
Bearish Scenario (rejection/failure)
1. Rejection at 0.0617 / trendline: If price fails to break and closes bearish with upper wicks, a pullback toward support is likely.
2. Support watch: ~0.042 (intermediate) → 0.03660 (structural low).
Downside from 0.0617: ~−29% to 0.042, ~−38% to 0.0366.
3. Further risk: A daily close below 0.0366 could trigger continuation of the major downtrend.
---
Key Levels (Quick View)
Current: 0.05907
Breakout trigger: 0.06173
Targets: 0.07999, 0.11475, 0.15566, 0.22443, 0.26273, 0.27270
Supports: ~0.042 → 0.03660
#ZK #ZKUSDT #Crypto #Altcoin #TechnicalAnalysis #TA #Trendline #Breakout #PriceAction
Zkanalysis
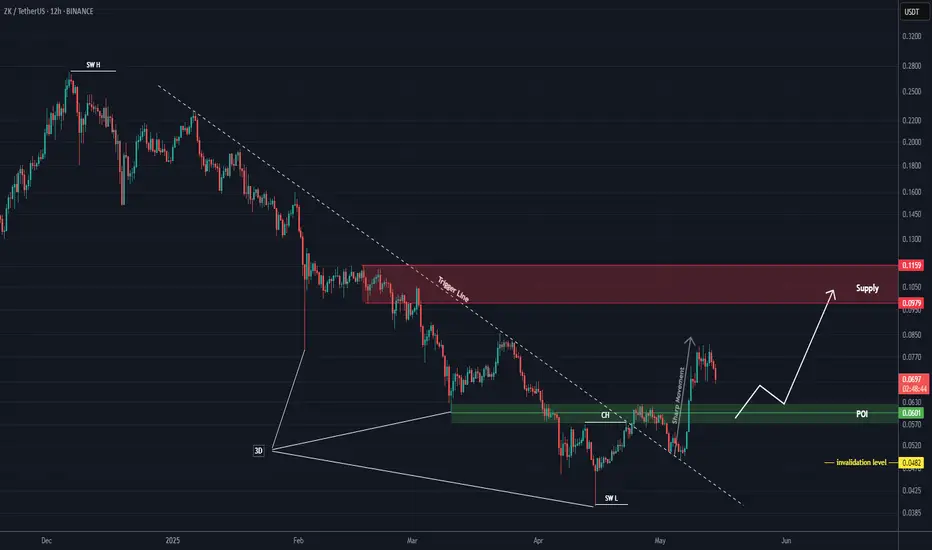
ZK Aanalysis (12H)After forming a 3D bottom, the price moved upward with a strong and rapid bullish wave that was stronger than the previous bullish waves within the bearish move, reclaiming a key zone. Additionally, an important trigger line has been broken, which strengthens the bullish outlook on ZK.
We are looking for buy/long positions within the green zone toward the targets. The targets are marked on the chart.
A daily candle closing below the invalidation level will invalidate this analysis.
For risk management, please don't forget stop loss and capital management
Comment if you have any questions
Thank You
ZKUSDT 2D AnalysisZK ~ 2D Analysis
#ZK Buy back from here with a short -term target of at least 15%+ from here.
