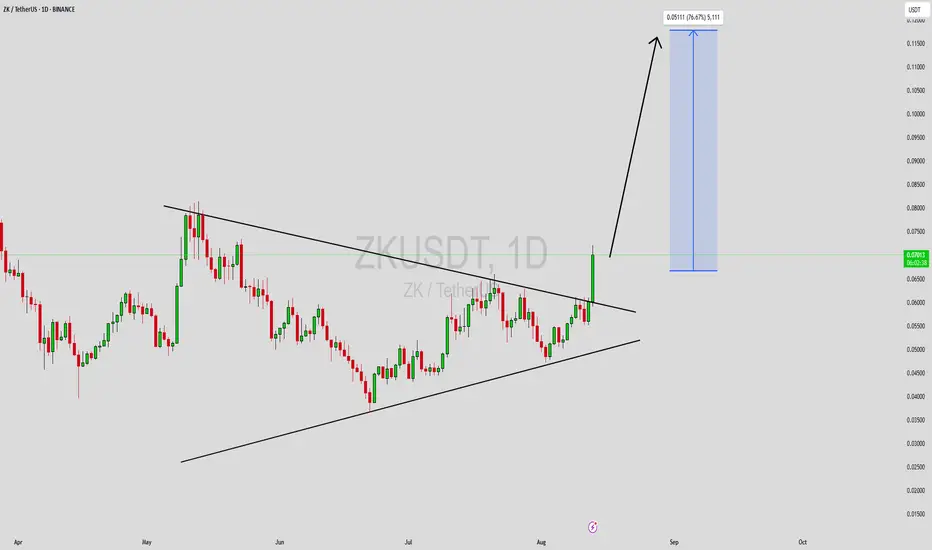
ZKUSDT Forming Symmetrical triangleZKUSDT has just broken out from a symmetrical triangle pattern, a technical formation that often signals a strong continuation move once resistance is breached. This breakout, supported by good trading volume, reflects growing bullish momentum as buyers step in with conviction. The projected potential gain of 60% to 70% makes this setup particularly attractive for swing traders and investors looking for short- to mid-term opportunities in the altcoin market.
The chart indicates that ZKUSDT has been consolidating within this pattern for several weeks, gradually tightening price action and building pressure for a decisive move. The breakout candle has closed above the resistance trendline, which is a strong confirmation signal for further upside movement. If bullish momentum continues, the next significant resistance levels could be reached quickly, aligning with the expected gain target.
Investor sentiment toward ZKUSDT is turning increasingly positive, driven by the technical breakout and solid market participation. With momentum on its side and market attention growing, ZKUSDT is positioned for a potential extended rally in the coming sessions.
✅ Show your support by hitting the like button and
✅ Leaving a comment below! (What is You opinion about this Coin)
Your feedback and engagement keep me inspired to share more insightful market analysis with you!
ZKBTC
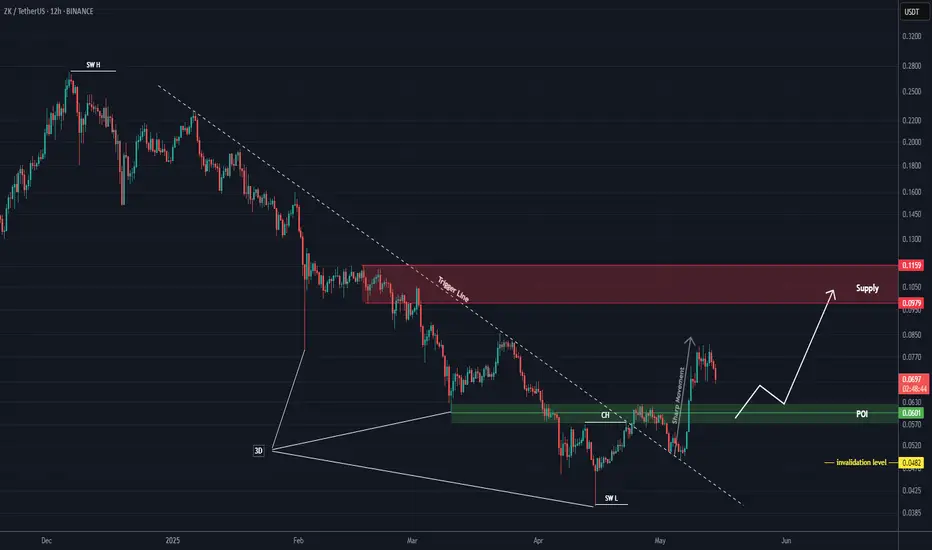
ZK Aanalysis (12H)After forming a 3D bottom, the price moved upward with a strong and rapid bullish wave that was stronger than the previous bullish waves within the bearish move, reclaiming a key zone. Additionally, an important trigger line has been broken, which strengthens the bullish outlook on ZK.
We are looking for buy/long positions within the green zone toward the targets. The targets are marked on the chart.
A daily candle closing below the invalidation level will invalidate this analysis.
For risk management, please don't forget stop loss and capital management
Comment if you have any questions
Thank You
#ZK/USDT#ZK
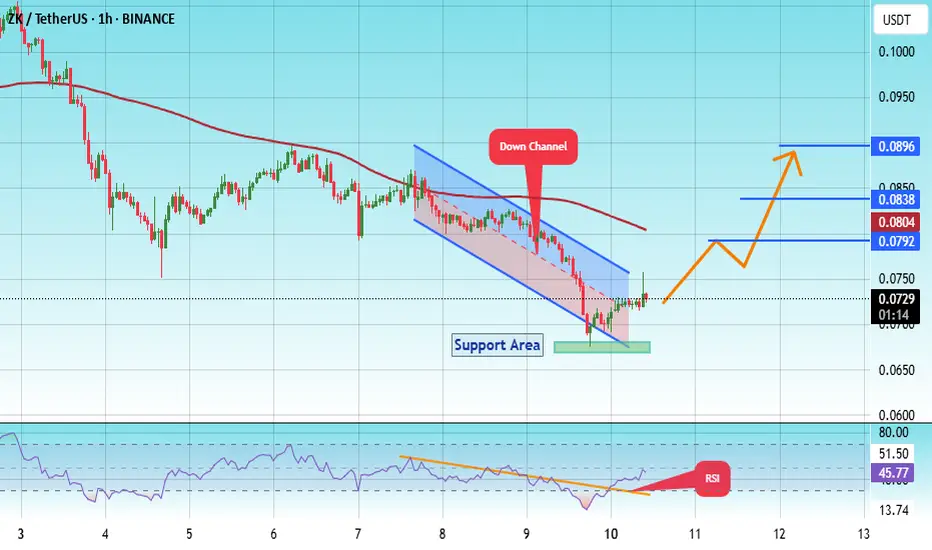
The price is moving in a descending channel on the 1-hour frame and is adhering to it well and is heading to break it upwards strongly and retest it
We have a bounce from the lower limit of the descending channel, this support is at a price of 0.0676
We have a downtrend on the RSI indicator that is about to break and retest, which supports the rise
We have a trend to stabilize above the moving average 100
Entry price 0.0729
First target 0.0792
Second target 0.0838
Third target 0.0896
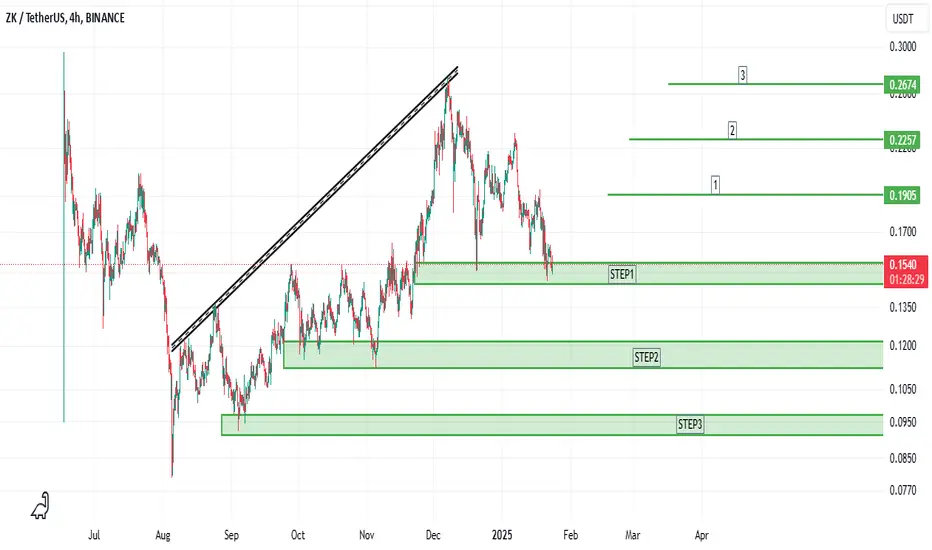
BUY ZKhello friends
This token has given a good profit with the increase in price, now with the correction of the price, we have a good opportunity to buy step by step and move with it to the specified goals with capital management.
*Trade safely with us*
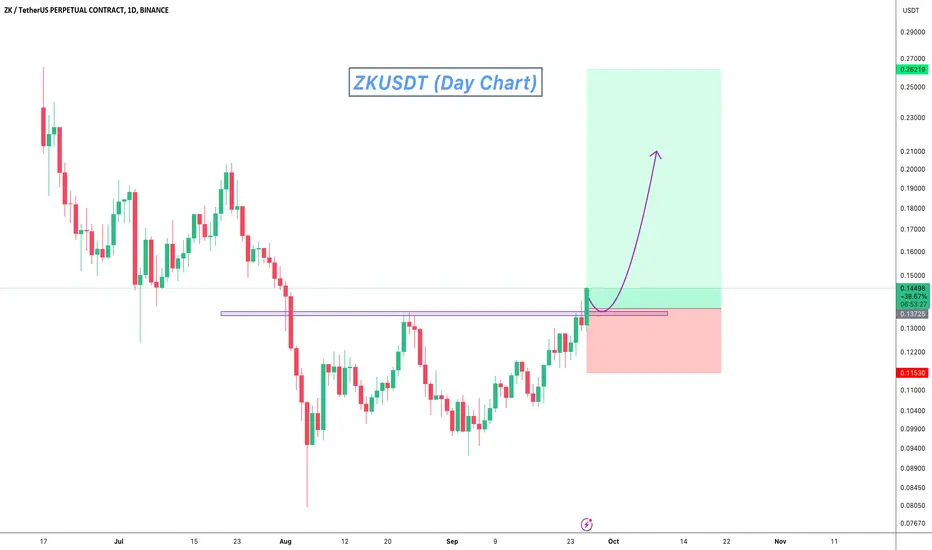
ZKUSDT Forming a Bullish W Pattern!ZKUSDT technical analysis update
ZK's price has broken the W pattern neckline resistance with high volume, showing potential to reach its all-time high (ATH) in a few weeks.
Buy Level: Below $0.14
Stop Loss: $0.114
Regards
hexa
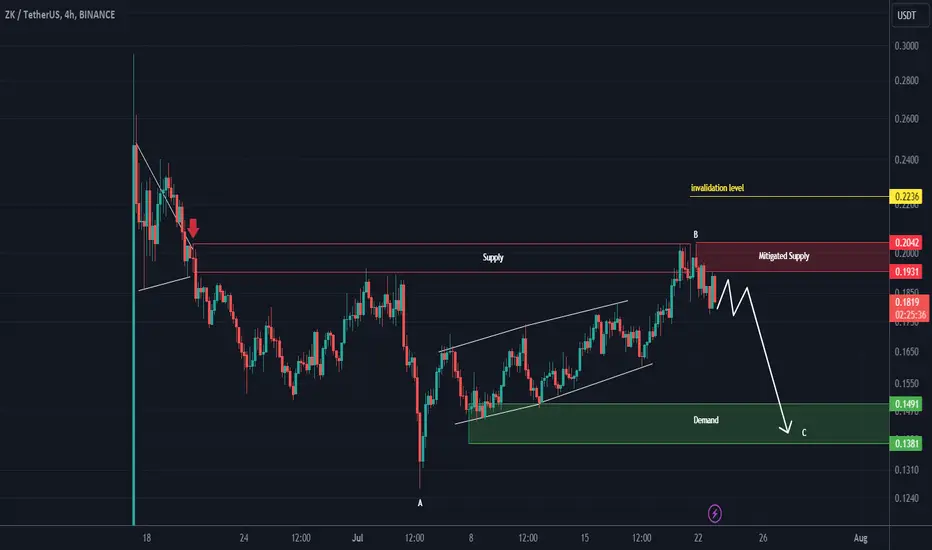
ZK ANALYSIS (4H)It seems that we have an ABC on the chart, where waves A and B have been completed and a wave C is left.
The target can be the green box.
Closing a daily candle above the invalidation level will violate the analysis.
For risk management, please don't forget stop loss and capital management
Comment if you have any questions
Thank You
ZKUSDT Triangle Pattern!ZKUSDT technical analysis update
ZK has formed a triangle pattern, and the price is breaking the triangle resistance on the 4-hour chart. If the 4-hour candle closes above the resistance, we can expect a good upward move in ZK.
Buy zone : Below $0.17
Stop loss : $0.154
Regards
Hexa
