Why Soybean Oil Outperforms Crude Oil?From their recent lows, soybean oil has quietly crept up by 50%, while crude oil has risen by 40%. The reason goes beyond the recent renewal of tensions in the Middle East — it runs deeper than that.
Mirco SoybeanOil Futures
Ticker: MZL
Minimum fluctuation:
0.02 per pound = $1.20
Disclaimer:
• What presented here is not a recommendation, please consult your licensed broker.
• Our mission is to create lateral thinking skills for every investor and trader, knowing when to take a calculated risk with market uncertainty and a bolder risk when opportunity arises.
CME Real-time Market Data help identify trading set-ups in real-time and express my market views. If you have futures in your trading portfolio, you can check out on CME Group data plans available that suit your trading needs tradingview.sweetlogin.com
Trading the Micro: www.cmegroup.com
www.cmegroup.com
Zl1

Why the Sudden Surge in Soybean Oil Prices?Recent sharp increases in Chicago soybean oil prices reflect a confluence of dynamic global and domestic factors. Geopolitical tensions, particularly those impacting crude oil markets, have played a significant role, as evidenced by the recent surge in Brent crude futures following events in the Middle East. This volatility in the broader energy complex directly influences the cost and strategic value of alternative fuels, positioning soybean oil at the forefront of this market shift.
A primary driver of this ascent is the transformative policy initiatives from the U.S. Environmental Protection Agency (EPA). The EPA's proposed Renewable Fuel Standard (RFS) volume requirements for 2026 and 2027 represent an aggressive push towards increased domestic biofuel production. These mandates, significantly exceeding previous targets, aim to bolster U.S. energy security and provide substantial support for American agriculture by boosting demand for soybeans and their derivatives. Key changes, such as the transition to RIN equivalents and reduced RIN costs for imports, are designed to further incentivize domestic consumption and reshape market dynamics.
This policy-driven demand fundamentally reorients the U.S. soybean oil market, causing Chicago Board of Trade futures to increasingly reflect internal American forces rather than global trends. This necessitates a shift in focus for traders towards physical market prices in other regions for international insights. The market has reacted swiftly, with notable increases in futures prices, a surge in open interest, and record trading volumes, indicating strong investor confidence in soybean oil's role within this evolving landscape. Concurrently, the new mandates exert pressure on imported biofuel feedstocks, further solidifying the emphasis on domestic supply.
Ultimately, the rise of soybean oil prices signifies more than just market speculation; it marks a pivotal transformation. It positions soybean oil as an essential commodity within the U.S.'s energy independence strategy, where robust domestic demand, shaped by forward-looking policy, becomes the prevailing force. This transition underscores how intertwined agricultural markets now are with national energy objectives and global geopolitical stability.
COT Analysis - Grains ZL & ZCZL & ZC are fundamentally setup for shorts if we get a confirmed daily bearish trend change.
I like ZL more than ZC, for reasons outlined in the video.
Have a good week.

USD Weakness and its OpportunitiesThe USD may be weaker, but it does mean that its bad.
Because a softer USD, some assets are starting to trend higher.
We will do a comparison between the USD and some of these assets or commodities, to see how reactive they are when the USD has trended lower in the recent months.
Soybean Oil Futures & Options
Ticker: ZL
Minimum fluctuation:
1/100 of one cent (0.0001) per pound = $6.00
Disclaimer:
• What presented here is not a recommendation, please consult your licensed broker.
• Our mission is to create lateral thinking skills for every investor and trader, knowing when to take a calculated risk with market uncertainty and a bolder risk when opportunity arises.
CME Real-time Market Data help identify trading set-ups in real-time and express my market views. If you have futures in your trading portfolio, you can check out on CME Group data plans available that suit your trading needs tradingview.sweetlogin.com

Soybean Oil Futures ( ZL1! ), H4 Potential for Bullish RiseTitle: Soybean Oil Futures ( ZL1! ), H4 Potential for Bullish Rise
Type: Bullish Rise
Resistance: 64.60
Pivot: 61.66
Support: 59.90
Preferred case: Looking at the H4 chart, my overall bias for ZL1!is bullish due to the current price being above the Ichimoku cloud , indicating a bullish market. Expecting price to retest the pivot at 61.66, where the overlap support and 23.6 % Fibonacci line is before heading towards the resistance at 64.60, where the overlap resistance and 61.8% Fibonacci line is.
Alternative scenario: Price could head back down to break the pivot at 61.66, where the overlap support and 23.6 % Fibonacci line is, before heading towards the support at 59.90, where the previous swing low is.
Fundamentals: There are no major news.

Looking for a sharp reversal on Soybean OilSoybean oil futures closed last session on a long established support level and down fib extension. With crude climbing back up and after today's sell off this is likely to pop when the market re-opens.
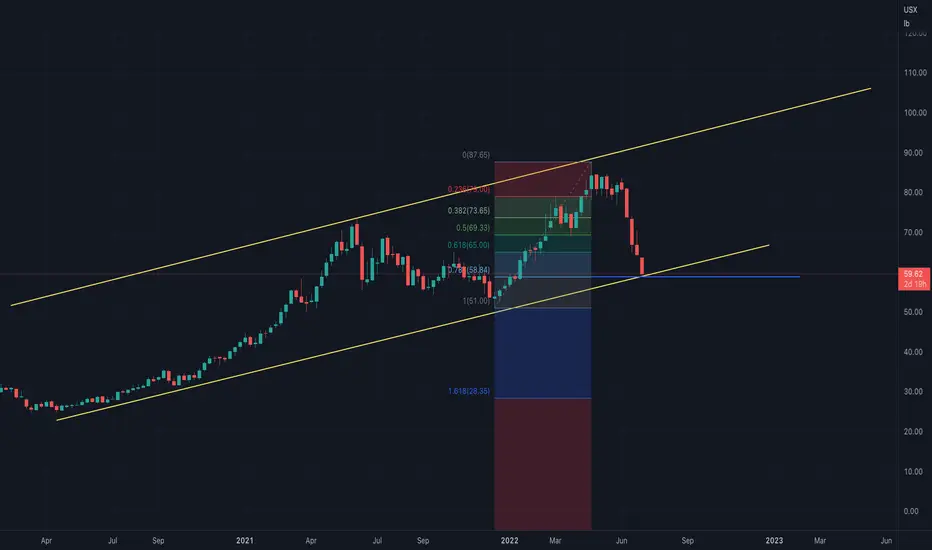
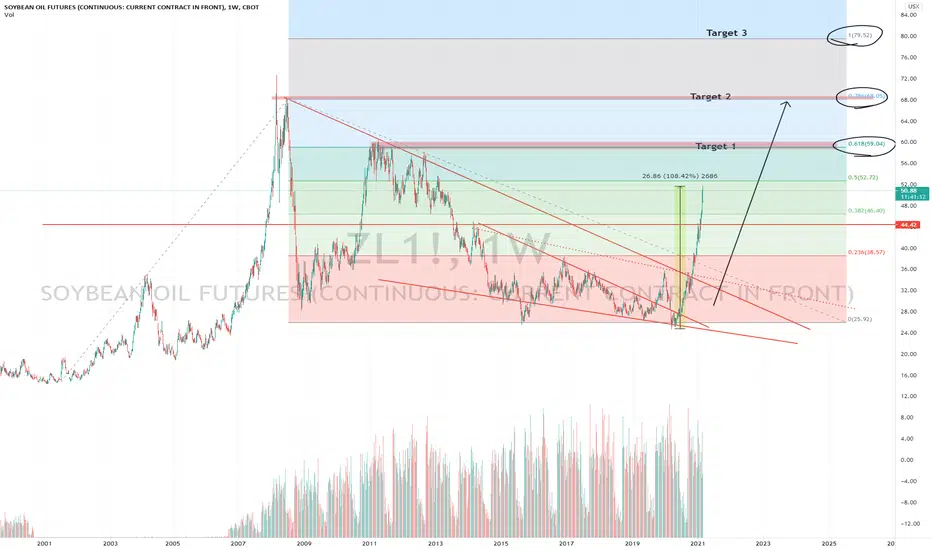
ZL1 (Y21.P1.E1).More highs to goHi Traders,
Now that Soya Bean oil has broken the last bottom structure resistance with a strong daily momentem, then tthe next 3 targets are based on the fib level or fib extensions with 0.618 fib level being the main retracement resistance.
Depending how it approaches the resistance level, will determine the next target or price action.
How to trade this or find entry?
Use the 8 or 12 hrly trend
All the best,
S.SAri
ZL Long breakout entry Mid termEnter long on breakout 45,7
SL 43,6
PT 48,2
BE 46,55
Mid term risky trade, so BE would be fast moved
RRR 1,27:1
CBOT:ZL1!

Soybean Oil-Breaking OutSoybean Oil is attempting to breakout of a possible flag this morning.
$ZL_F

soybeans oil ideaHi friends,
small leg down = c of 4 then up for wave 5
do not forget to follow me ^^

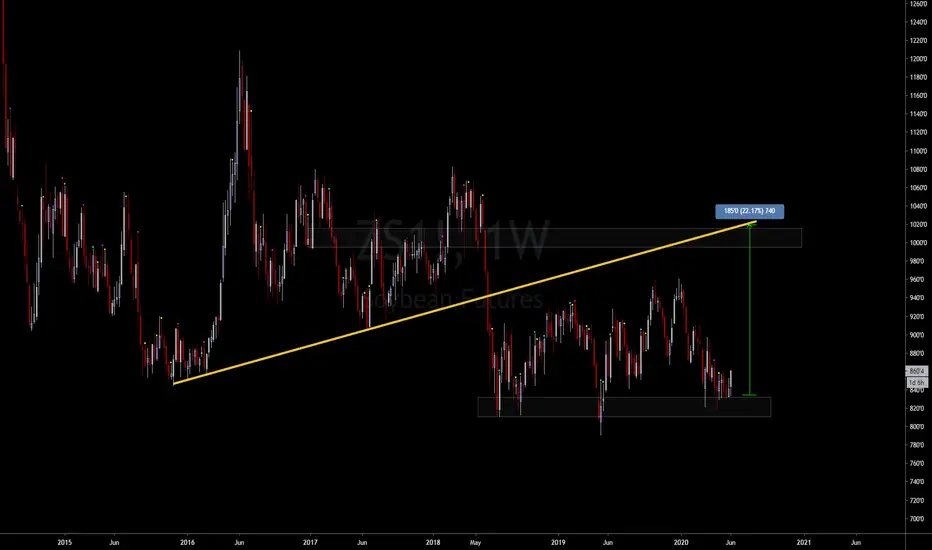
22% gains SoyBeansClear over under pattern on the Weekly.
Weekly closing strong-bullish in 1day+
Look to buy after weekly candle close with a Target of the supply overhead.


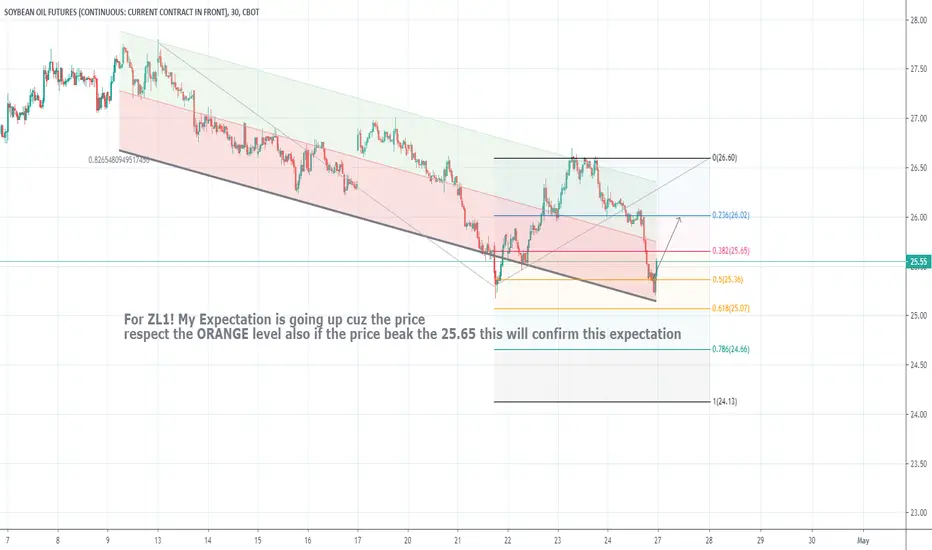
My Expectation For the #ZL1For ZL1! My Expectation is going up cuz the price respect the ORANGE level also if the price beak the 25.65 this will confirm this expectation
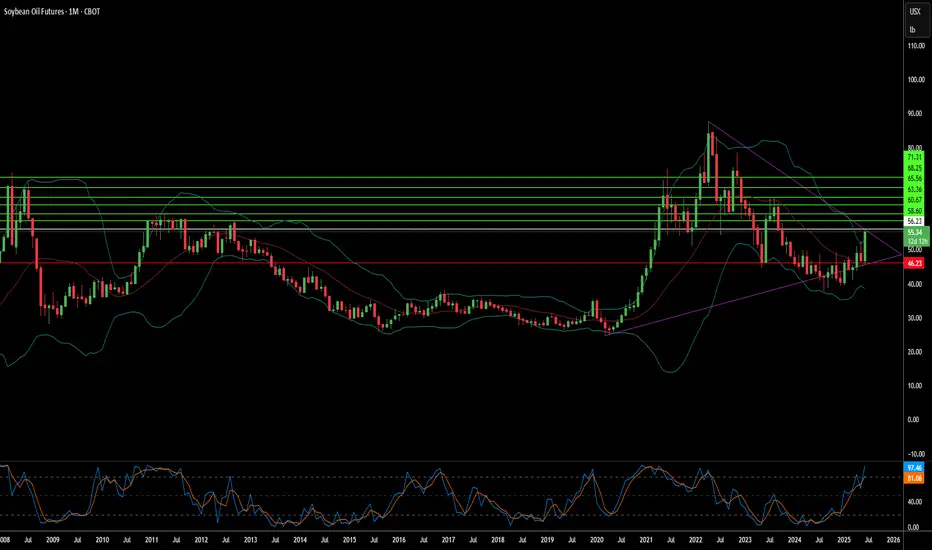
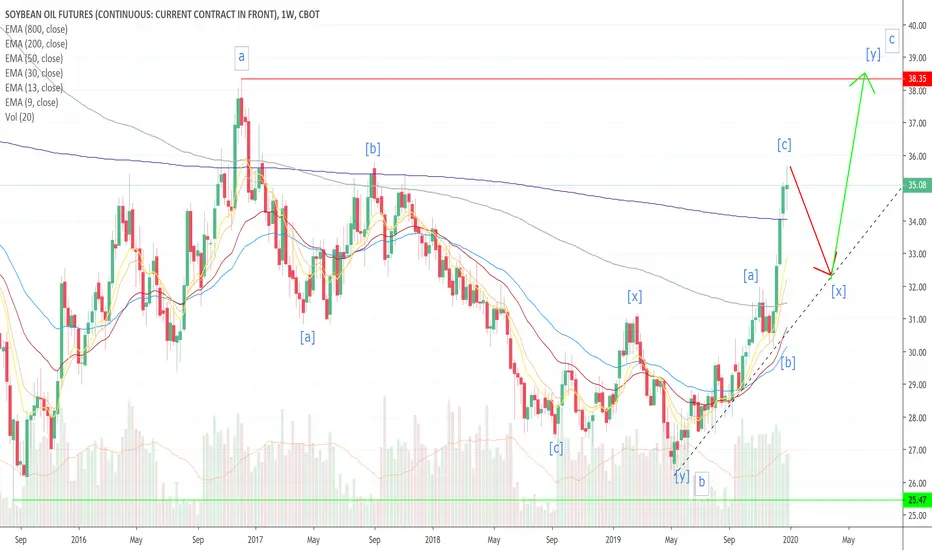
Long Term Prospects for SOY BEAN OILThe SOY BEAN OIL, symbol ZL, is in a Bear Market Rally with price trading above the 50 week ema, but the 50 ema below the 200 and 800 week emas. The 50 and 200 emas are starting to turn up, so price is starting to come out of accumulation / distribution. The price action appears to be finishing up the c-wave of a c-wave up, within a multi-year x-wave. This last week ended in a doji with a long wick up showing the rejection of higher prices. This is your indication showing the market is entering a period of consolidation where the emas start coming together.
The Market is in a Bear Market Rally on the daily, with price above the 50 ema, which is above the 200 and 800 emas, with the 200 ema still below the 800 ema. Price is topping out with three pushes up in this wave, and dark clouds and shooting stars warning of a top.
The Market is in a Bull Market on the 4 hour, with price trading above the 50 ema, which is above the 200 ema, which is above the 800 ema. Price is correcting having dropped below the 13 ema and having tested the 30 ema twice. There is also a big old nasty shooting star which makes for a good peak formation. Probably open down next week and trade up towards the back end of the coming week to finish out an M-Top formation, before starting a sideways consolidation, which will likely be a triangle.
This is my SOY BEAN OIL look ahead for my own trading purposes. FUTURES trading involves risk. Feel free to comment, but trade off of this post at your own peril.
Great month for ZLIncrease of 17 percent since start of December. Volatility is coming back for soybean oil futures. I would like to wish all of traders a happy new year and happy trading in year of 2020. Find a method that suit your personality. Feel free to message if you have any difficulties in trading.


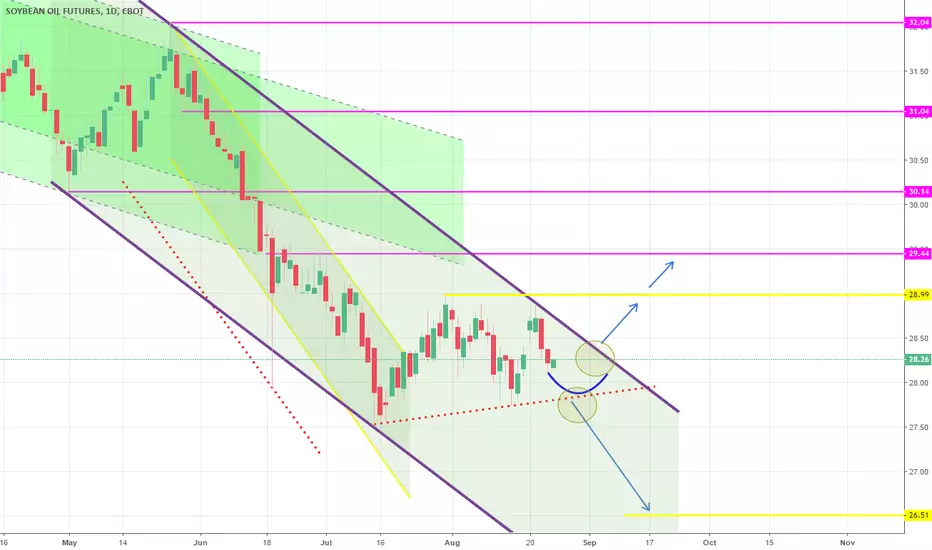
Targest hit. Wait for confirmation on breakout points.Both TP = 30.14 and 29.44 hit as the previous bearish Channel aggressively broke earlier and met the targets much earlier than I expected. Soybean Oil has now entered a new Channel Down on 1D, which is coming off a Lower High (hence Highs/Lows = 0, RSI = 51.334). We now need to wait for confirmation from the two break-out points (illustrated by the circles). If the upper point breaks then we will go long (TP = 28.99 and 29.44). If the lower point breaks then we will go short (TP = 26.51).
Mid-term cyclic bullish setup for Soybean oil - ZL CBOT FuturesLook forward for gain starts in early April


